
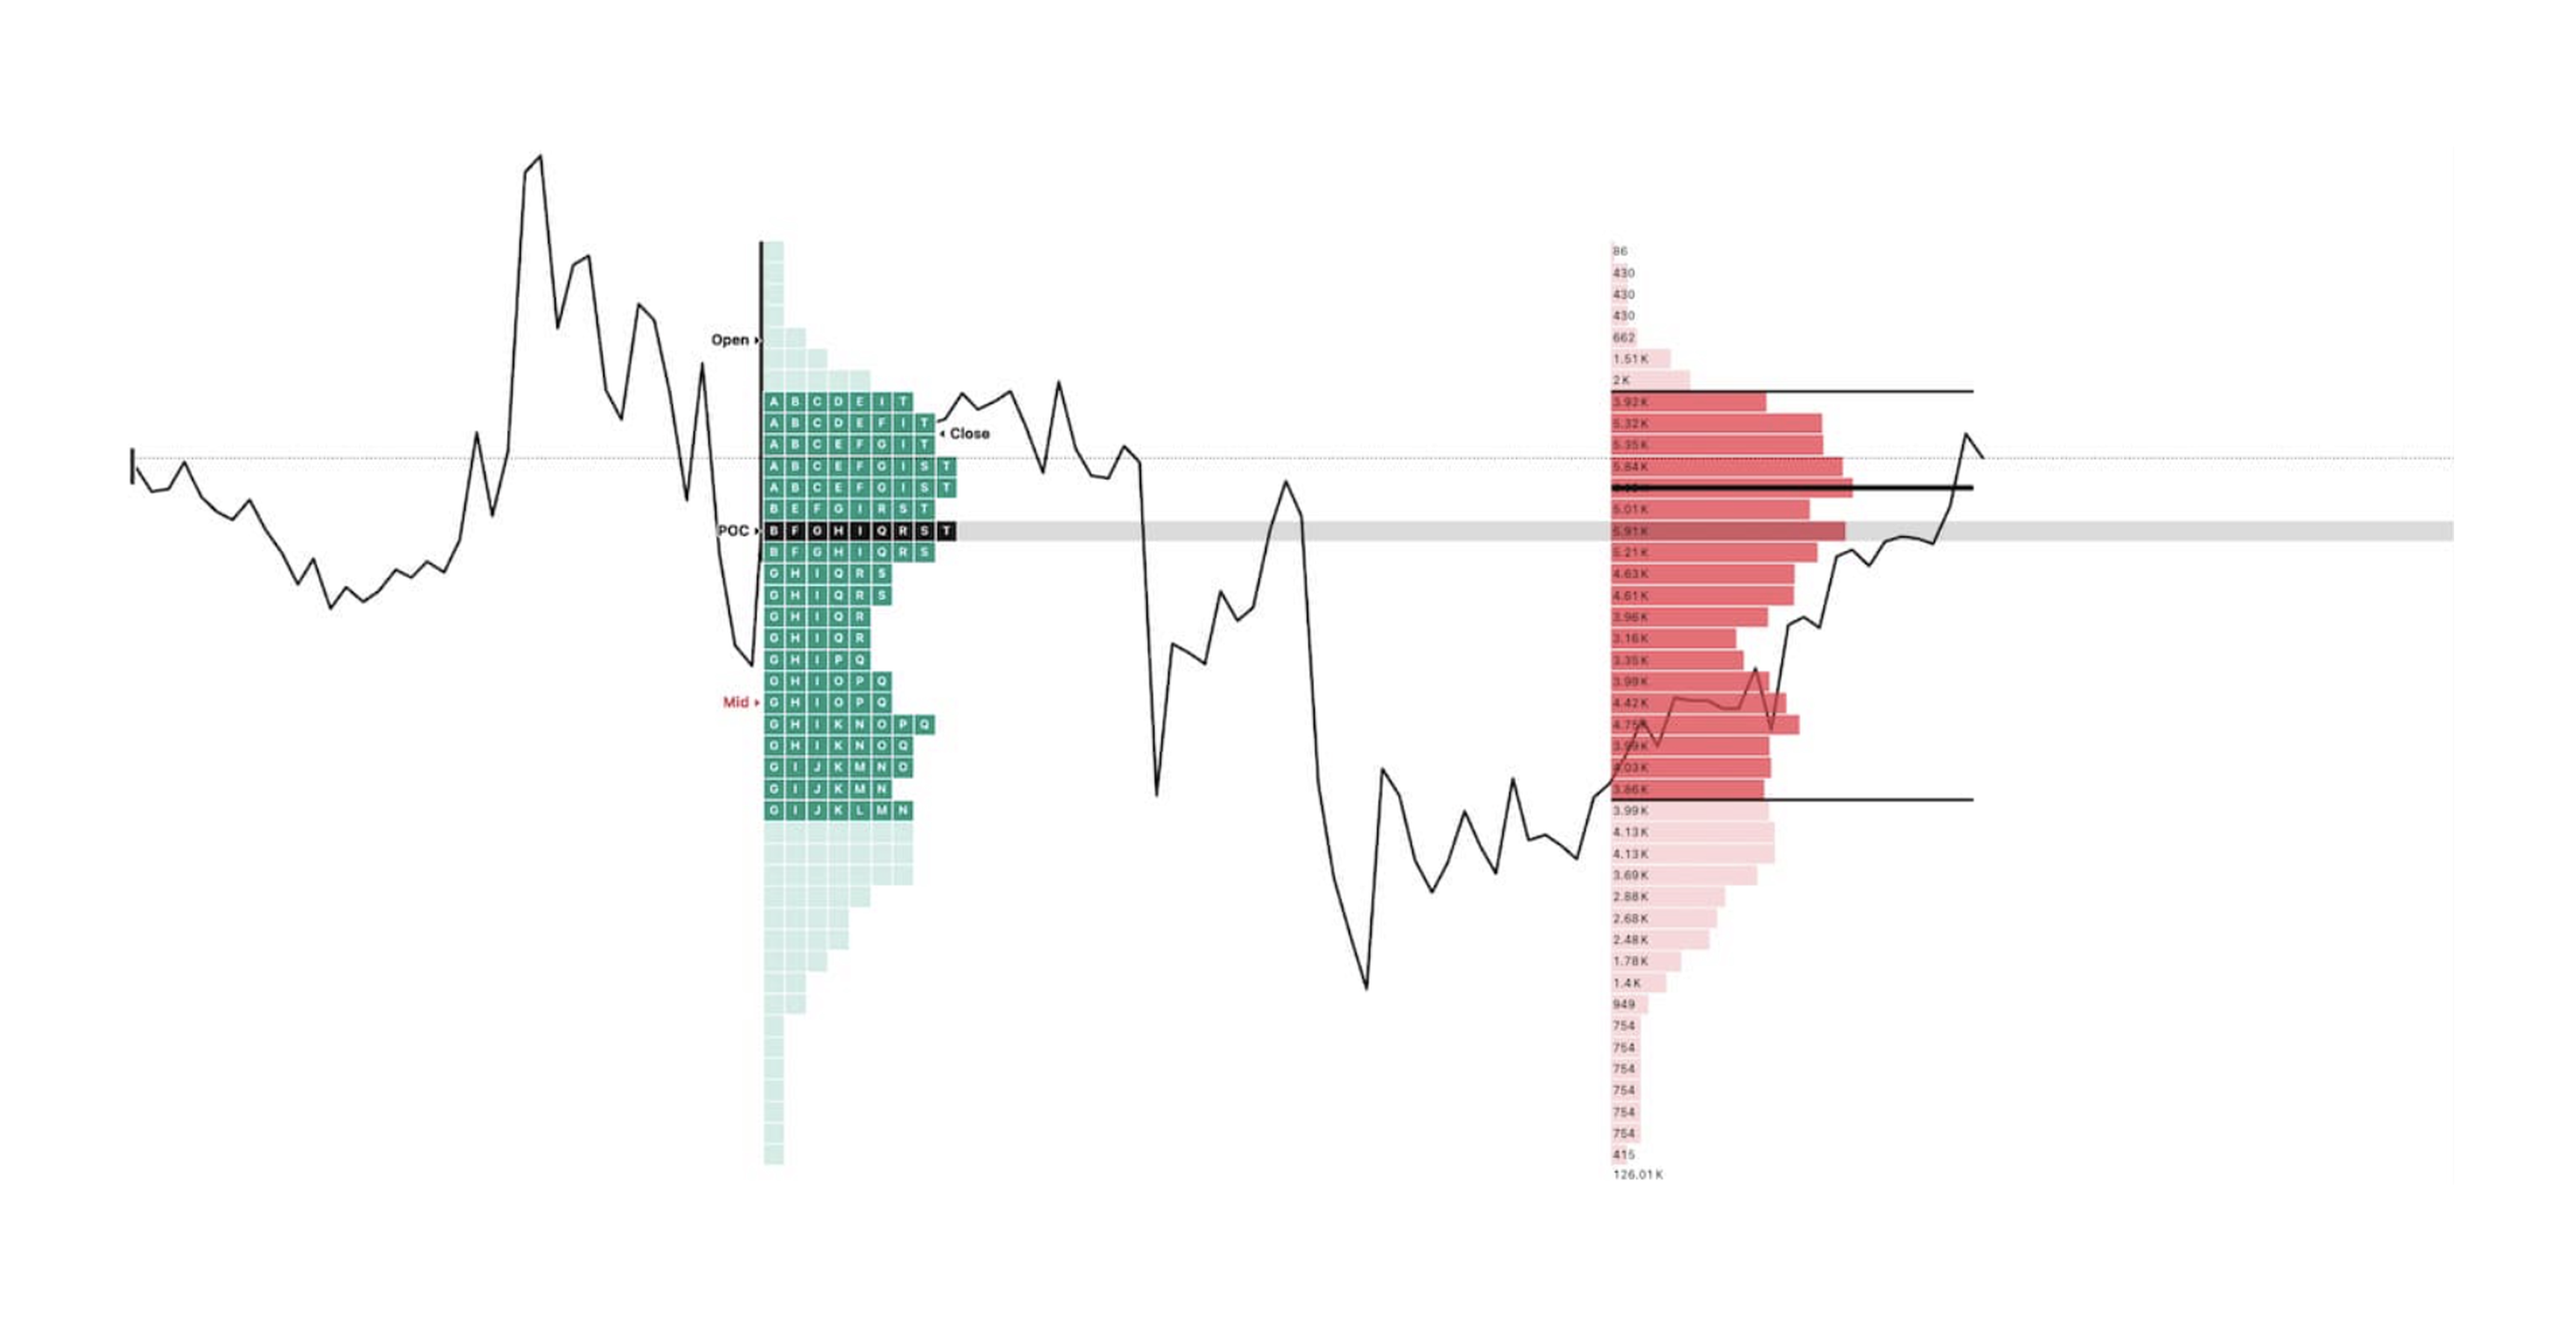
Markets do not move randomly—they auction. Every price tick, breakout, reversal, and consolidation is the direct outcome of an ongoing two-sided auction between buyers competing for lower prices and sellers competing for higher prices. Auction Market Theory (AMT) is the foundational framework that explains why prices move, rather than simply tracking where they move. Understanding AMT fundamentally changes how you analyze price charts.
This comprehensive guide serves as an institutional reference on Auction Market Theory—covering its history, core mechanics, structural components, market states, and real-time execution via Footprint order flow.
Auction Market Theory Overview
1. What Is Auction Market Theory?
Auction Market Theory is not a traditional lagging technical indicator system. Instead, it is a structural model for interpreting market mechanics. Its core principle is simple yet profound:
The sole purpose of any financial market is to facilitate trade. Price moves upward to discover sellers and downward to discover buyers. When supply and demand meet at an equilibrium price that maximizes volume, the market is at fair value. When supply and demand are mismatched, the market auctions directionally to discover a new price level accepted by both parties.
This mechanism governs all exchange-traded financial markets—equities, futures, crypto, forex, commodities, and fixed income.
The Two Primary Market States
- Balanced (Rotational) State: Price oscillates within an established range. Neither buyers nor sellers exercise dominant control, and the market is actively building value.
- Trading Strategy: Mean-reversion—buy near range support (VAL) and sell near range resistance (VAH).
- Imbalanced (Trending) State: One side of the market aggressively overwhelms the other. Value areas migrate directionally from session to session.
- Trading Strategy: Trend-following—join the directional auction and avoid fading momentum.
Accurately identifying whether a market is balanced or imbalanced dictates every strategic execution in AMT.
2. History & Evolution of AMT
Auction Market Theory was pioneered by J. Peter Steidlmayer, a floor trader at the Chicago Board of Trade (CBOT). In the 1960s and 1970s, Steidlmayer recognized that raw price alone failed to indicate whether a market accepted a price level—whereas time spent at price revealed institutional acceptance.
Historical Milestones
- 1984–1985: Steidlmayer, in collaboration with Kevin Koy, introduced Market Profile to the CBOT. This visual tool organized trading activity into 30-minute brackets designated by letters (Time Price Opportunities, or TPOs), generating a statistical bell-curve distribution of price over time.
- 1986: Steidlmayer published Markets & Market Logic, establishing the foundational literature of AMT.
- 1993: James Dalton, Eric Jones, and Robert Dalton published Mind Over Markets, translating auction principles into practical trading methodologies.
- 2000s: The shift to electronic trading provided precise volume data. Volume Profile evolved as the modern standard, replacing time-at-price brackets with exact contract volume traded at each price node.
- 2007: James Dalton published Markets in Profile, adapting auction concepts to modern electronic equity and futures execution.
- 2010s–Present: Institutional and retail adoption expanded globally as platforms integrated Volume Profile and Footprint charts into standard trading suites.
3. Core Structural Components
Point of Control (POC)
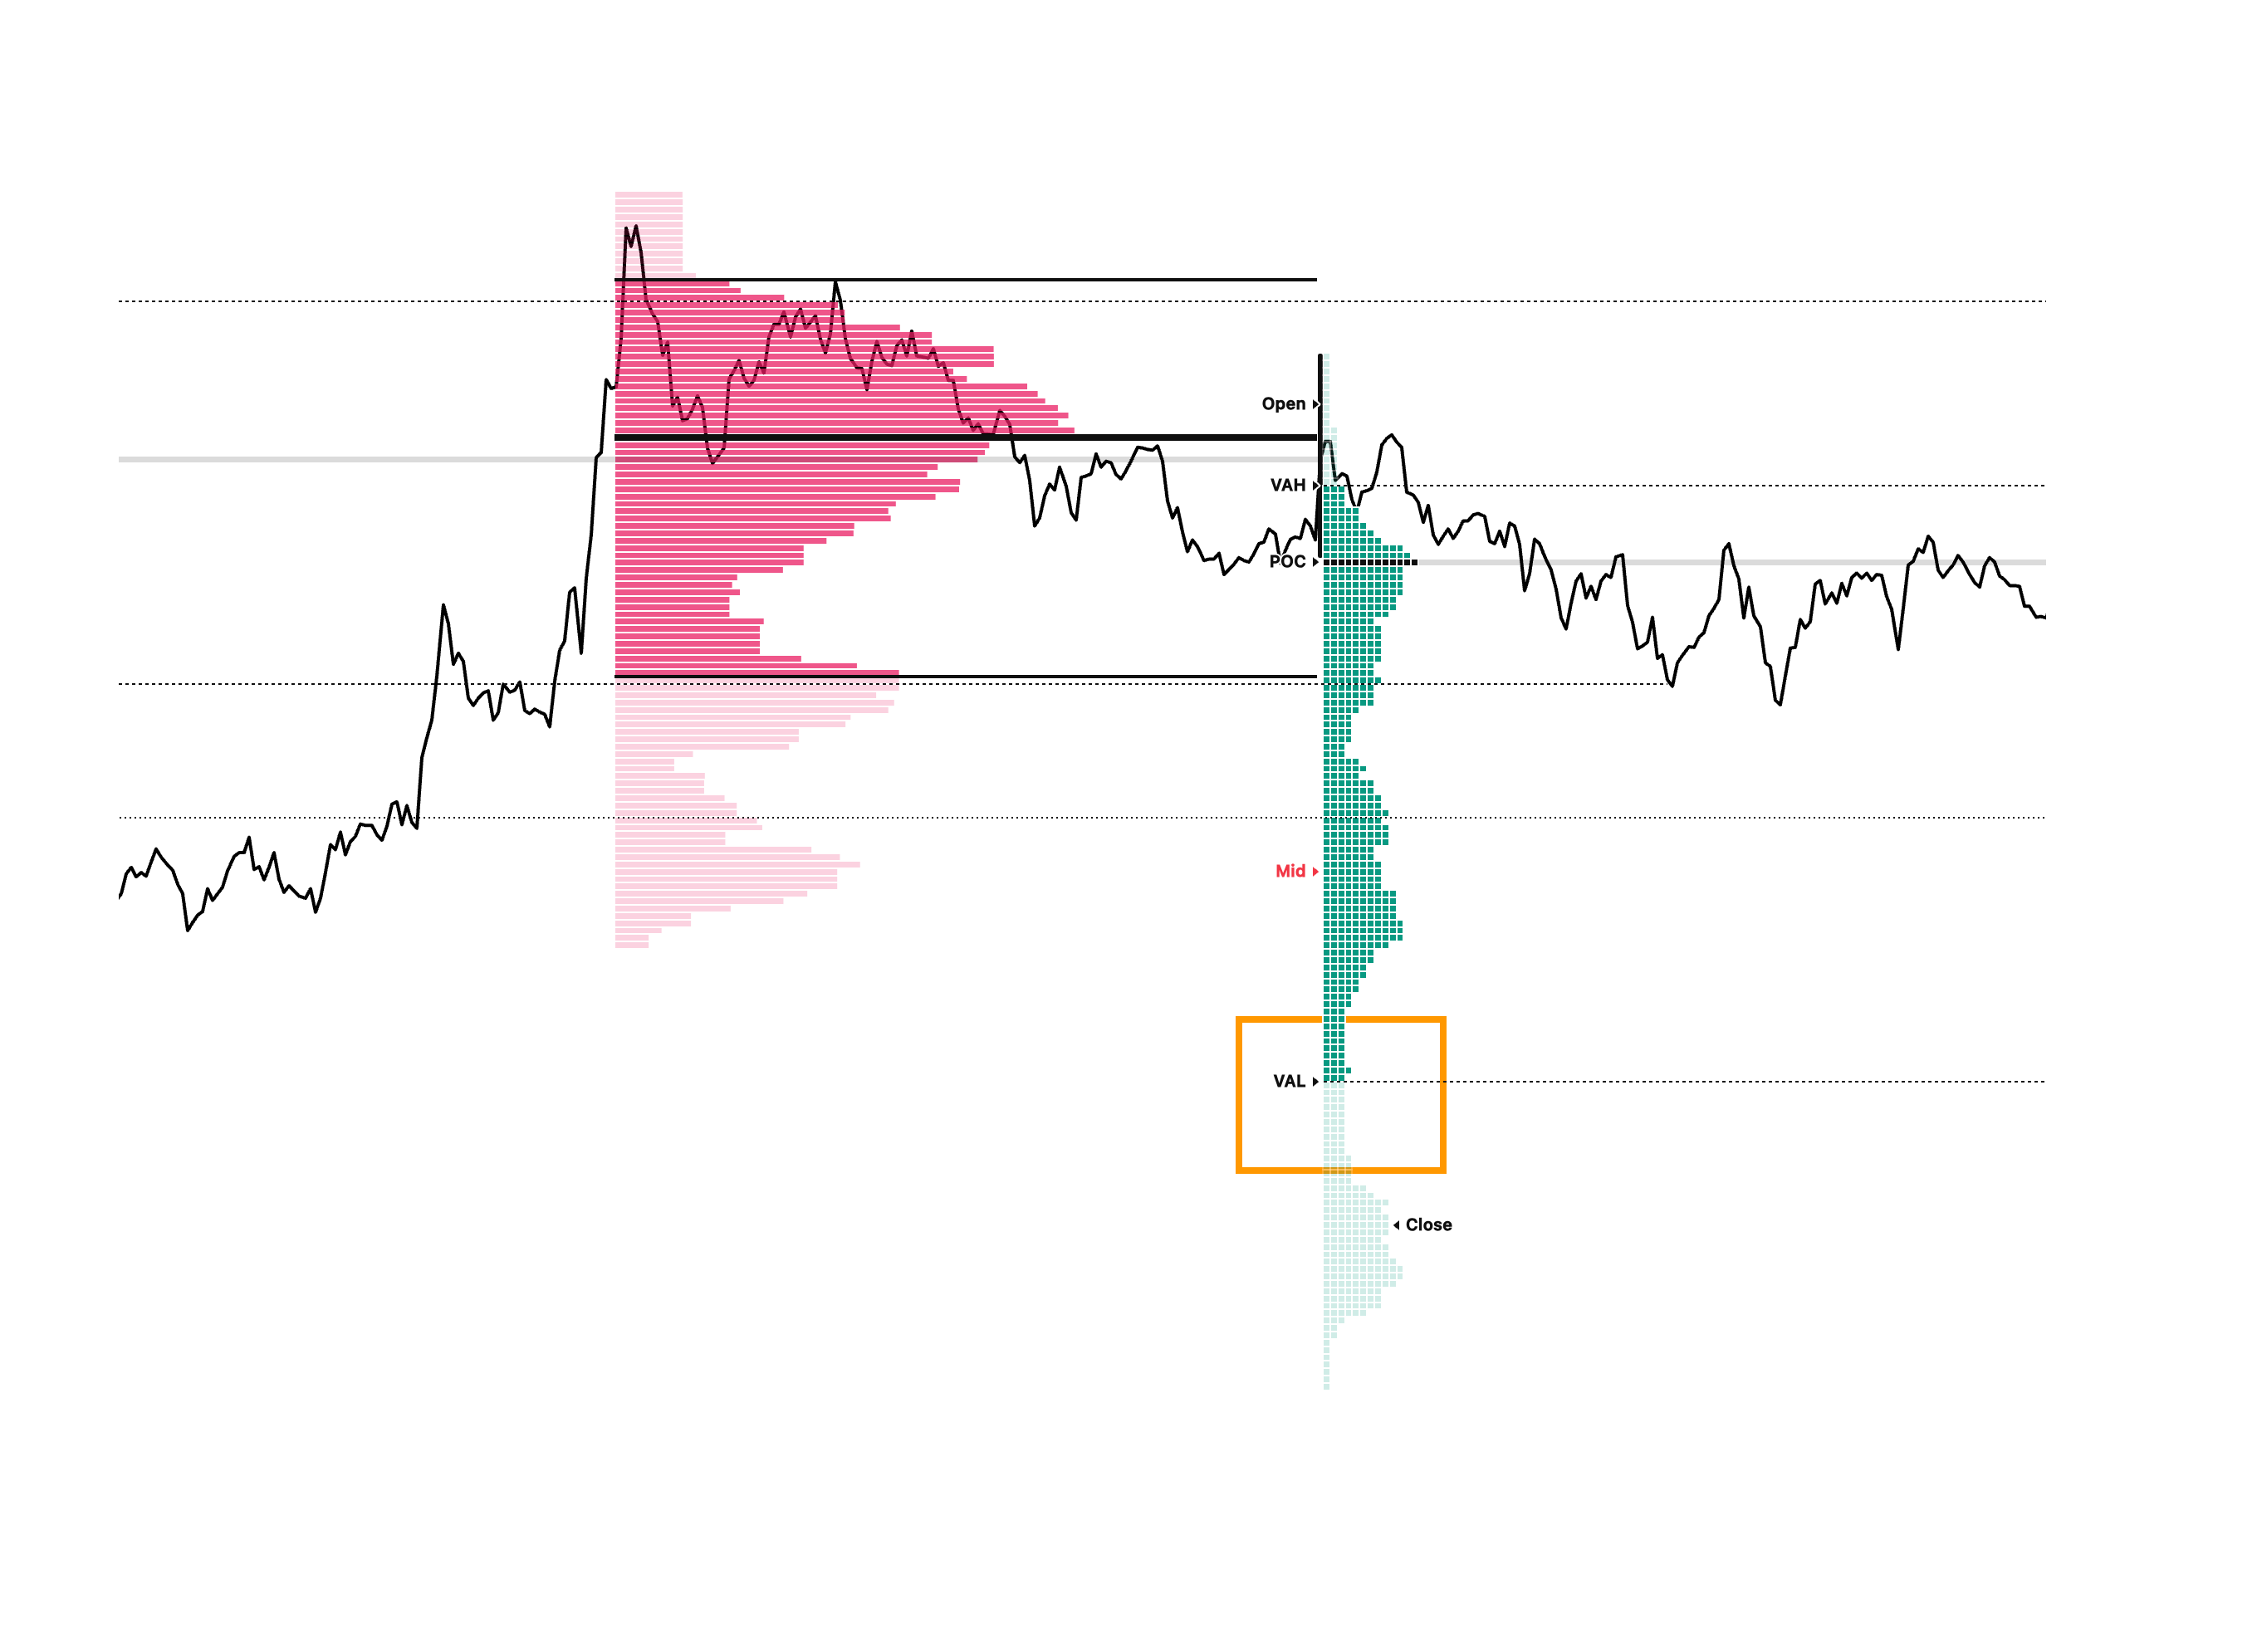
The Point of Control (POC) represents the exact price level with the highest trading activity (volume or TPO count) during a given profile period. It marks the market's consensus estimate of fair value.
Point of Control (POC)
- Rising POC across sessions: Indicates bullish value migration, where buyers systematically accept higher prices.
- Falling POC across sessions: Indicates bearish value migration, controlled by persistent selling pressure.
- Price relative to POC: Trading above POC reflects short-term buyer control; trading below POC reflects short-term seller control.
- Developing POC (dPOC): Tracks real-time fair value migration intraday. Watching whether dPOC shifts higher or lower provides crucial directional context.
Value Area (VA)
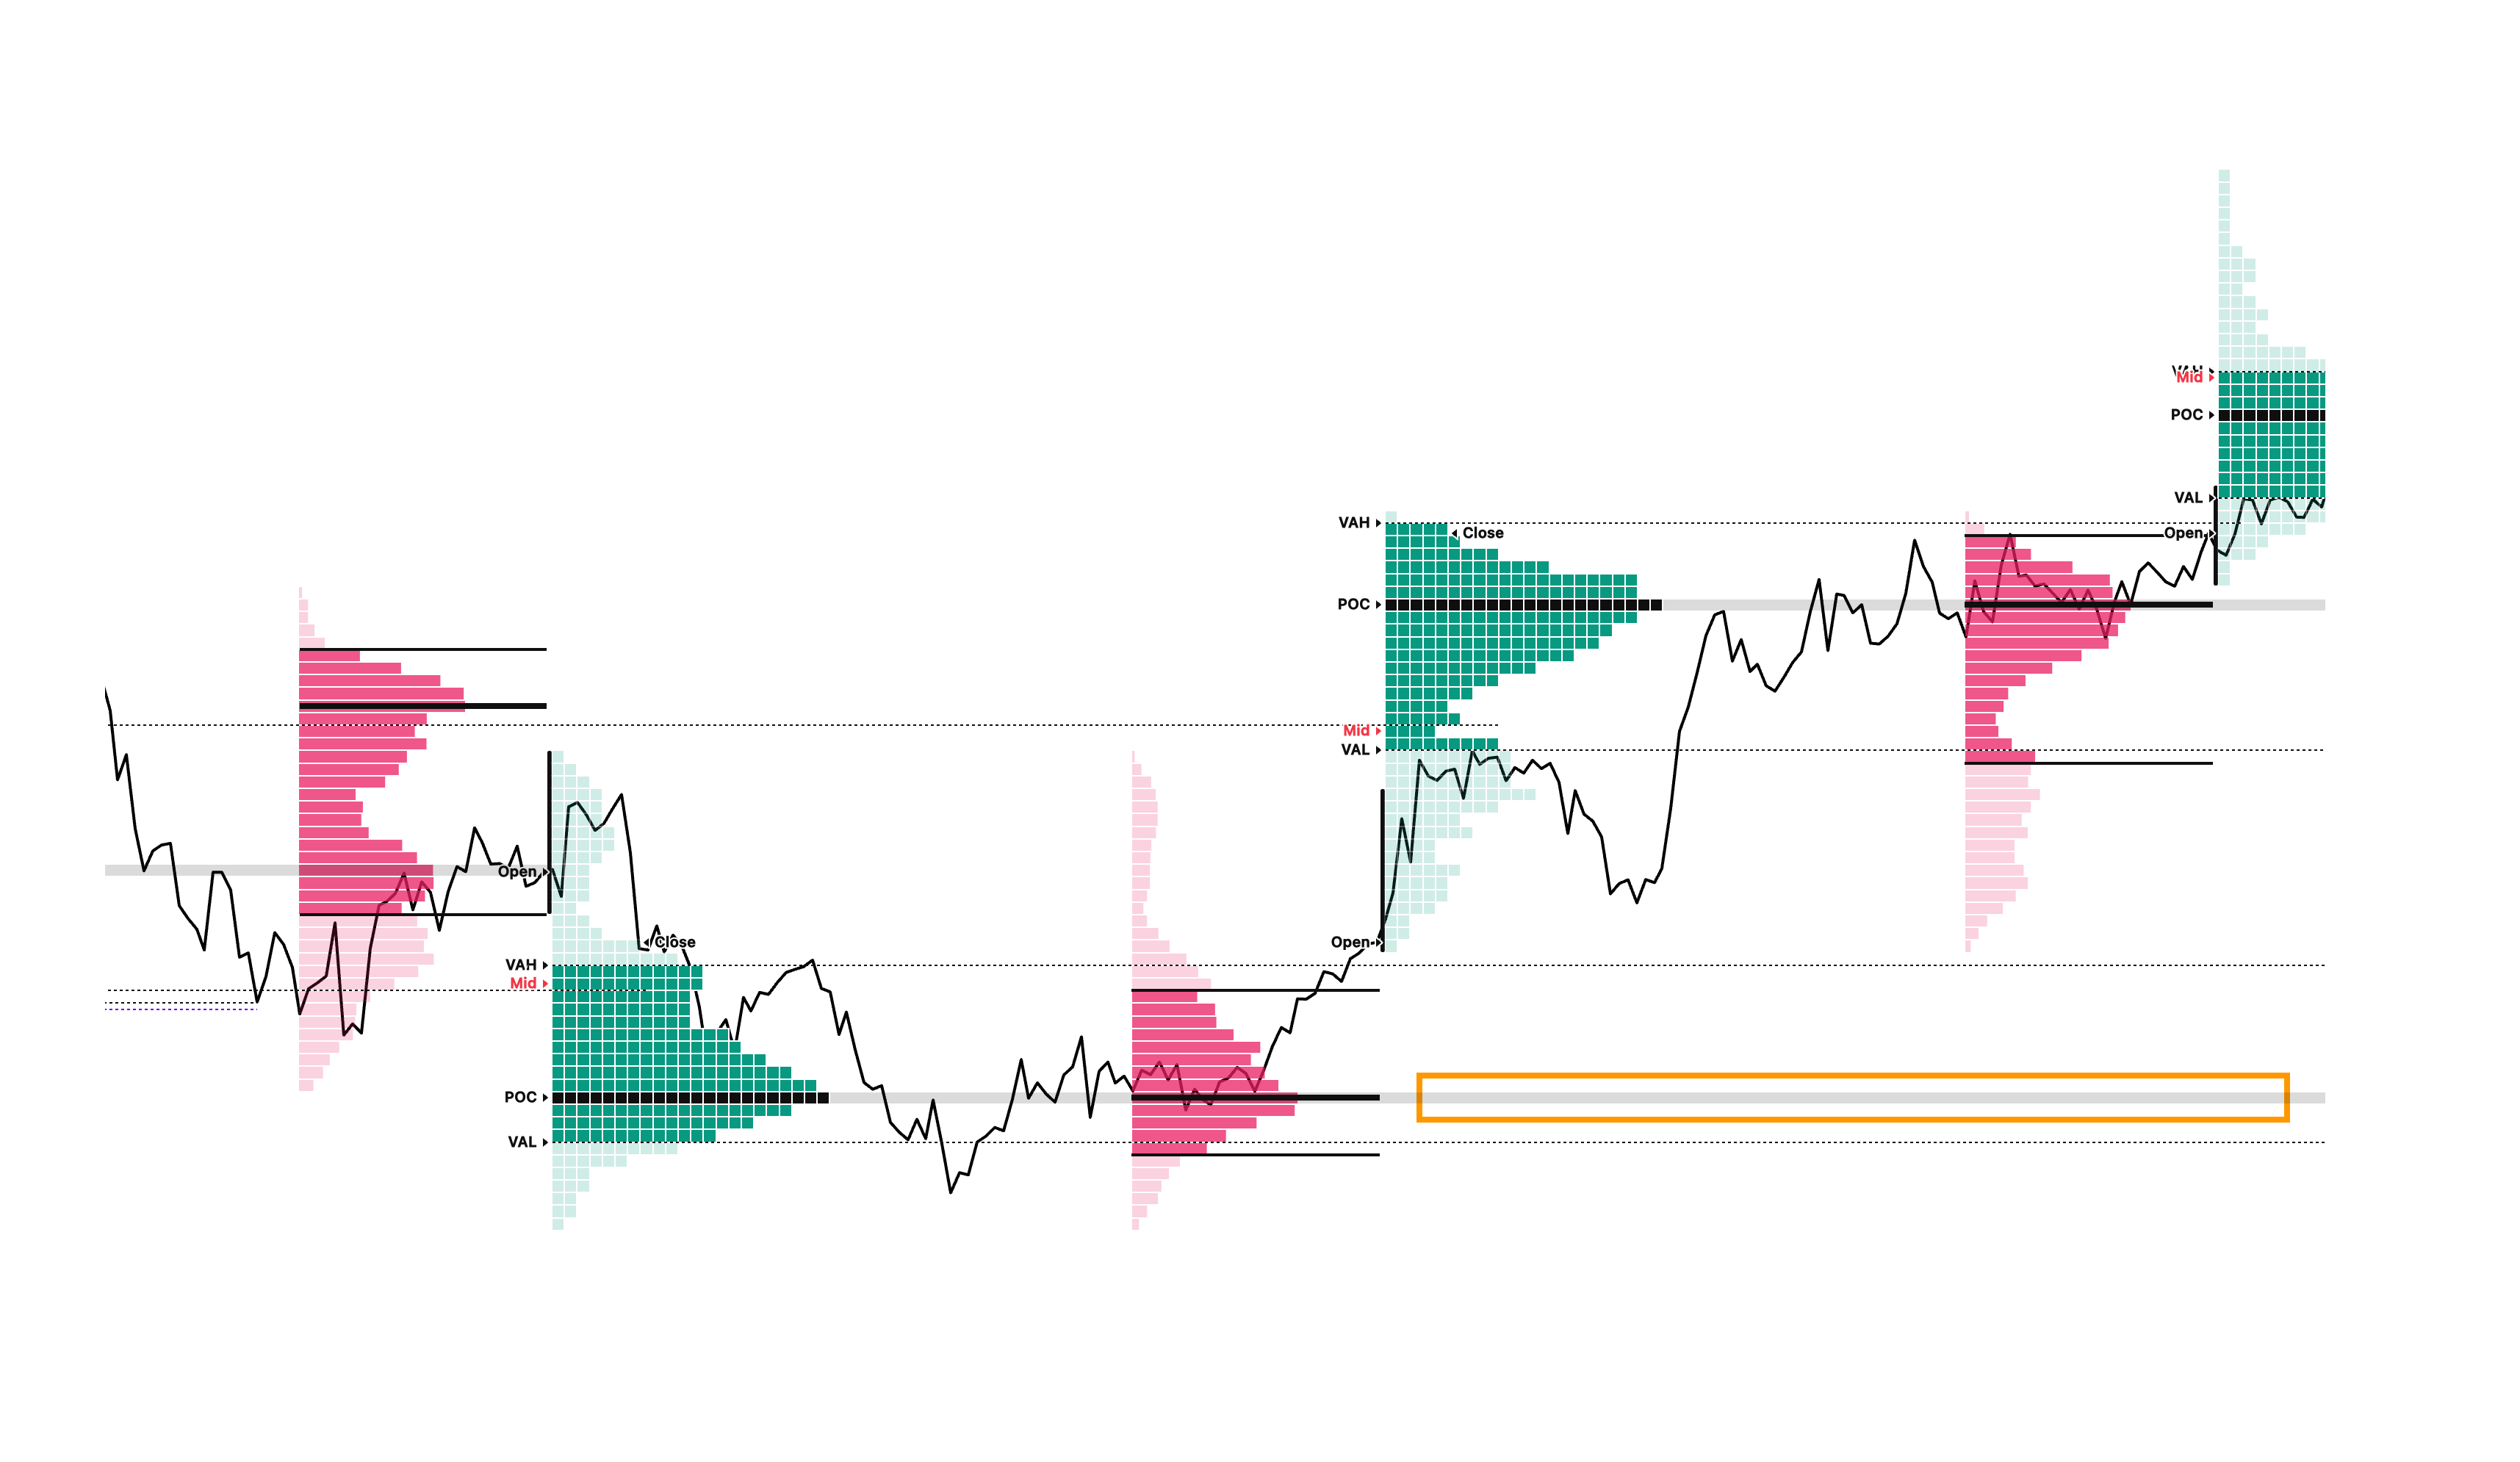
The Value Area (VA) encompasses the price range containing 70% of total trading activity during a session. This is derived from standard deviation statistics, where ~68.2% of data falls within one standard deviation of the mean. Inside the VA represents fair pricing, while trading outside the VA indicates a probe for market acceptance or rejection.
Value Area (VA)
- The 80% Rule: When price opens or moves outside the prior day's Value Area and re-enters it with acceptance, it traverses the entire Value Area to the opposite boundary approximately 80% of the time.
Value Area High (VAH)
The upper boundary of the Value Area.
Value Area High (VAH)
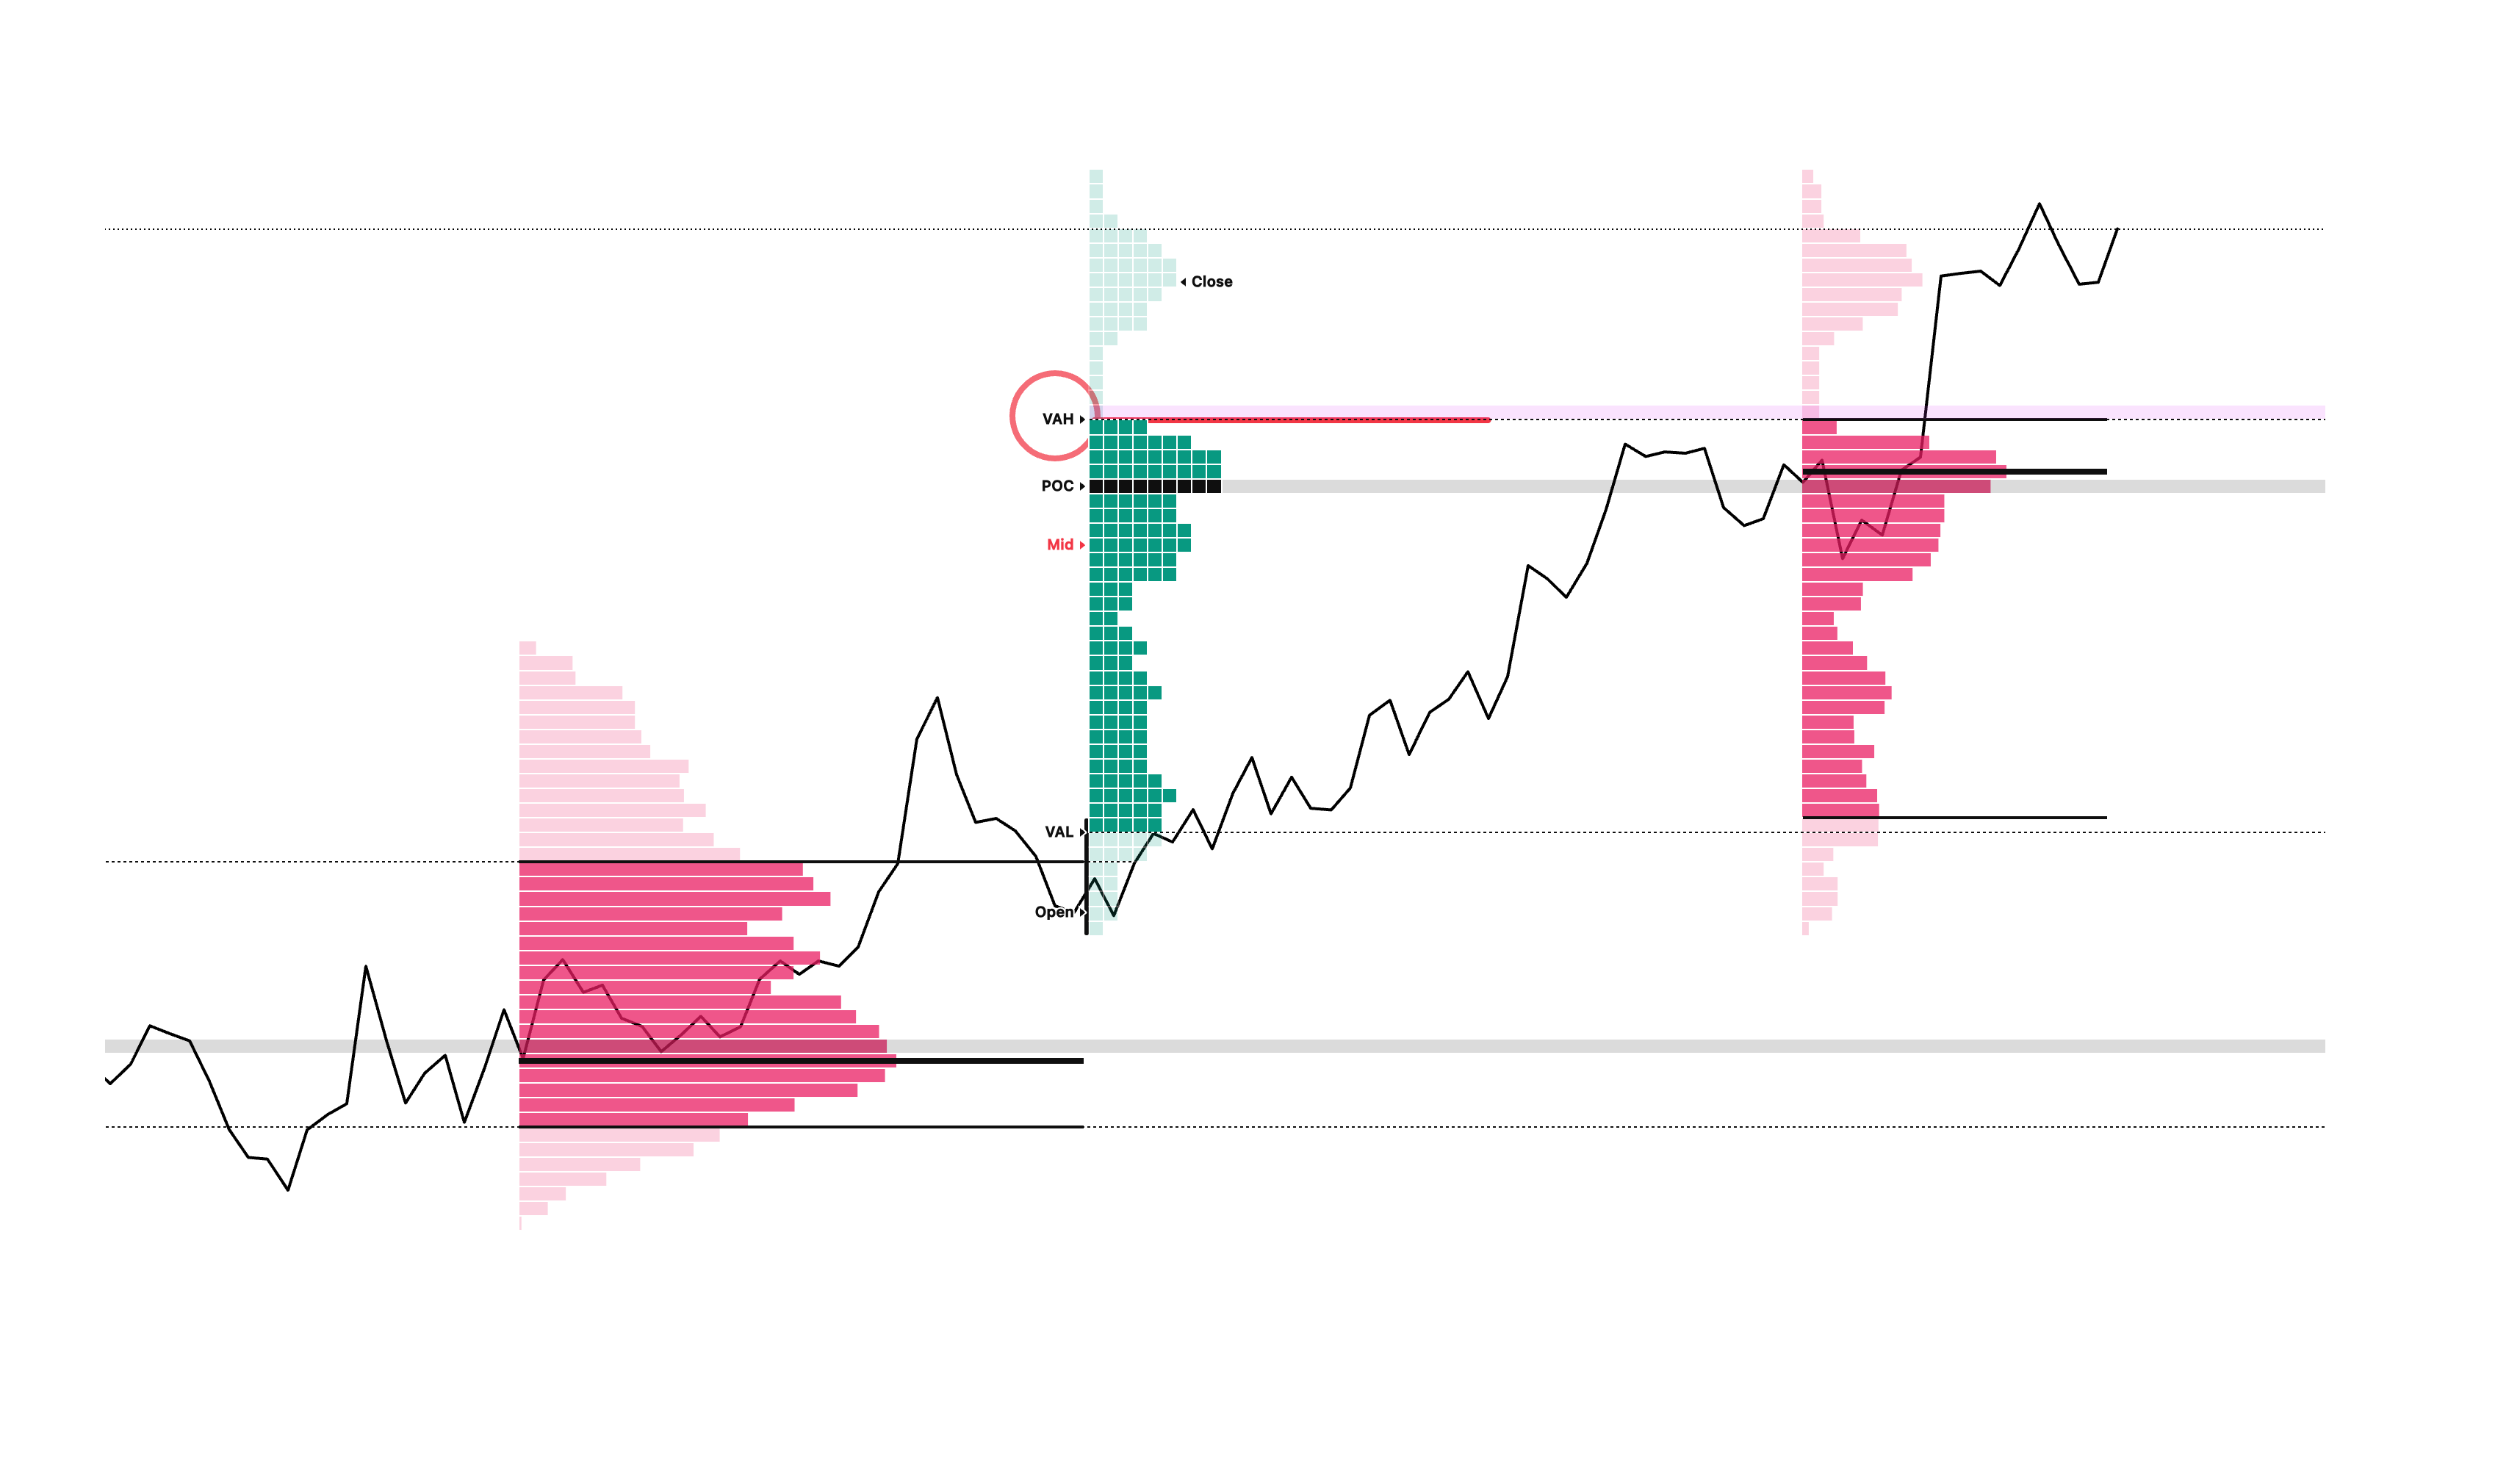
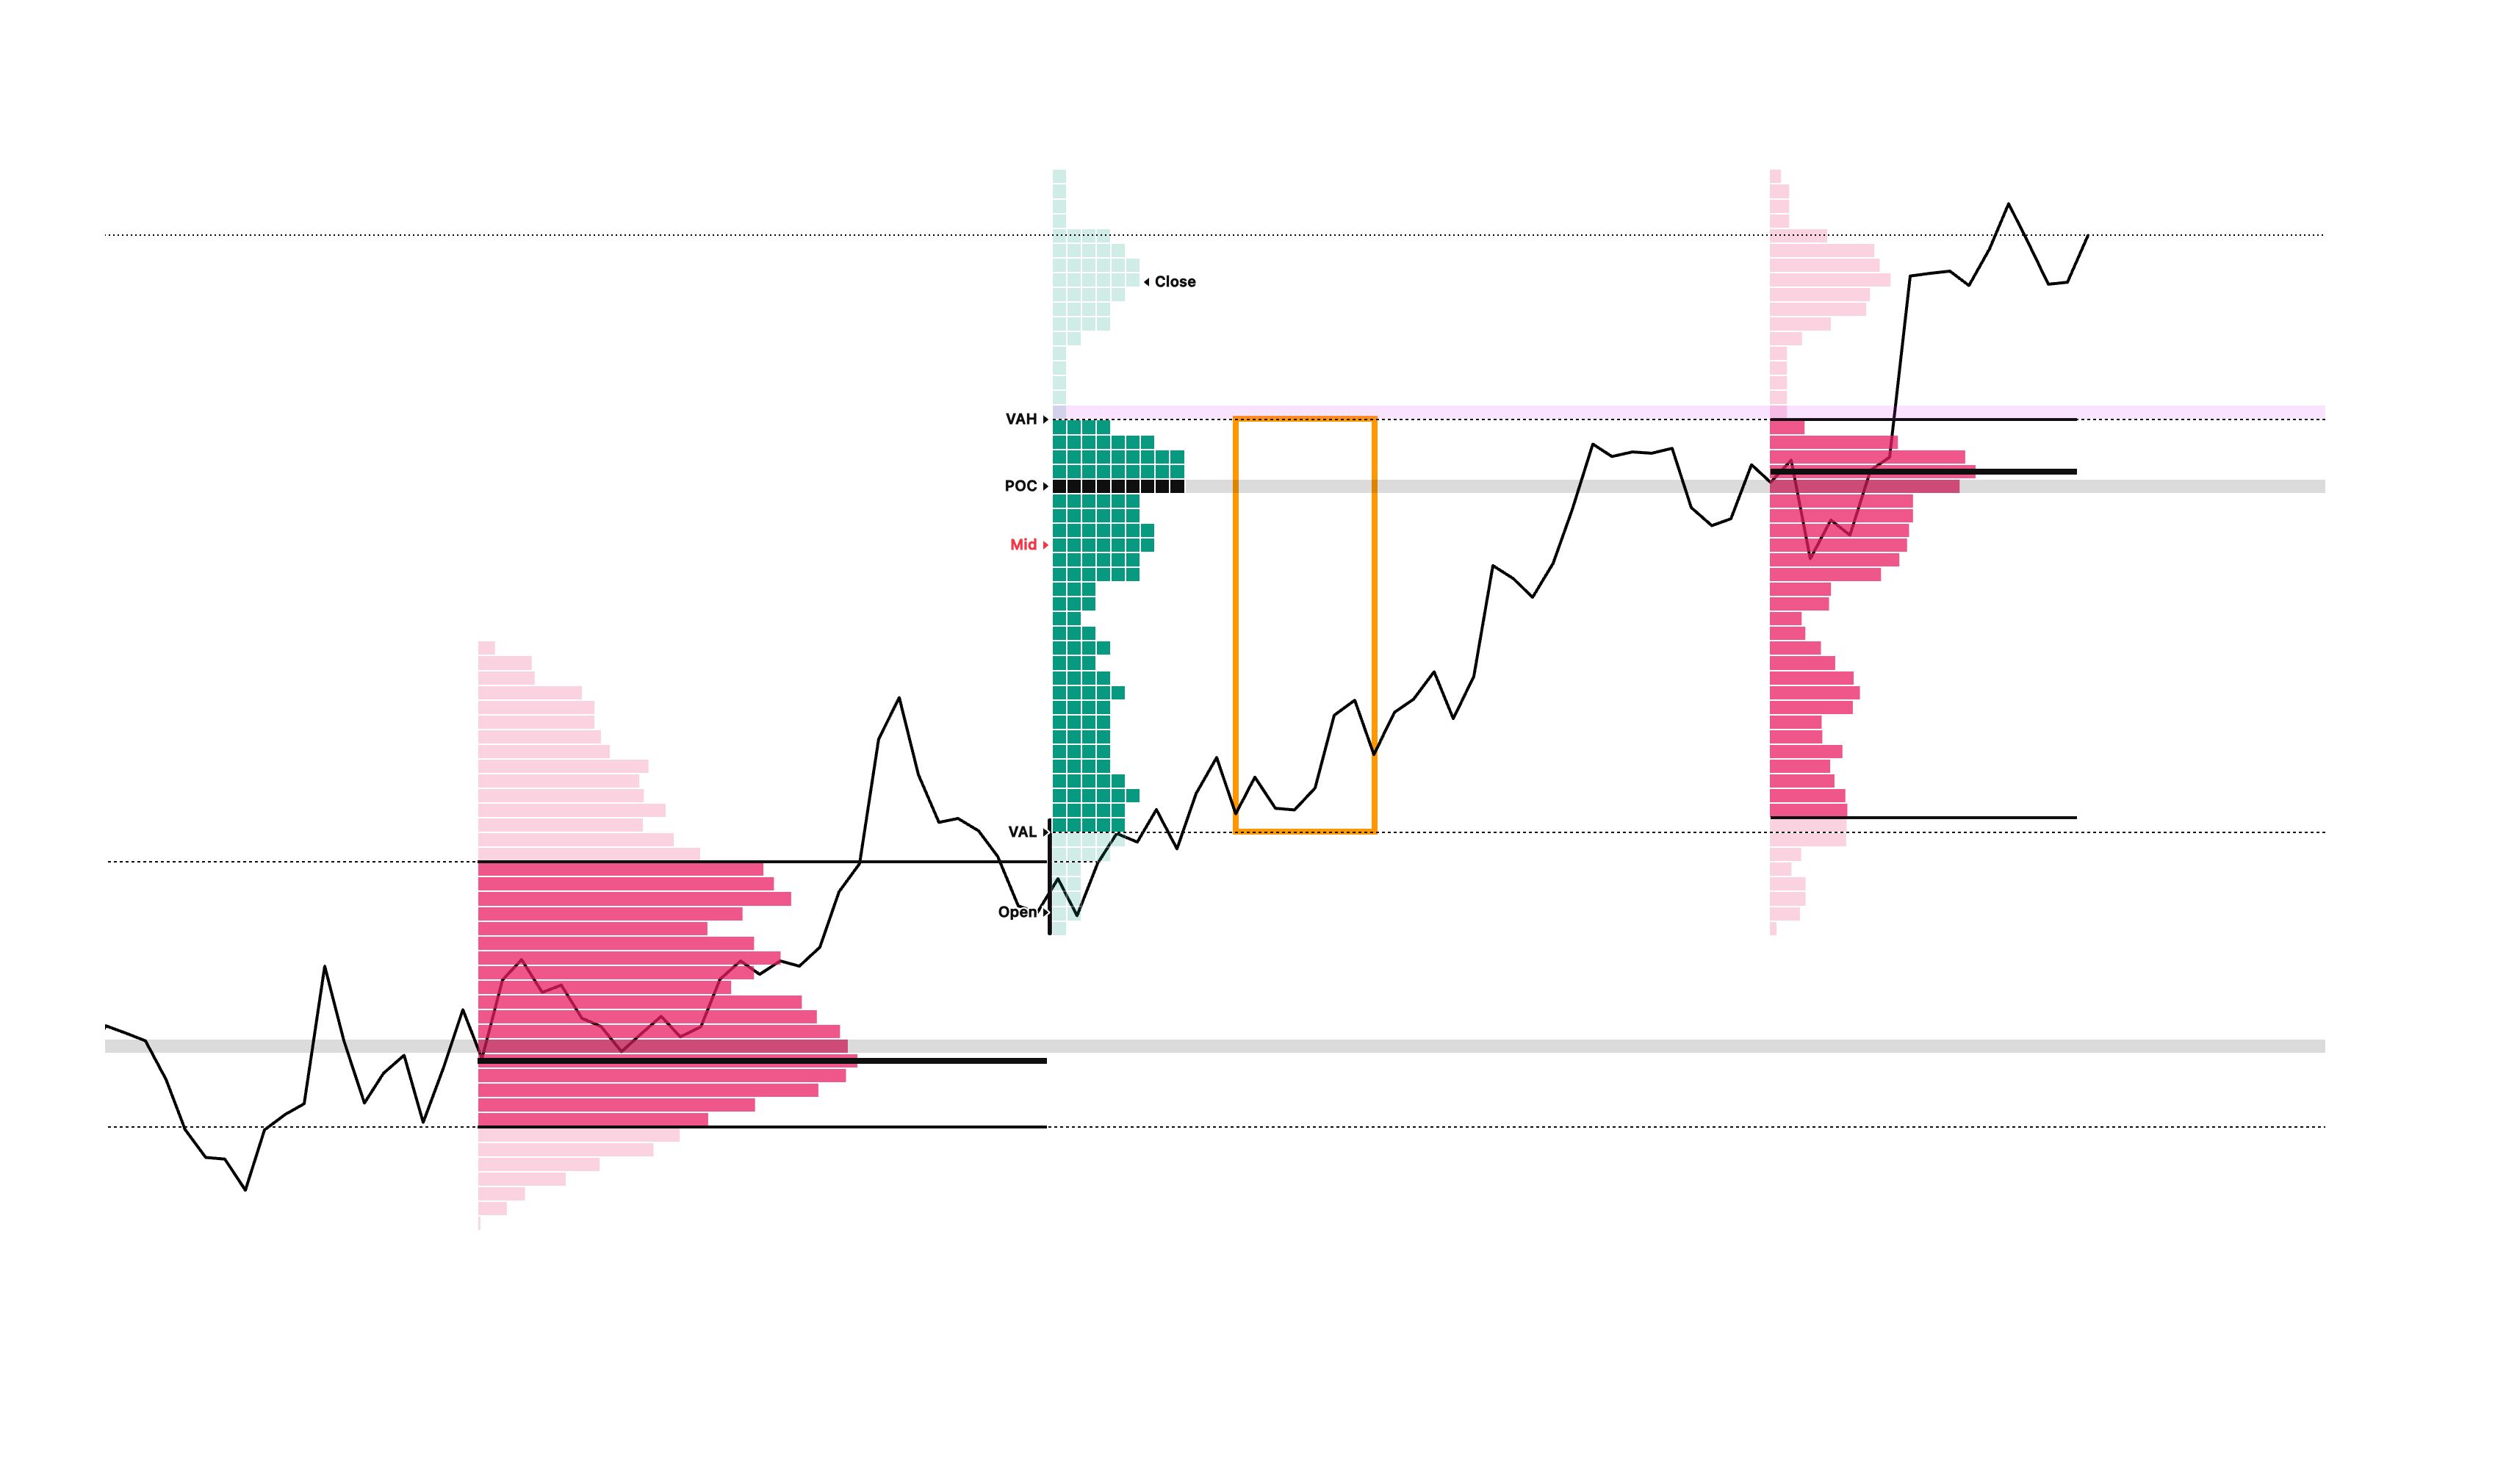
Approaching VAH from below typically encounters resistance from sellers who previously accepted value at this upper limit. A firm close above VAH signals bullish acceptance, whereas a sharp rejection back inside the range indicates a failed auction probe.
Value Area Low (VAL)
The lower boundary of the Value Area.
Value Area Low (VAL)
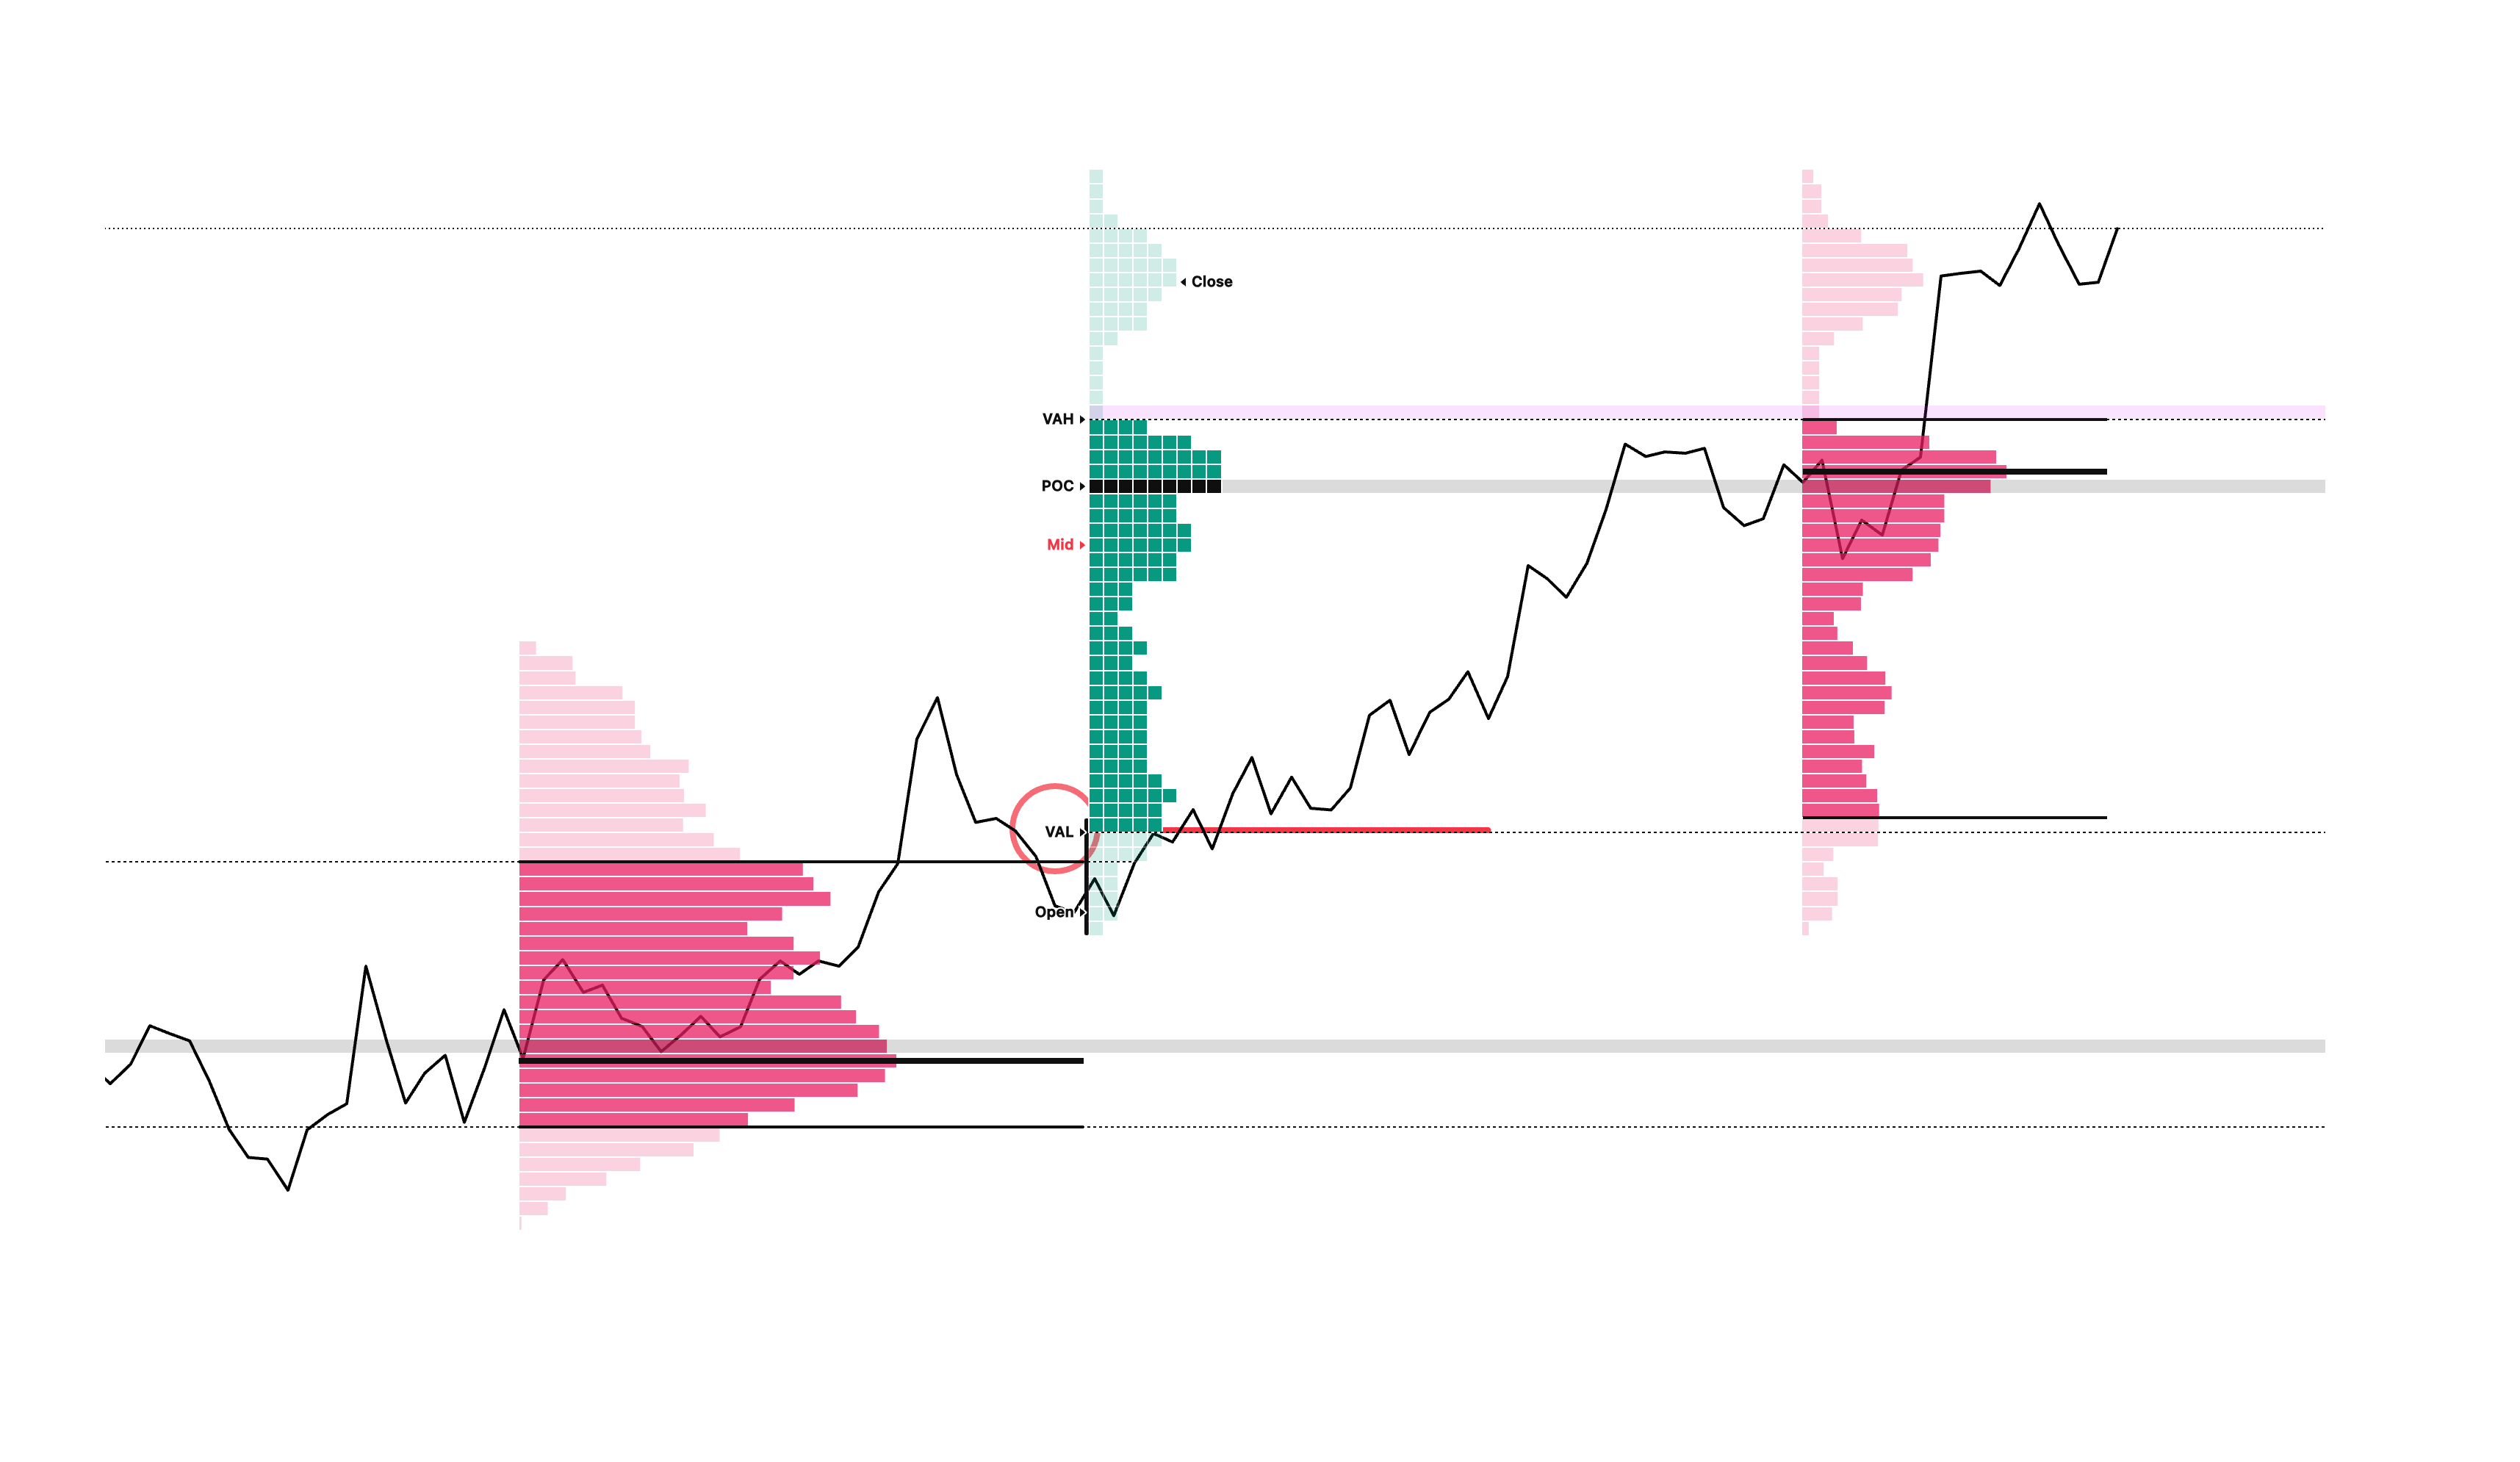
Approaching VAL from above acts as structural support. A firm close below VAL indicates bearish acceptance of lower prices, while a quick rejection at VAL signals responsive buying.
Initial Balance (IB)
The price range established during the first hour of trading (brackets A and B in Market Profile). The IB serves as the session baseline reference.
Initial Balance (IB)
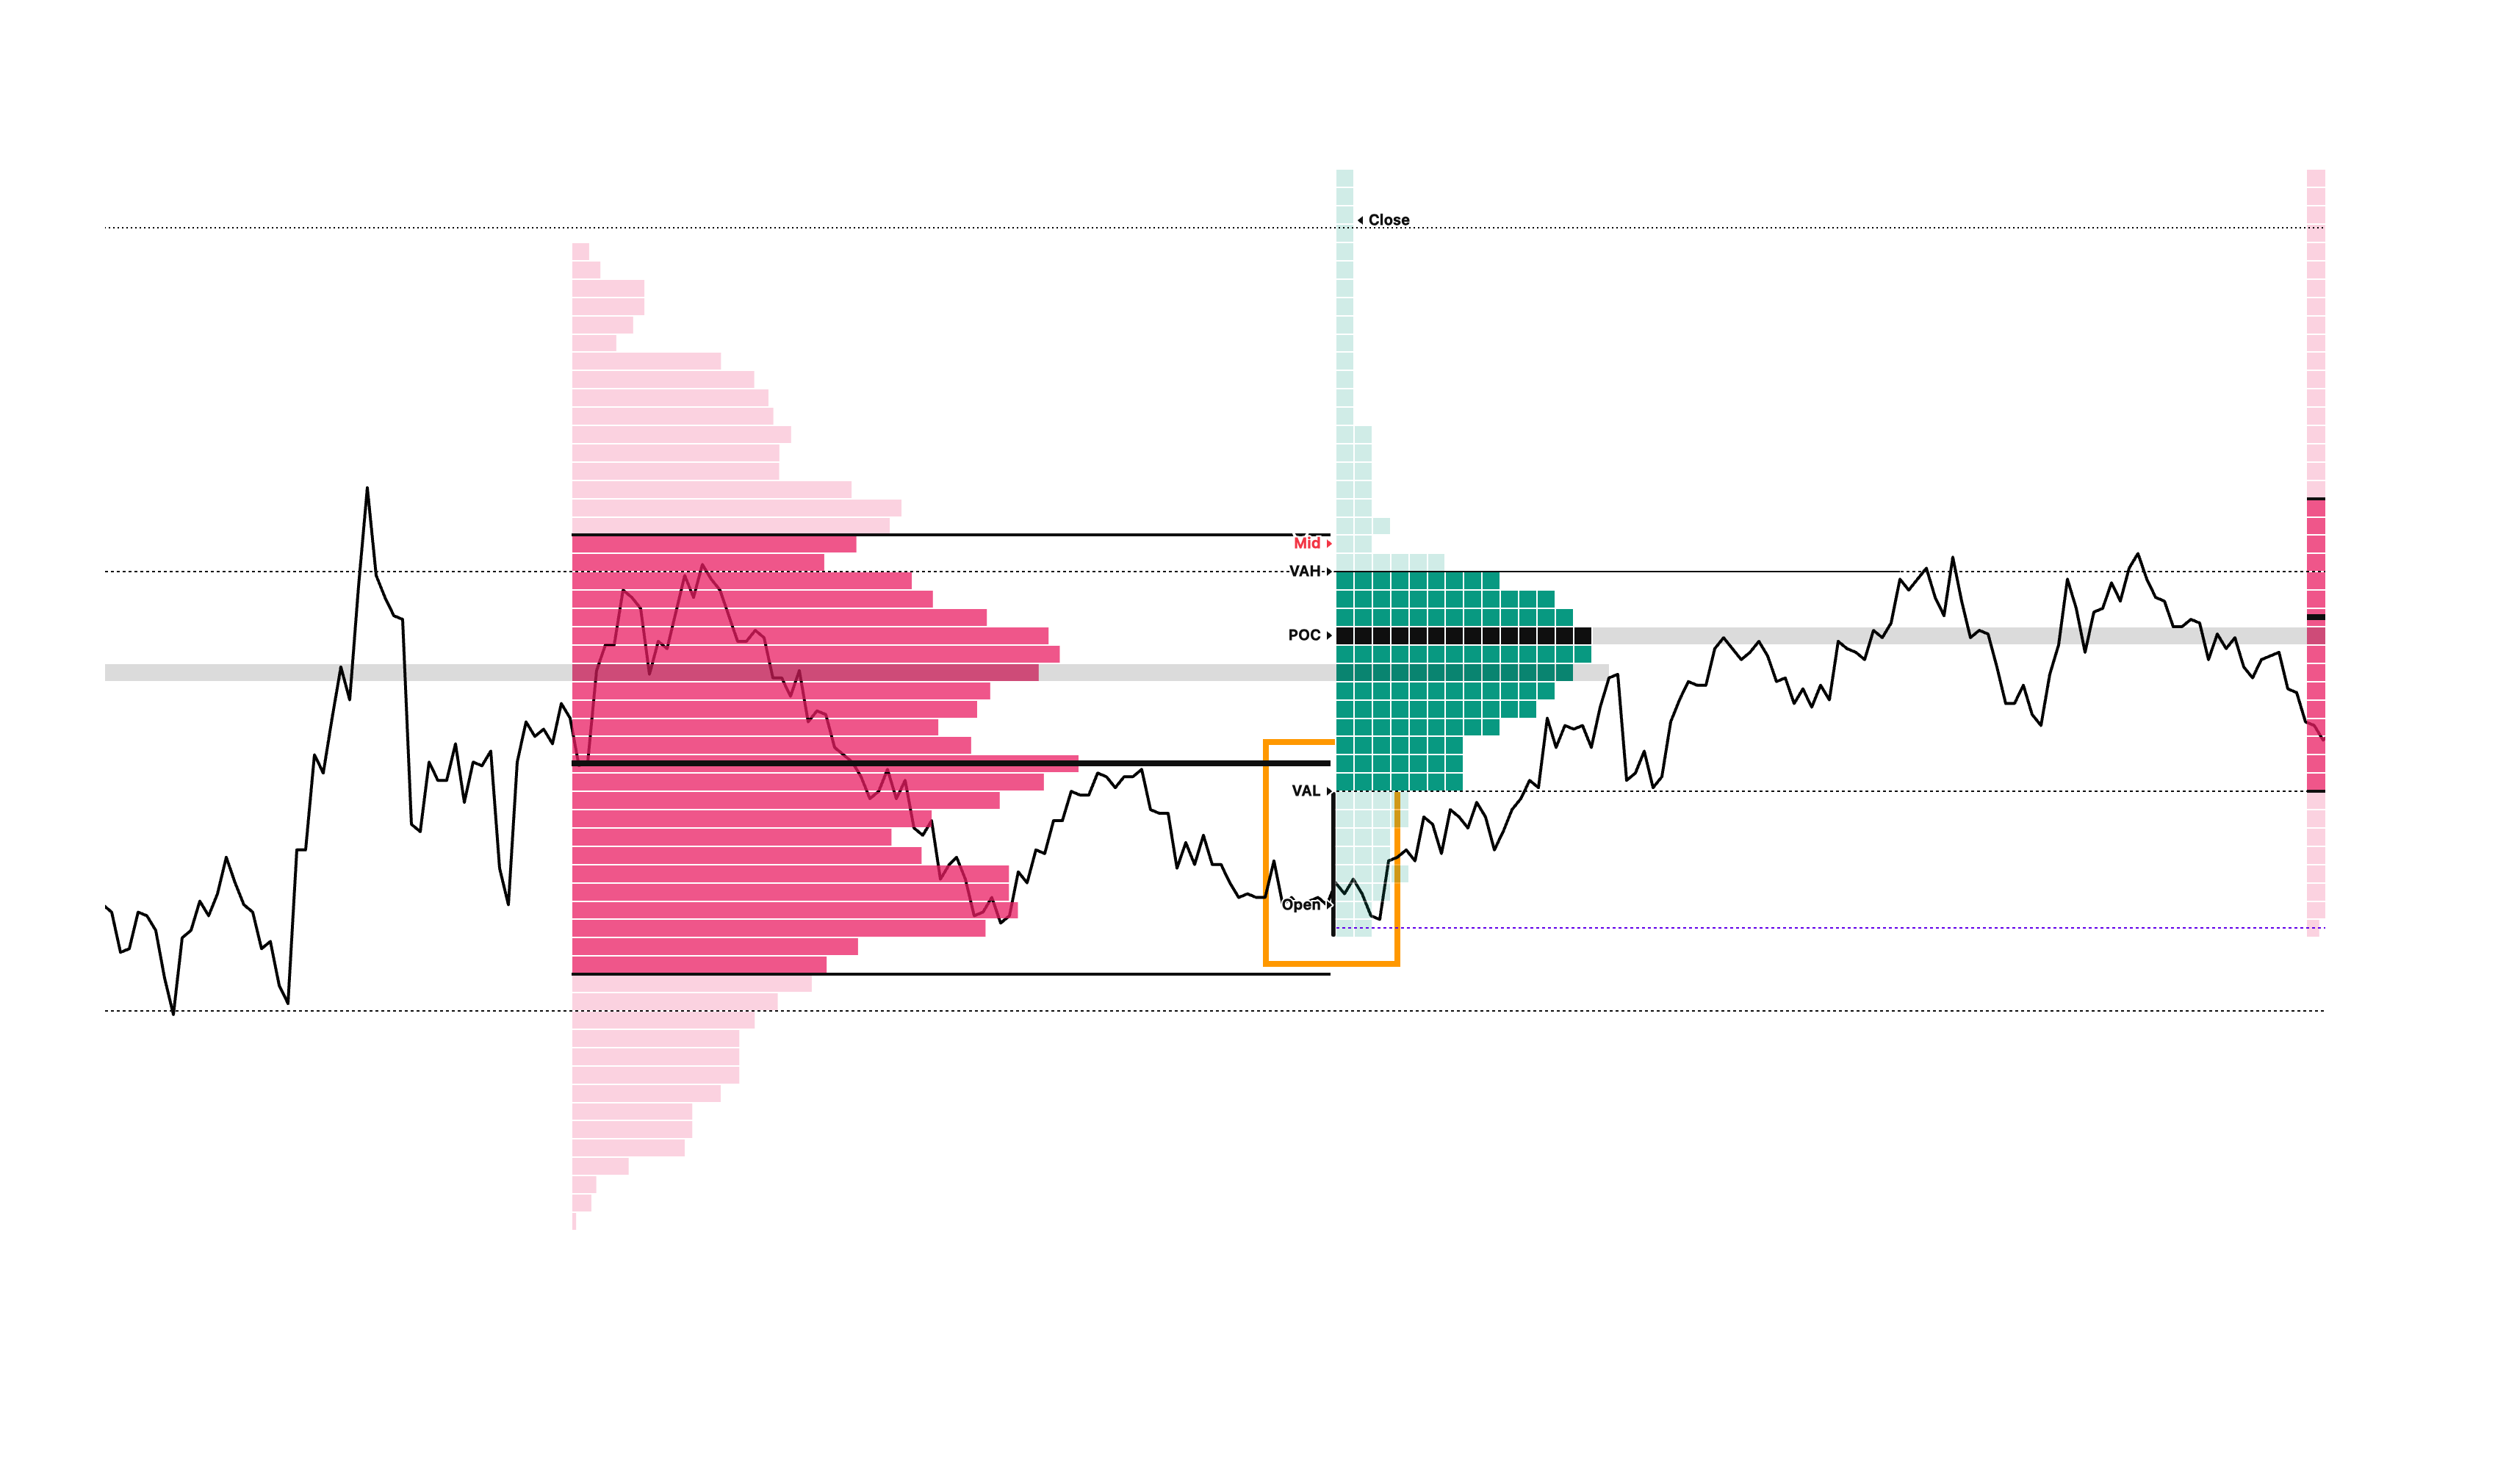
- Wide IB: Signals early high-conviction participation. Price is likely to remain inside the IB range (Normal Day). Strategy: fade range extremes.
- Narrow IB: Indicates low initial conviction. High statistical probability of significant directional range extension (Trend Day potential).
- One-Directional IB Extension: Confirms trend day development; follow the breakout direction.
- Two-Directional IB Extension: Indicates rotational neutral day dynamics; fade both extremes.
Time Price Opportunities (TPOs)
The core visual block of Market Profile, where each letter represents a 30-minute period at a given price level. Heavy TPO accumulation indicates acceptance; sparse TPO density indicates rapid price transit.
Time Price Opportunities (TPOs)
Market Profile Formations
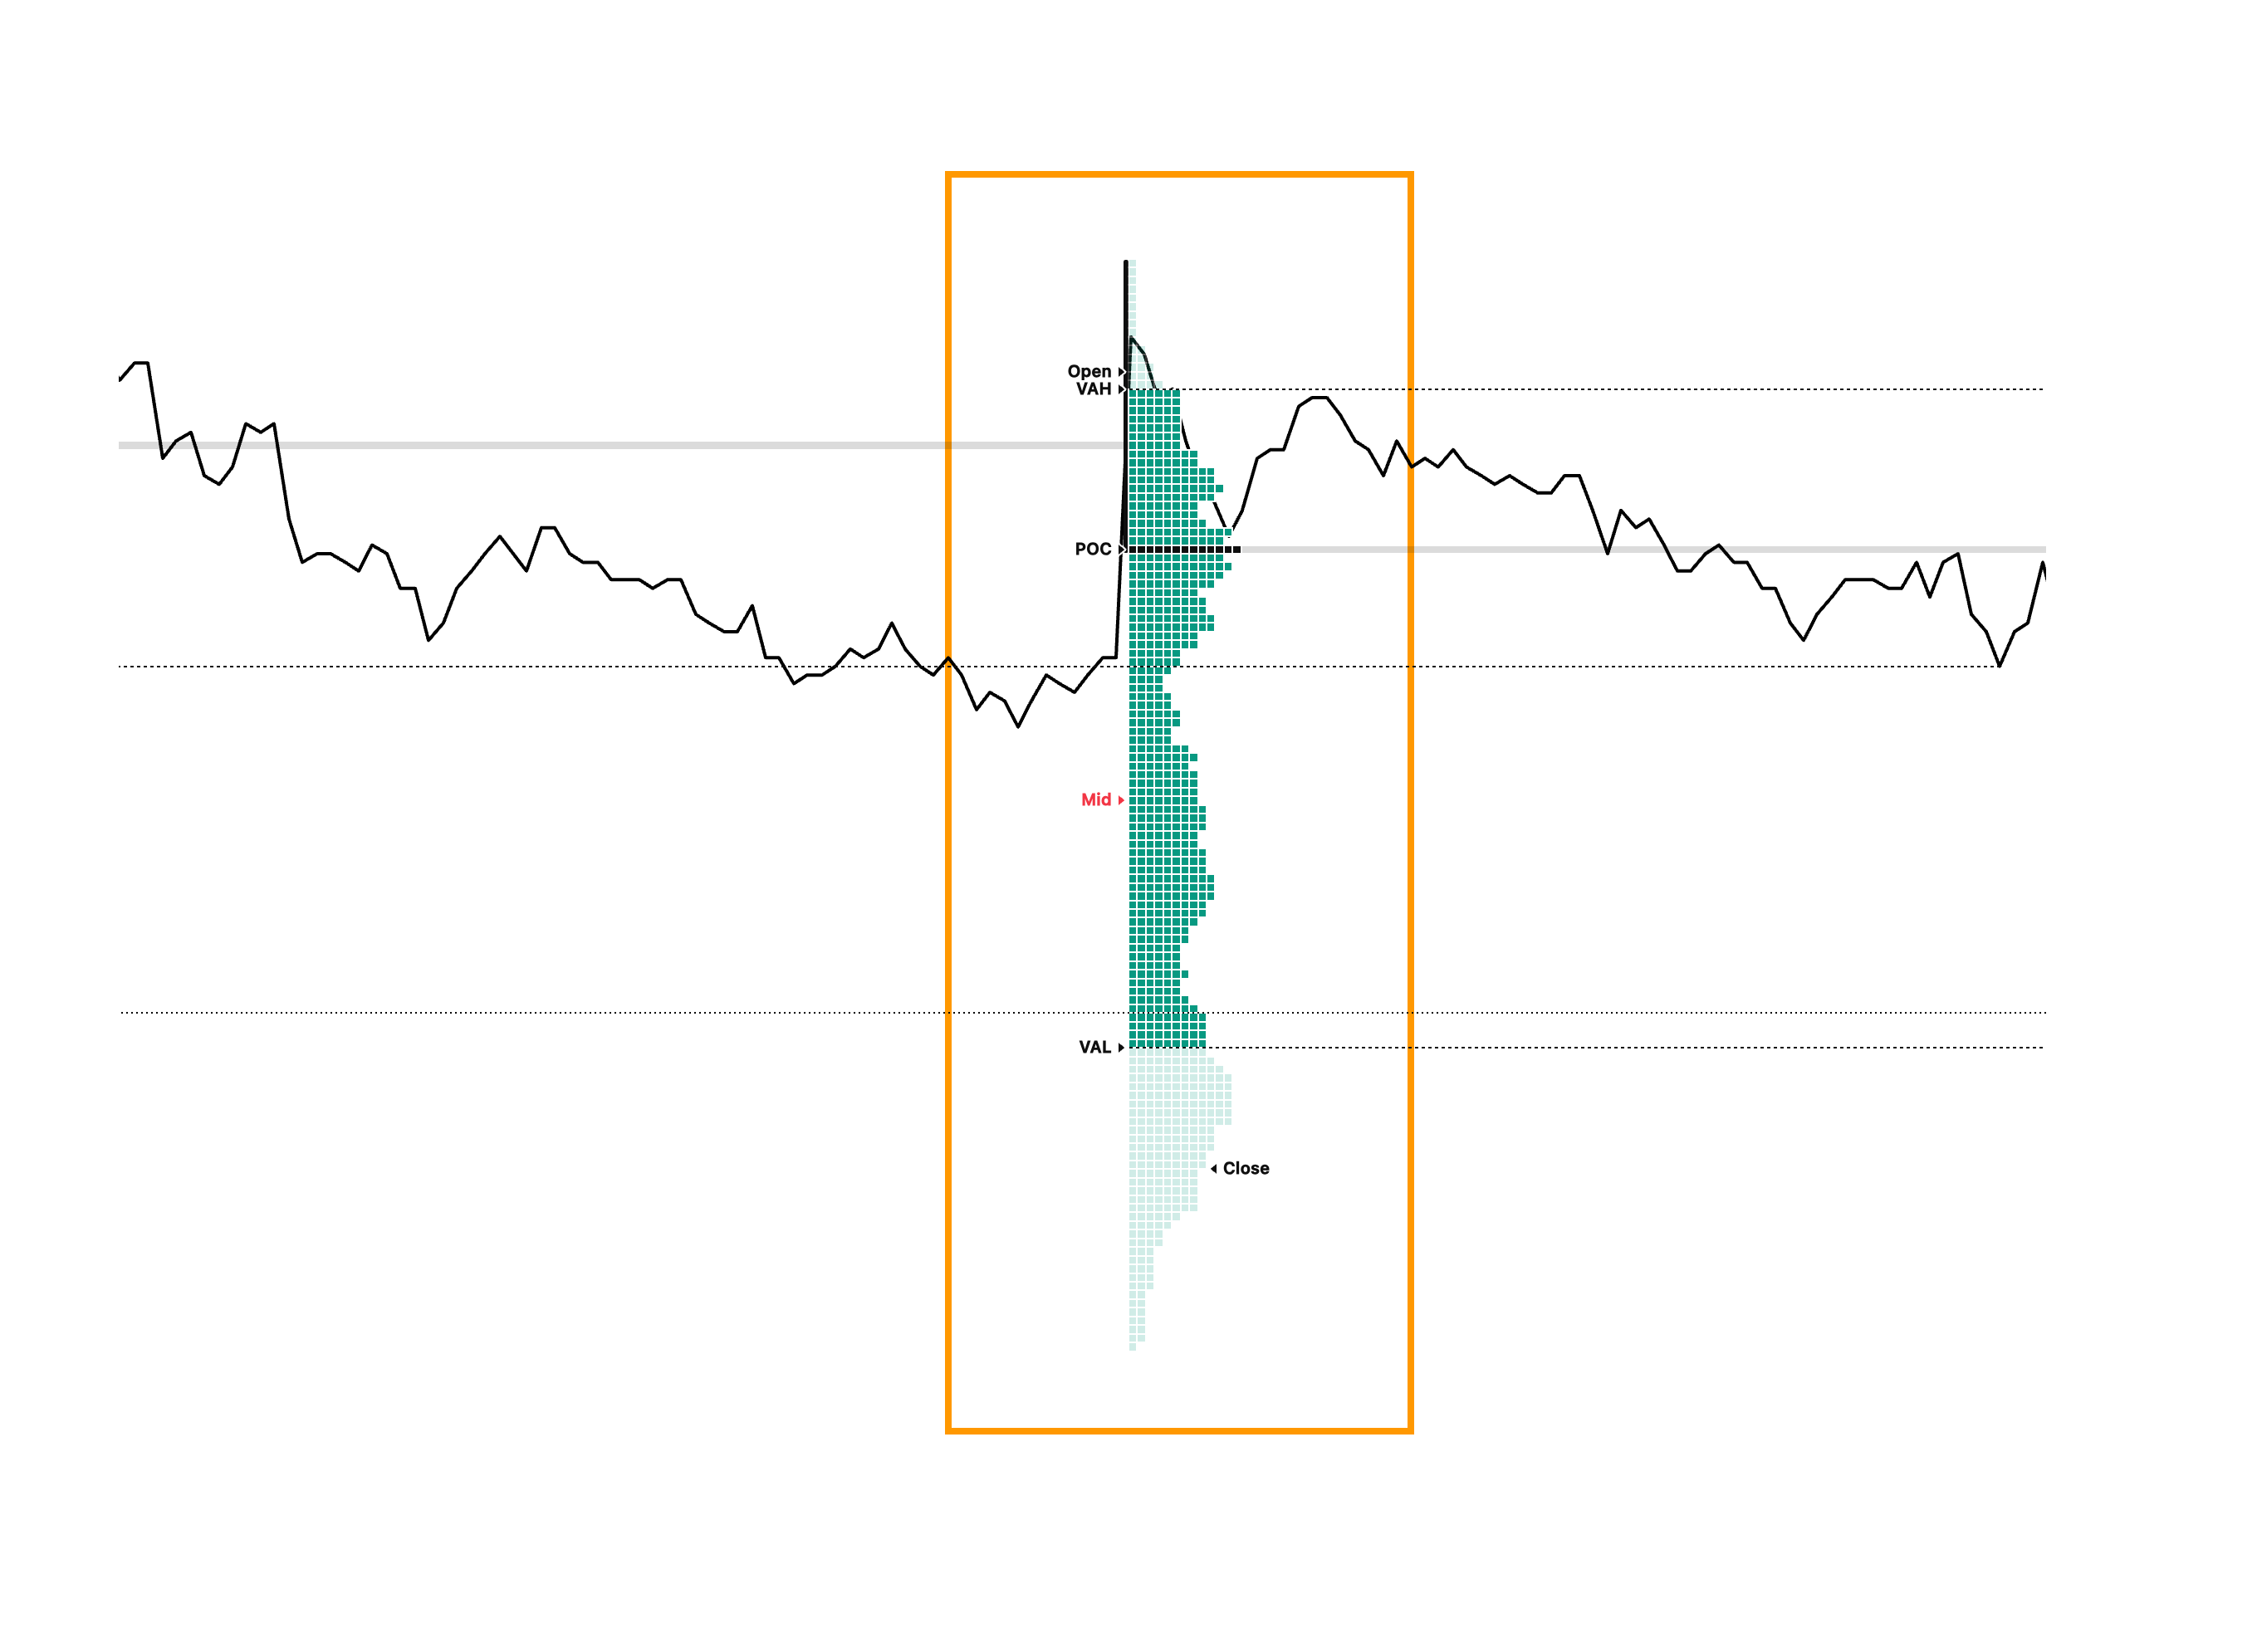
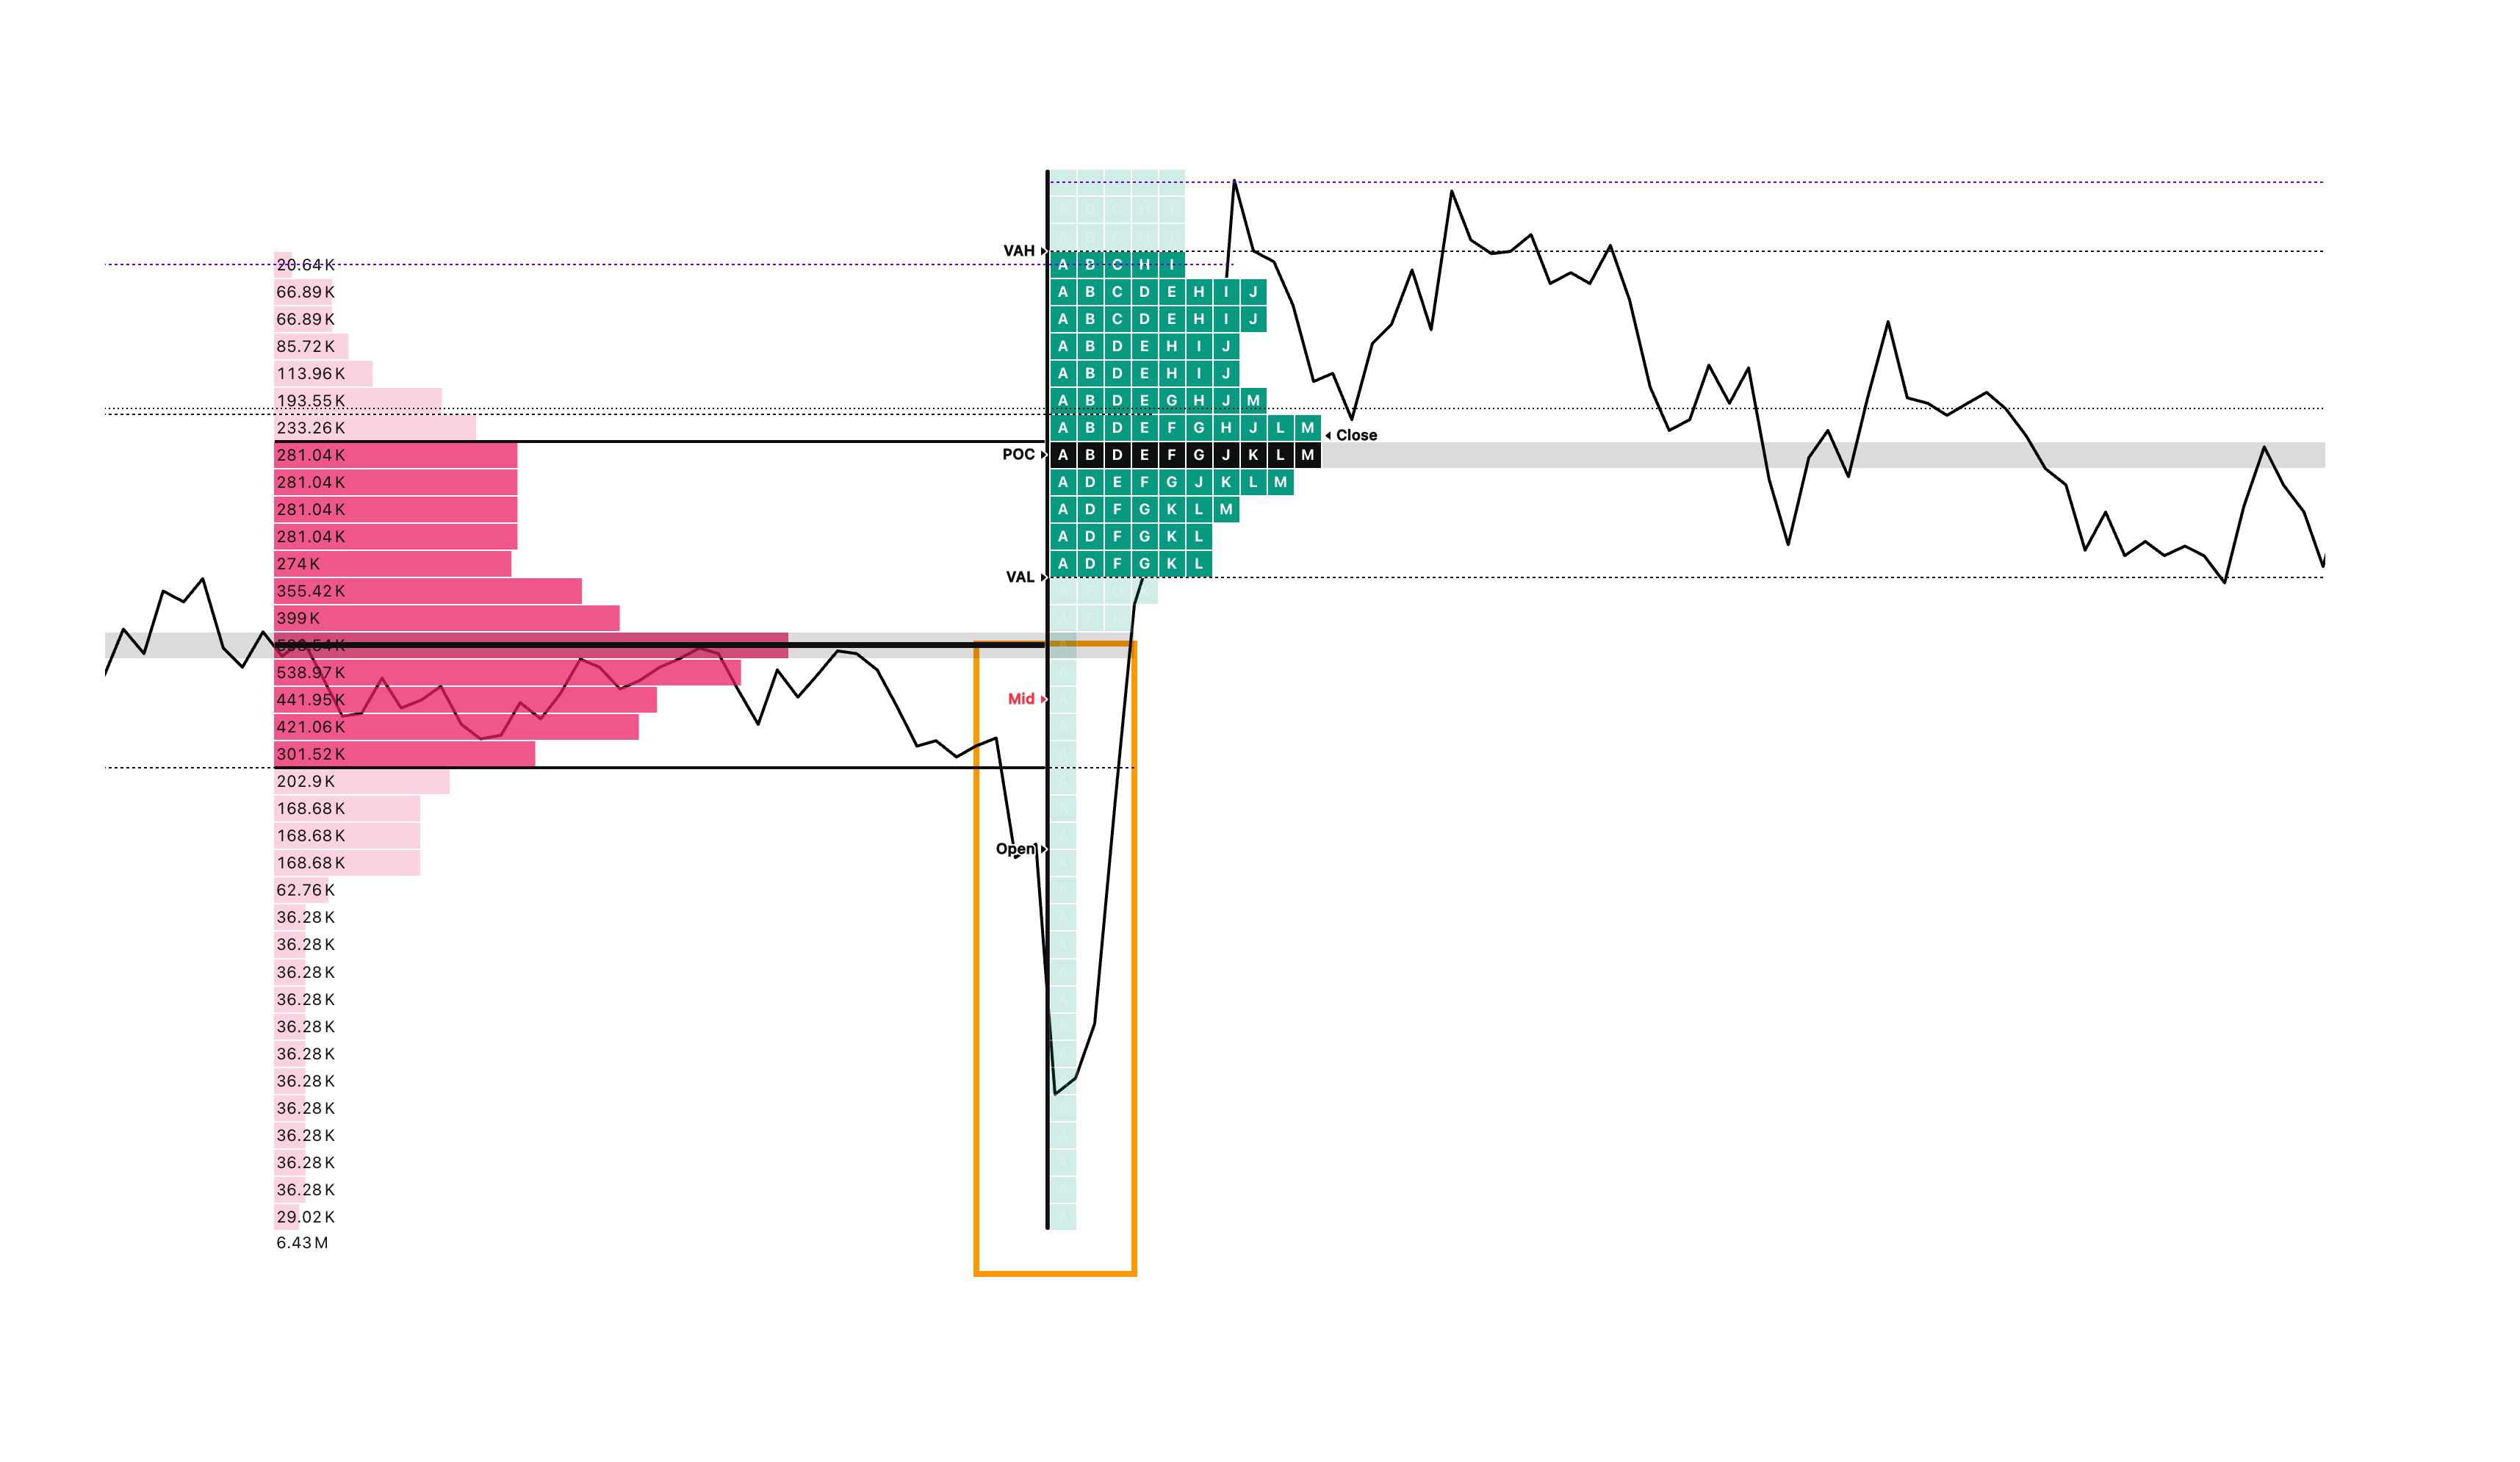
- Buying Tail: Two or more single-TPO prints at the session low, representing aggressive buyer rejection of lower prices (strong structural support).
Buying Tail
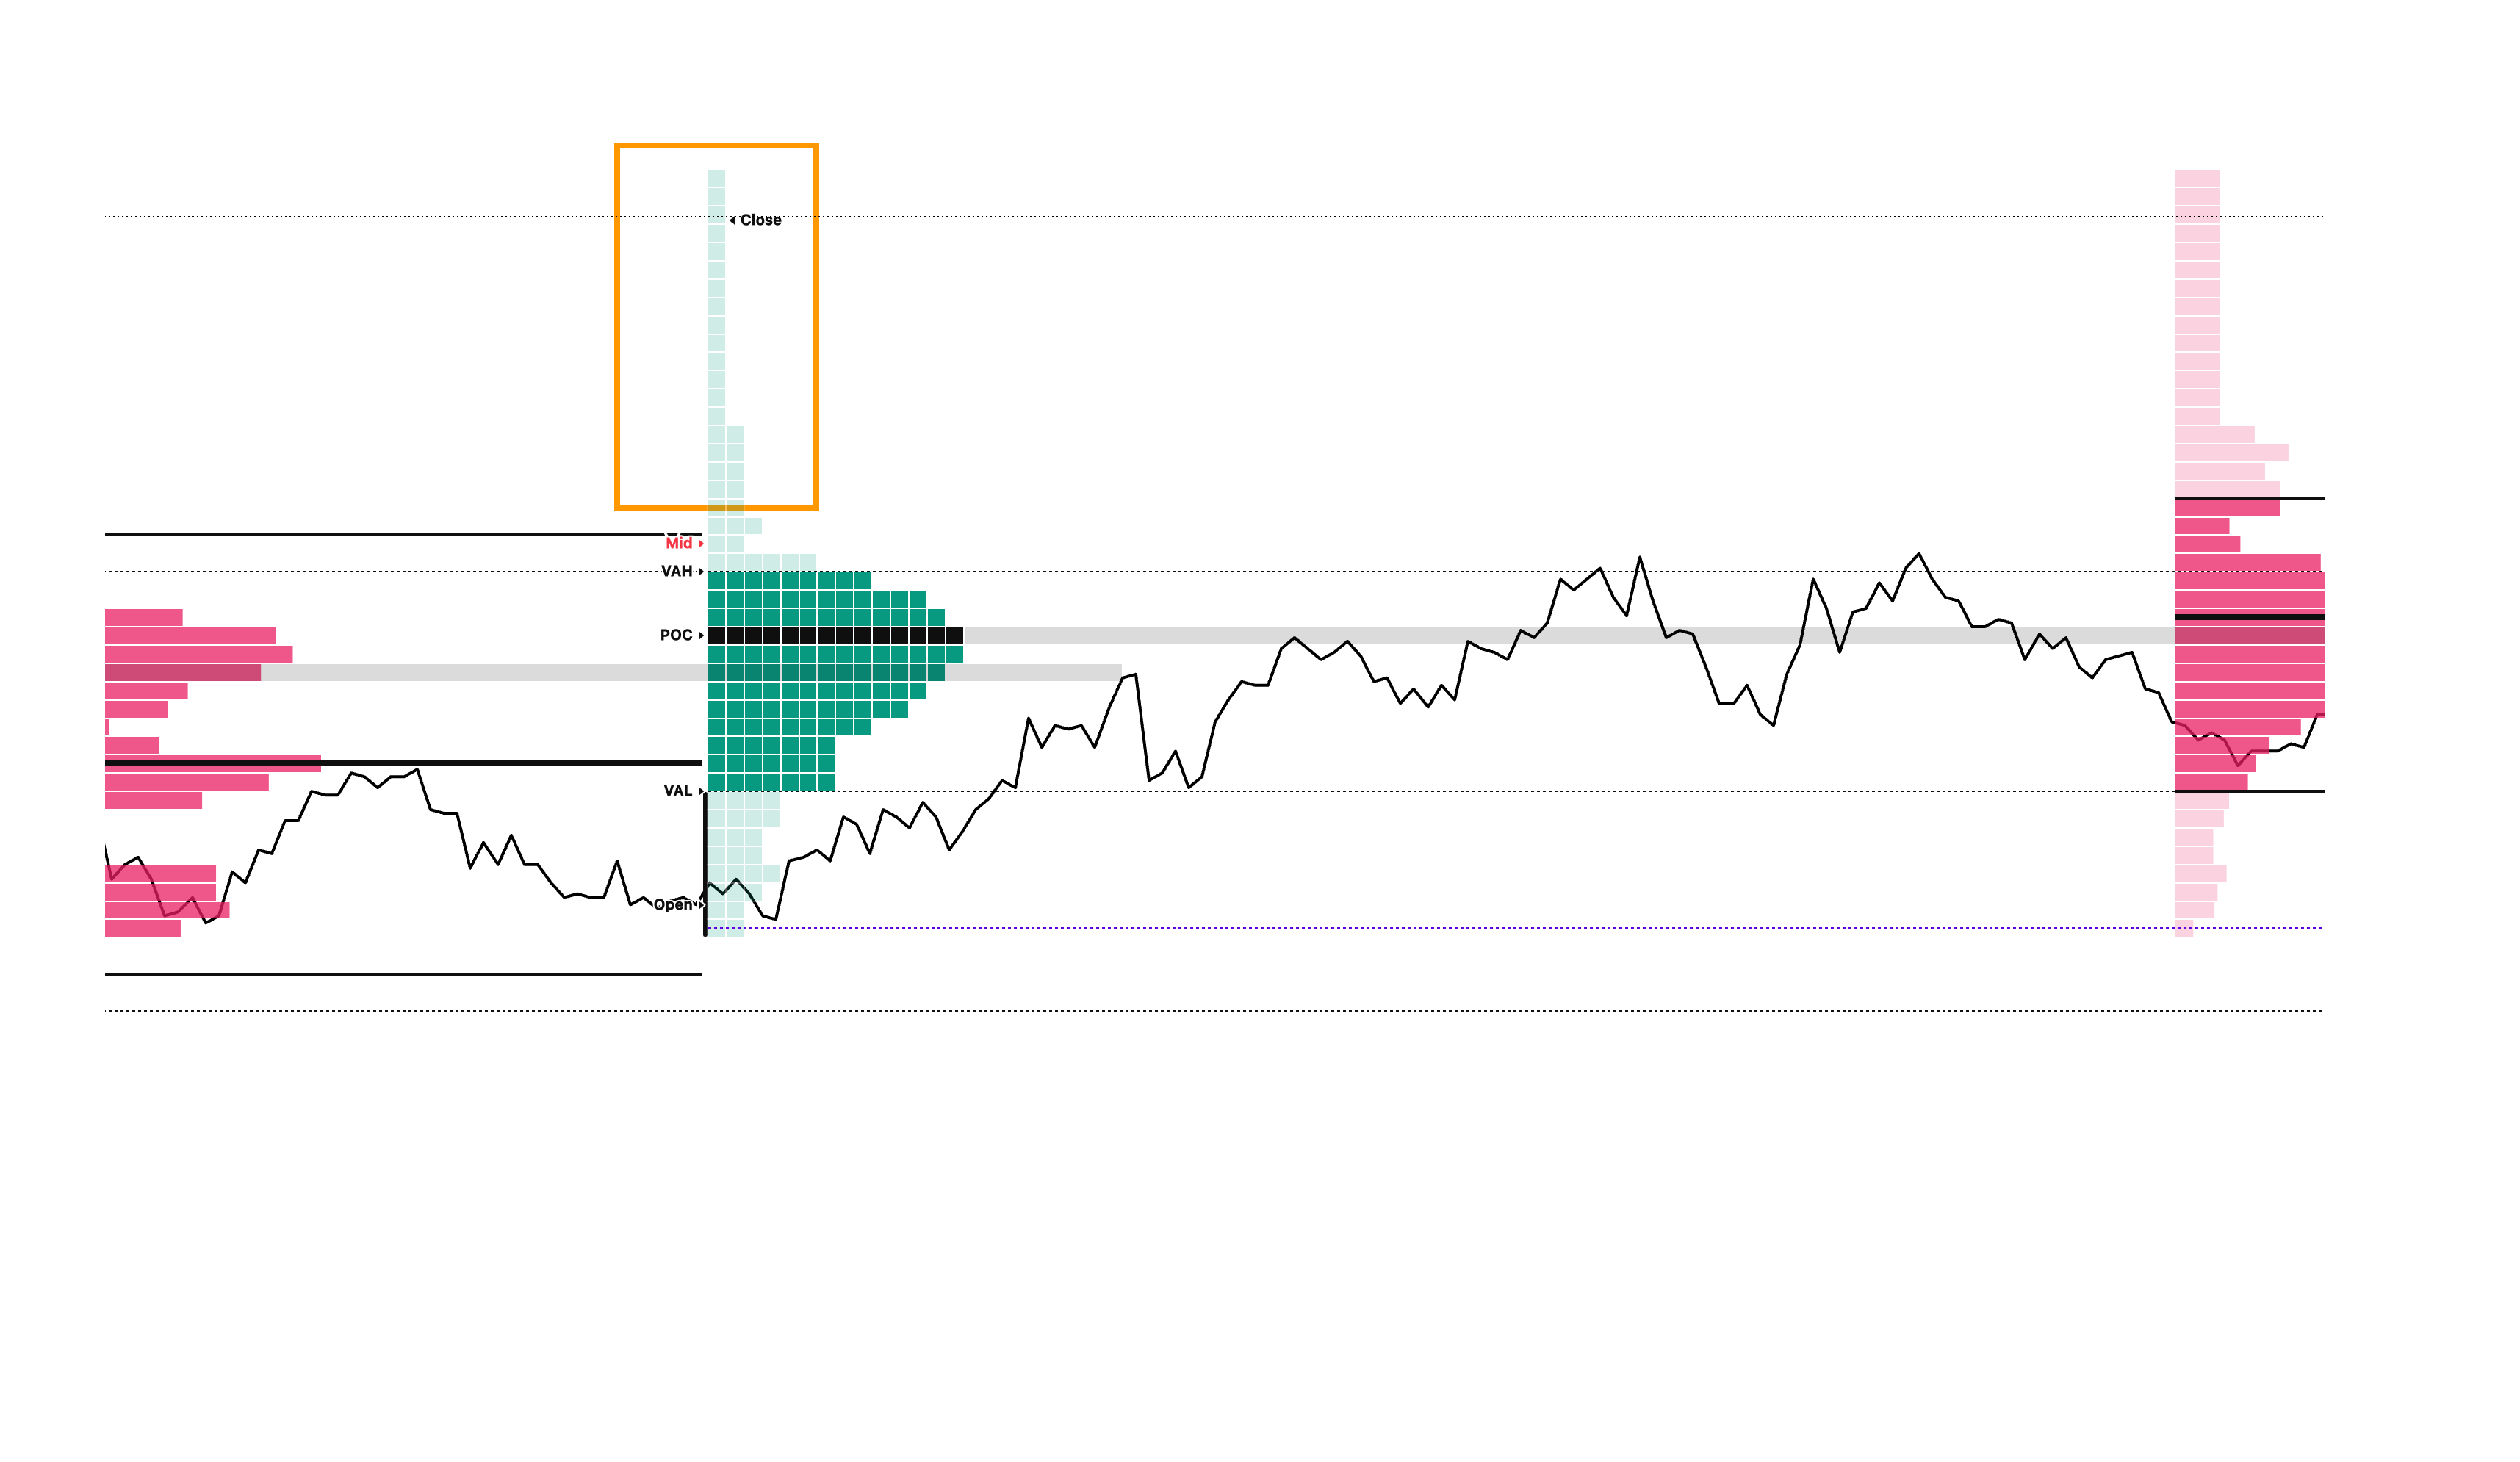
- Selling Tail: Two or more single-TPO prints at the session high, representing aggressive seller rejection of higher prices (strong structural resistance).
Selling Tail
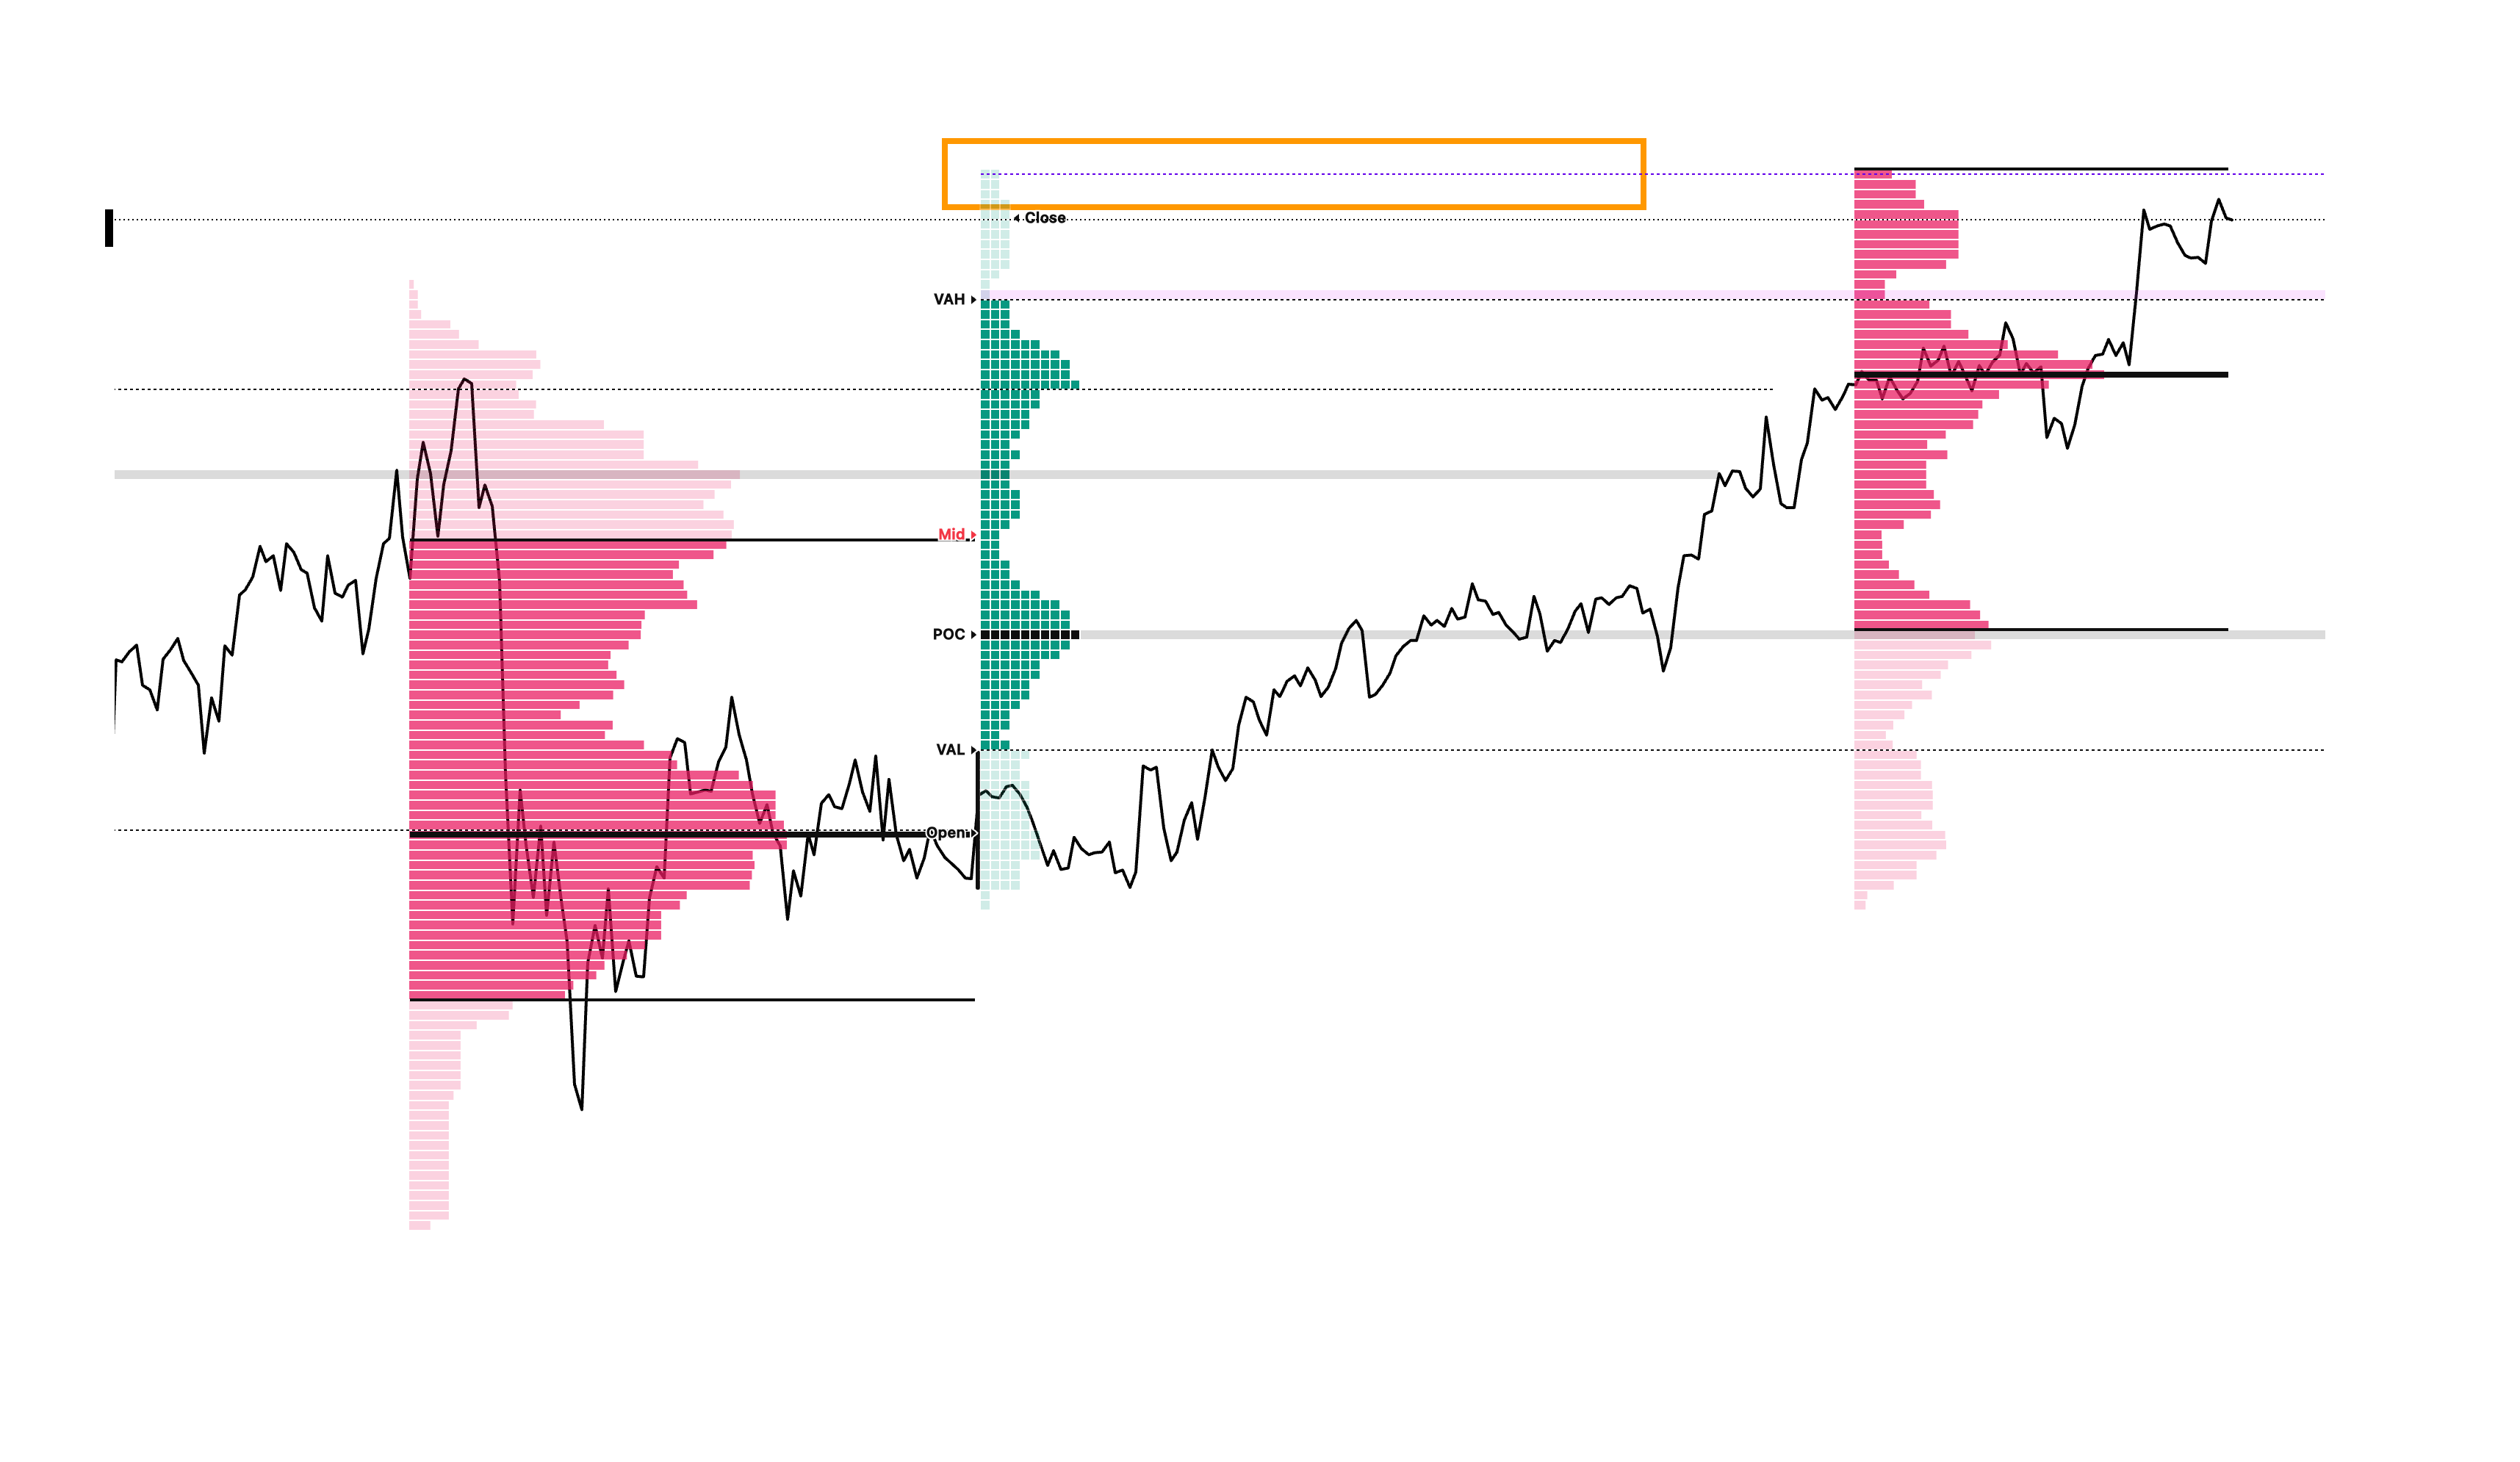
- Poor High / Poor Low: Multiple TPOs at an extreme without a distinct single-print tail. Indicates an unfinished auction that is highly likely to be retested and repaired in subsequent sessions.
Poor High and Poor Low
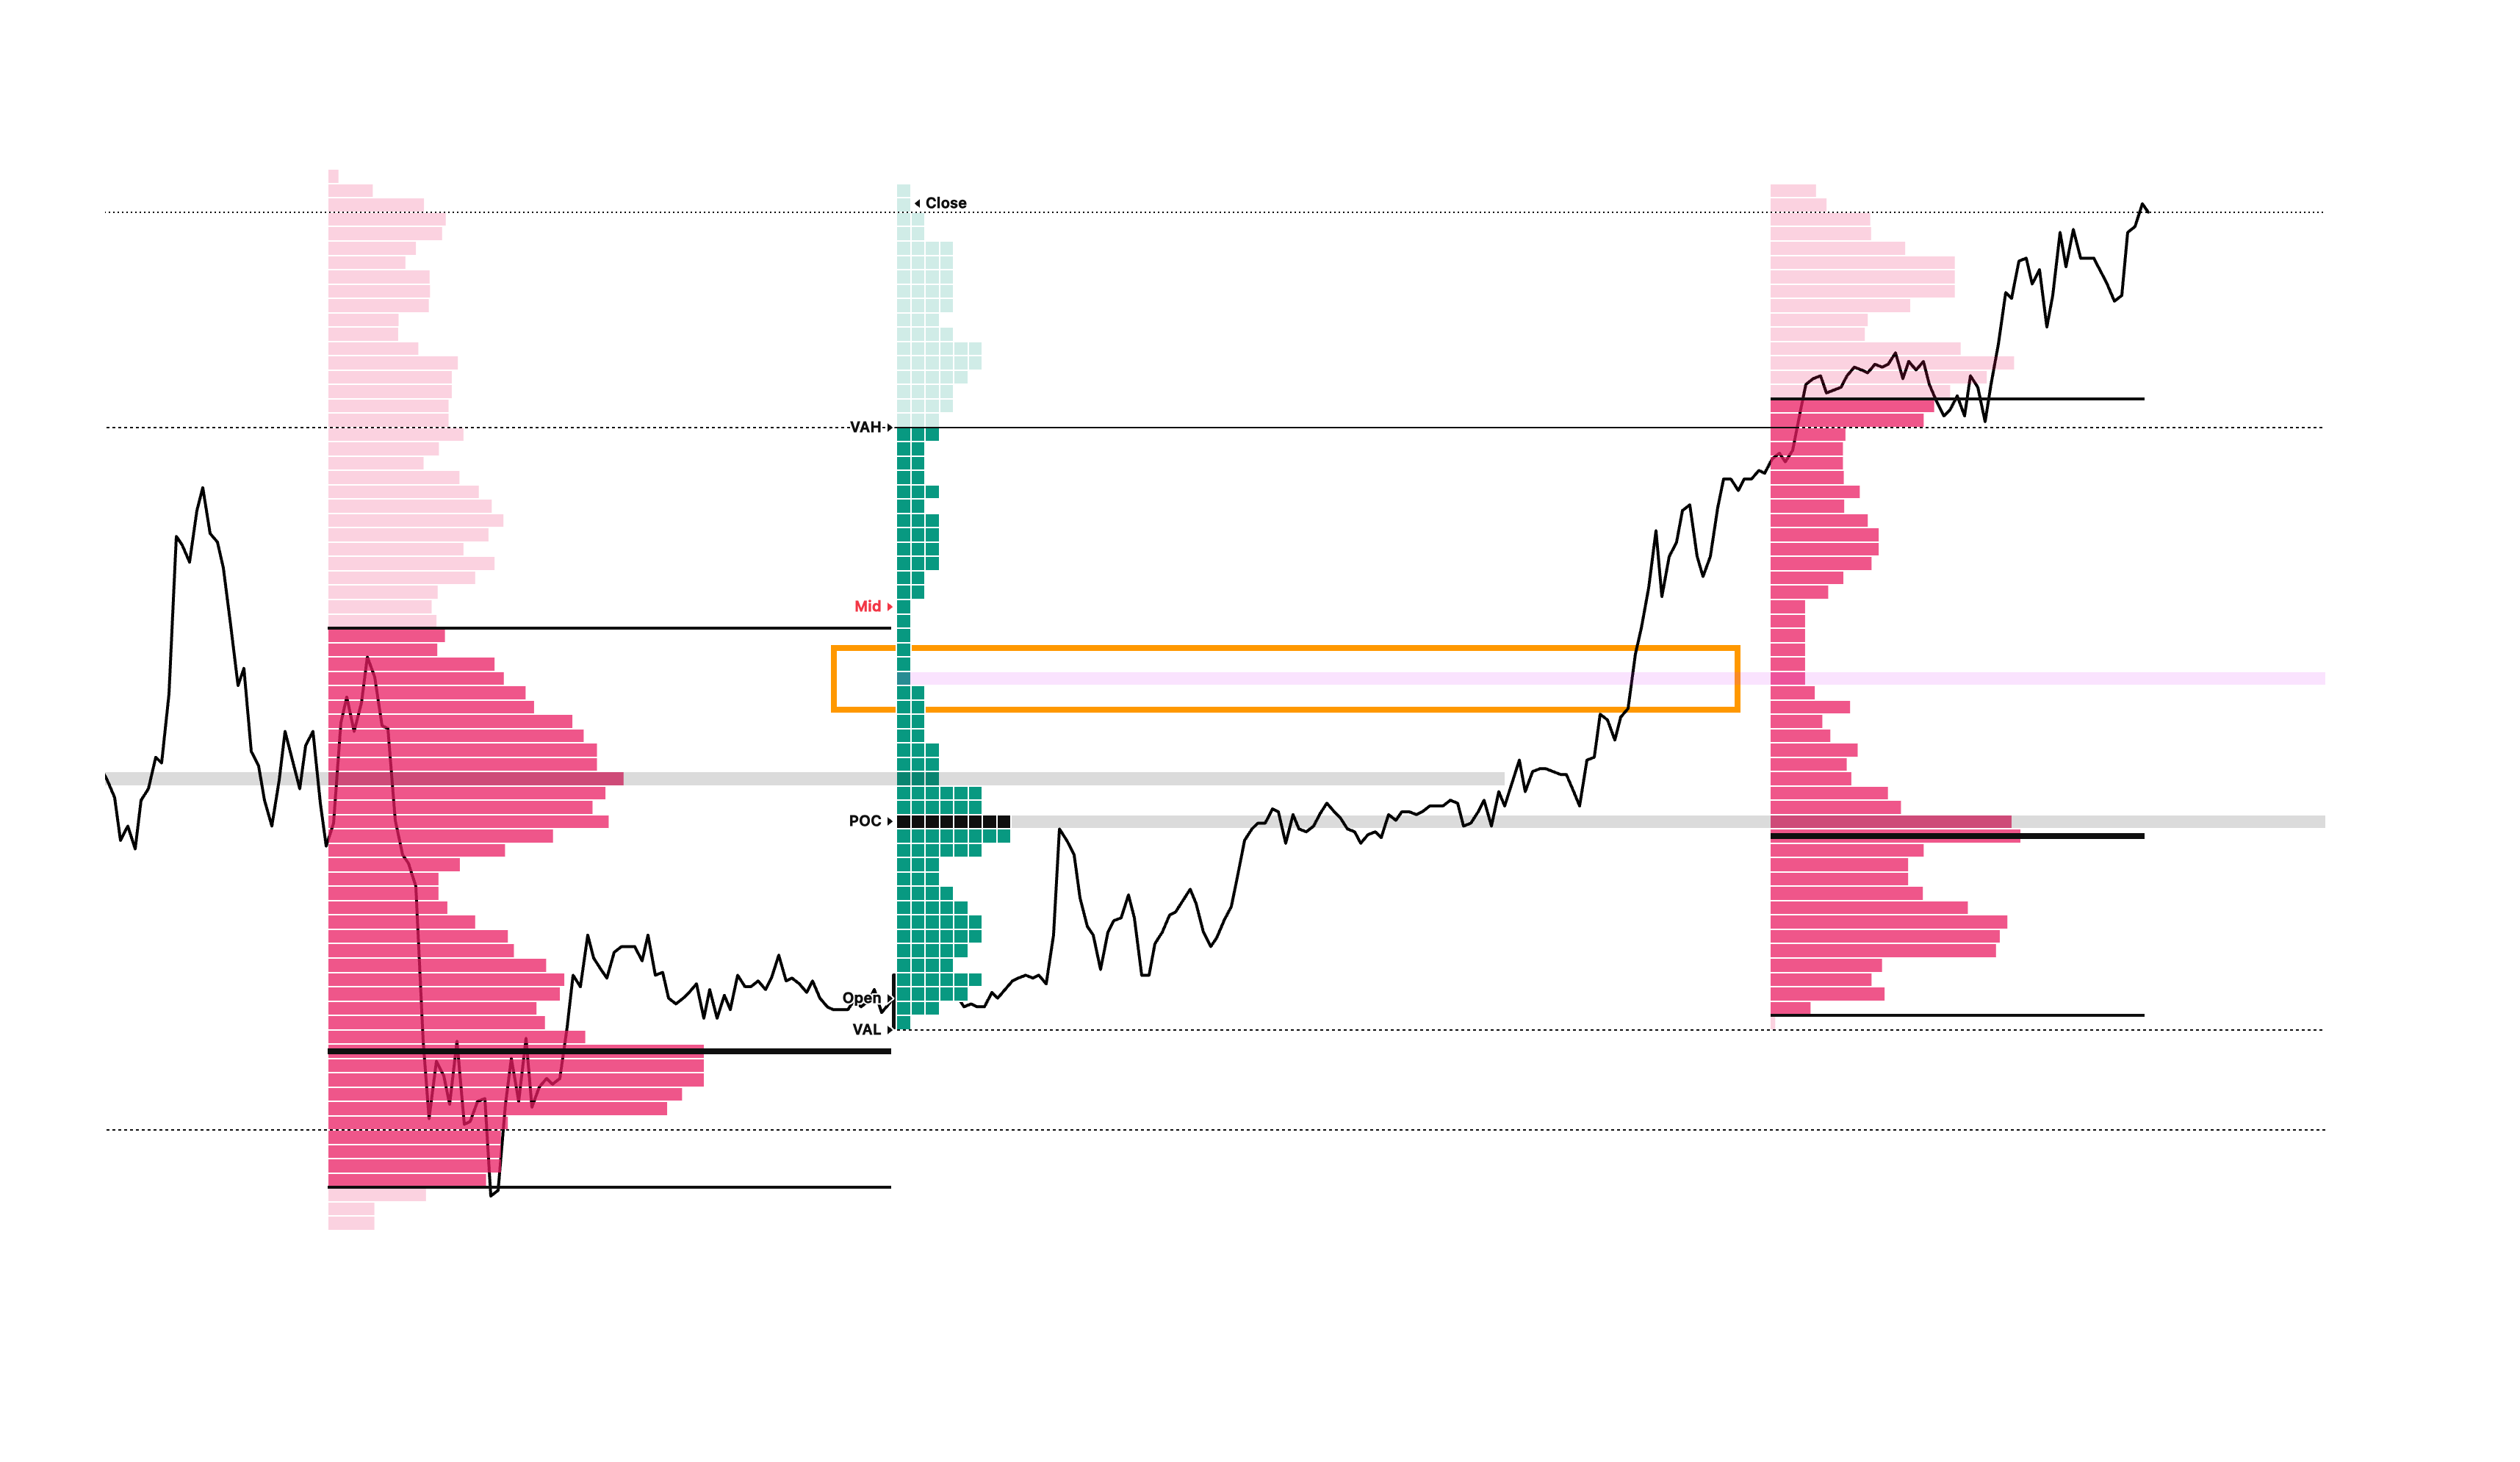
- Single Prints: Thin single-TPO columns inside the profile body created when price moves rapidly. These act as liquidity voids and high-probability retest targets.
Single Prints
High Volume Nodes (HVN) & Low Volume Nodes (LVN)
- High Volume Node (HVN): A price level featuring heavy contract volume. Represents sustained two-way trade facilitation. HVNs act as price magnets and robust support/resistance zones.
High Volume Node (HVN)
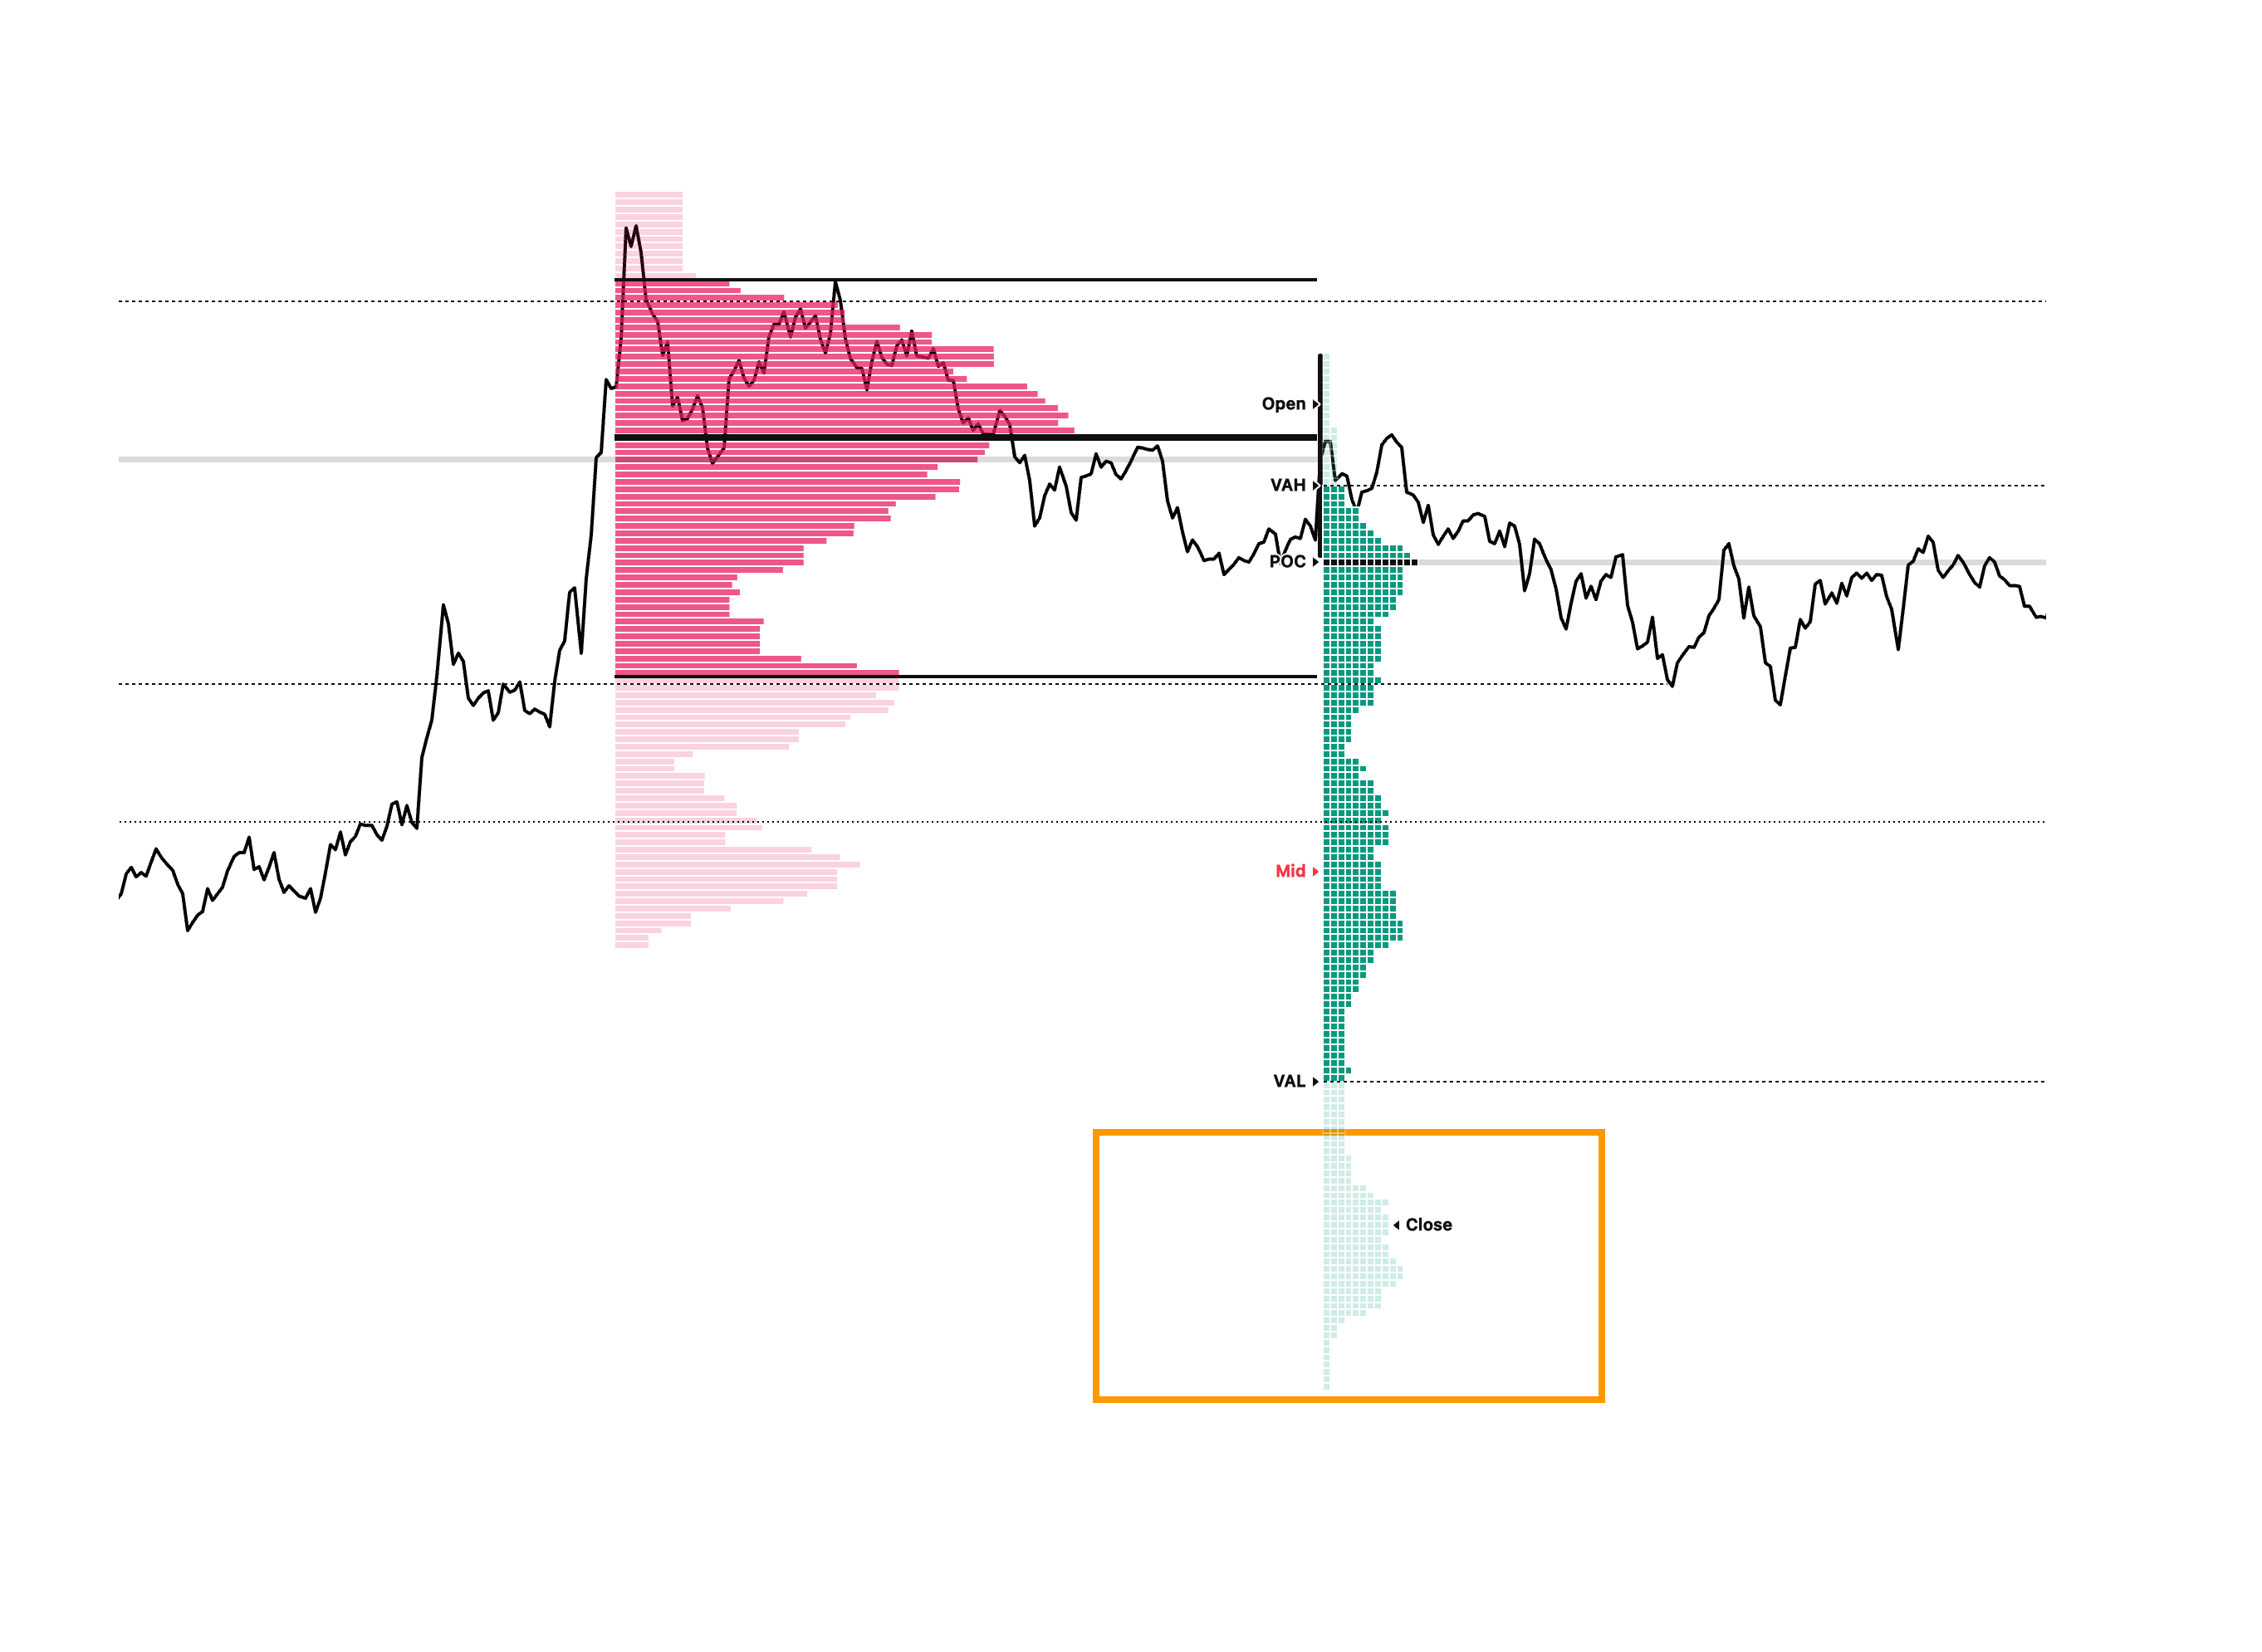
- Low Volume Node (LVN): A price level with minimal volume accumulation where price traversed rapidly. LVNs act as low-resistance acceleration zones (momentum entries).
Low Volume Node (LVN)
4. Market Conditions & Behavioral States
Understanding market state is what separates structural traders from indicator-based traders:
- Absorption: One side consumes all passive liquidity at a key level without price advancing. High volume at an HVN or extreme with narrow price range. Strategy: Wait for passive absorption to complete, then trade the resulting breakout.
- Exhaustion: The initiative side exhausts its aggressive buying/selling power at range extremes. Delta diverges sharply. Strategy: Fade the extreme with tight stops beyond the thin tail.
- Acceptance: Price holds and builds volume outside the prior Value Area. Strategy: Shift to trend-following; buy/sell pullbacks to the old VA boundary.
- Rejection: A probe outside value fails quickly, driving price back into the previous range. Strategy: Fade back toward POC and the opposite Value Area boundary.
- Failed Auction: A breakout fails to attract follow-through volume and reverses aggressively. Strategy: Enter on the first candle close back inside the range, targeting the far side of the profile.
- Balance: Fair value is established; buyers and sellers agree on price. Profiles form bell curves. Strategy: Mean-reversion—buy VAL, sell VAH.
- Imbalance: Strong directional value migration. Strategy: Trend-following only. Never fade a trending auction.
- Accumulation / Distribution: Institutional participants build or unwind positions across multiple sessions near Value Area extremes. Strategy: Align trades with institutional defense levels.
5. Responsive vs. Initiative Activity
Every trade in AMT falls into one of two behavioral categories:
- Responsive Buying (Below VAL): Price trades below fair value. Buyers perceive price as discounted. Trade: Long entry targeting POC and VAH, with stops below the low.
- Responsive Selling (Above VAH): Price trades above fair value. Sellers perceive price as expensive. Trade: Short entry targeting POC and VAL, with stops above the high.
- Initiative Buying (Above Prior VAH): Buyers aggressively purchase above established value, driving upward value migration. Trade: Long continuation entry using prior VAH as support.
- Initiative Selling (Below Prior VAL): Sellers aggressively sell below established value, driving downward value migration. Trade: Short continuation entry using prior VAL as resistance.
Execution Rule: Responsive activity calls for fading range extremes. Initiative activity calls for following directional momentum. Price location relative to the Value Area dictates which model to apply.
6. Common Pitfalls to Avoid
- Fading Trend Days: Fading VAH on a genuine trend day is a common account-destroying mistake. Trend days exhibit narrow Initial Balances, immediate single-print extensions, and persistent value migration. Follow the trend instead of fading.
- Ignoring Timeframe Context: A responsive buy at daily VAL has a very different risk profile if it conflicts with weekly imbalance. Always align lower-timeframe trades with higher-timeframe value structure.
- Using Stale Reference Levels: Applying outdated Value Area boundaries after a new value area has established leads to misaligned trades. Update reference levels daily.
- Treating POC as Rigid Support or Resistance: The POC is a fair-value magnet, not a rigid boundary. Price frequently cuts back and forth through the POC during rotational sessions.
- Applying Rigid Mechanical Rules: Trading VAH/VAL mechanically without evaluating volume, day type, or market state leads to whipsaws. AMT demands contextual judgment.
- Overlooking Failed Auctions: Failed breakouts offer high-conviction setup opportunities. When a breakout lacks volume follow-through and reverses into the range, act decisively.
7. Footprint & Order Flow Integration
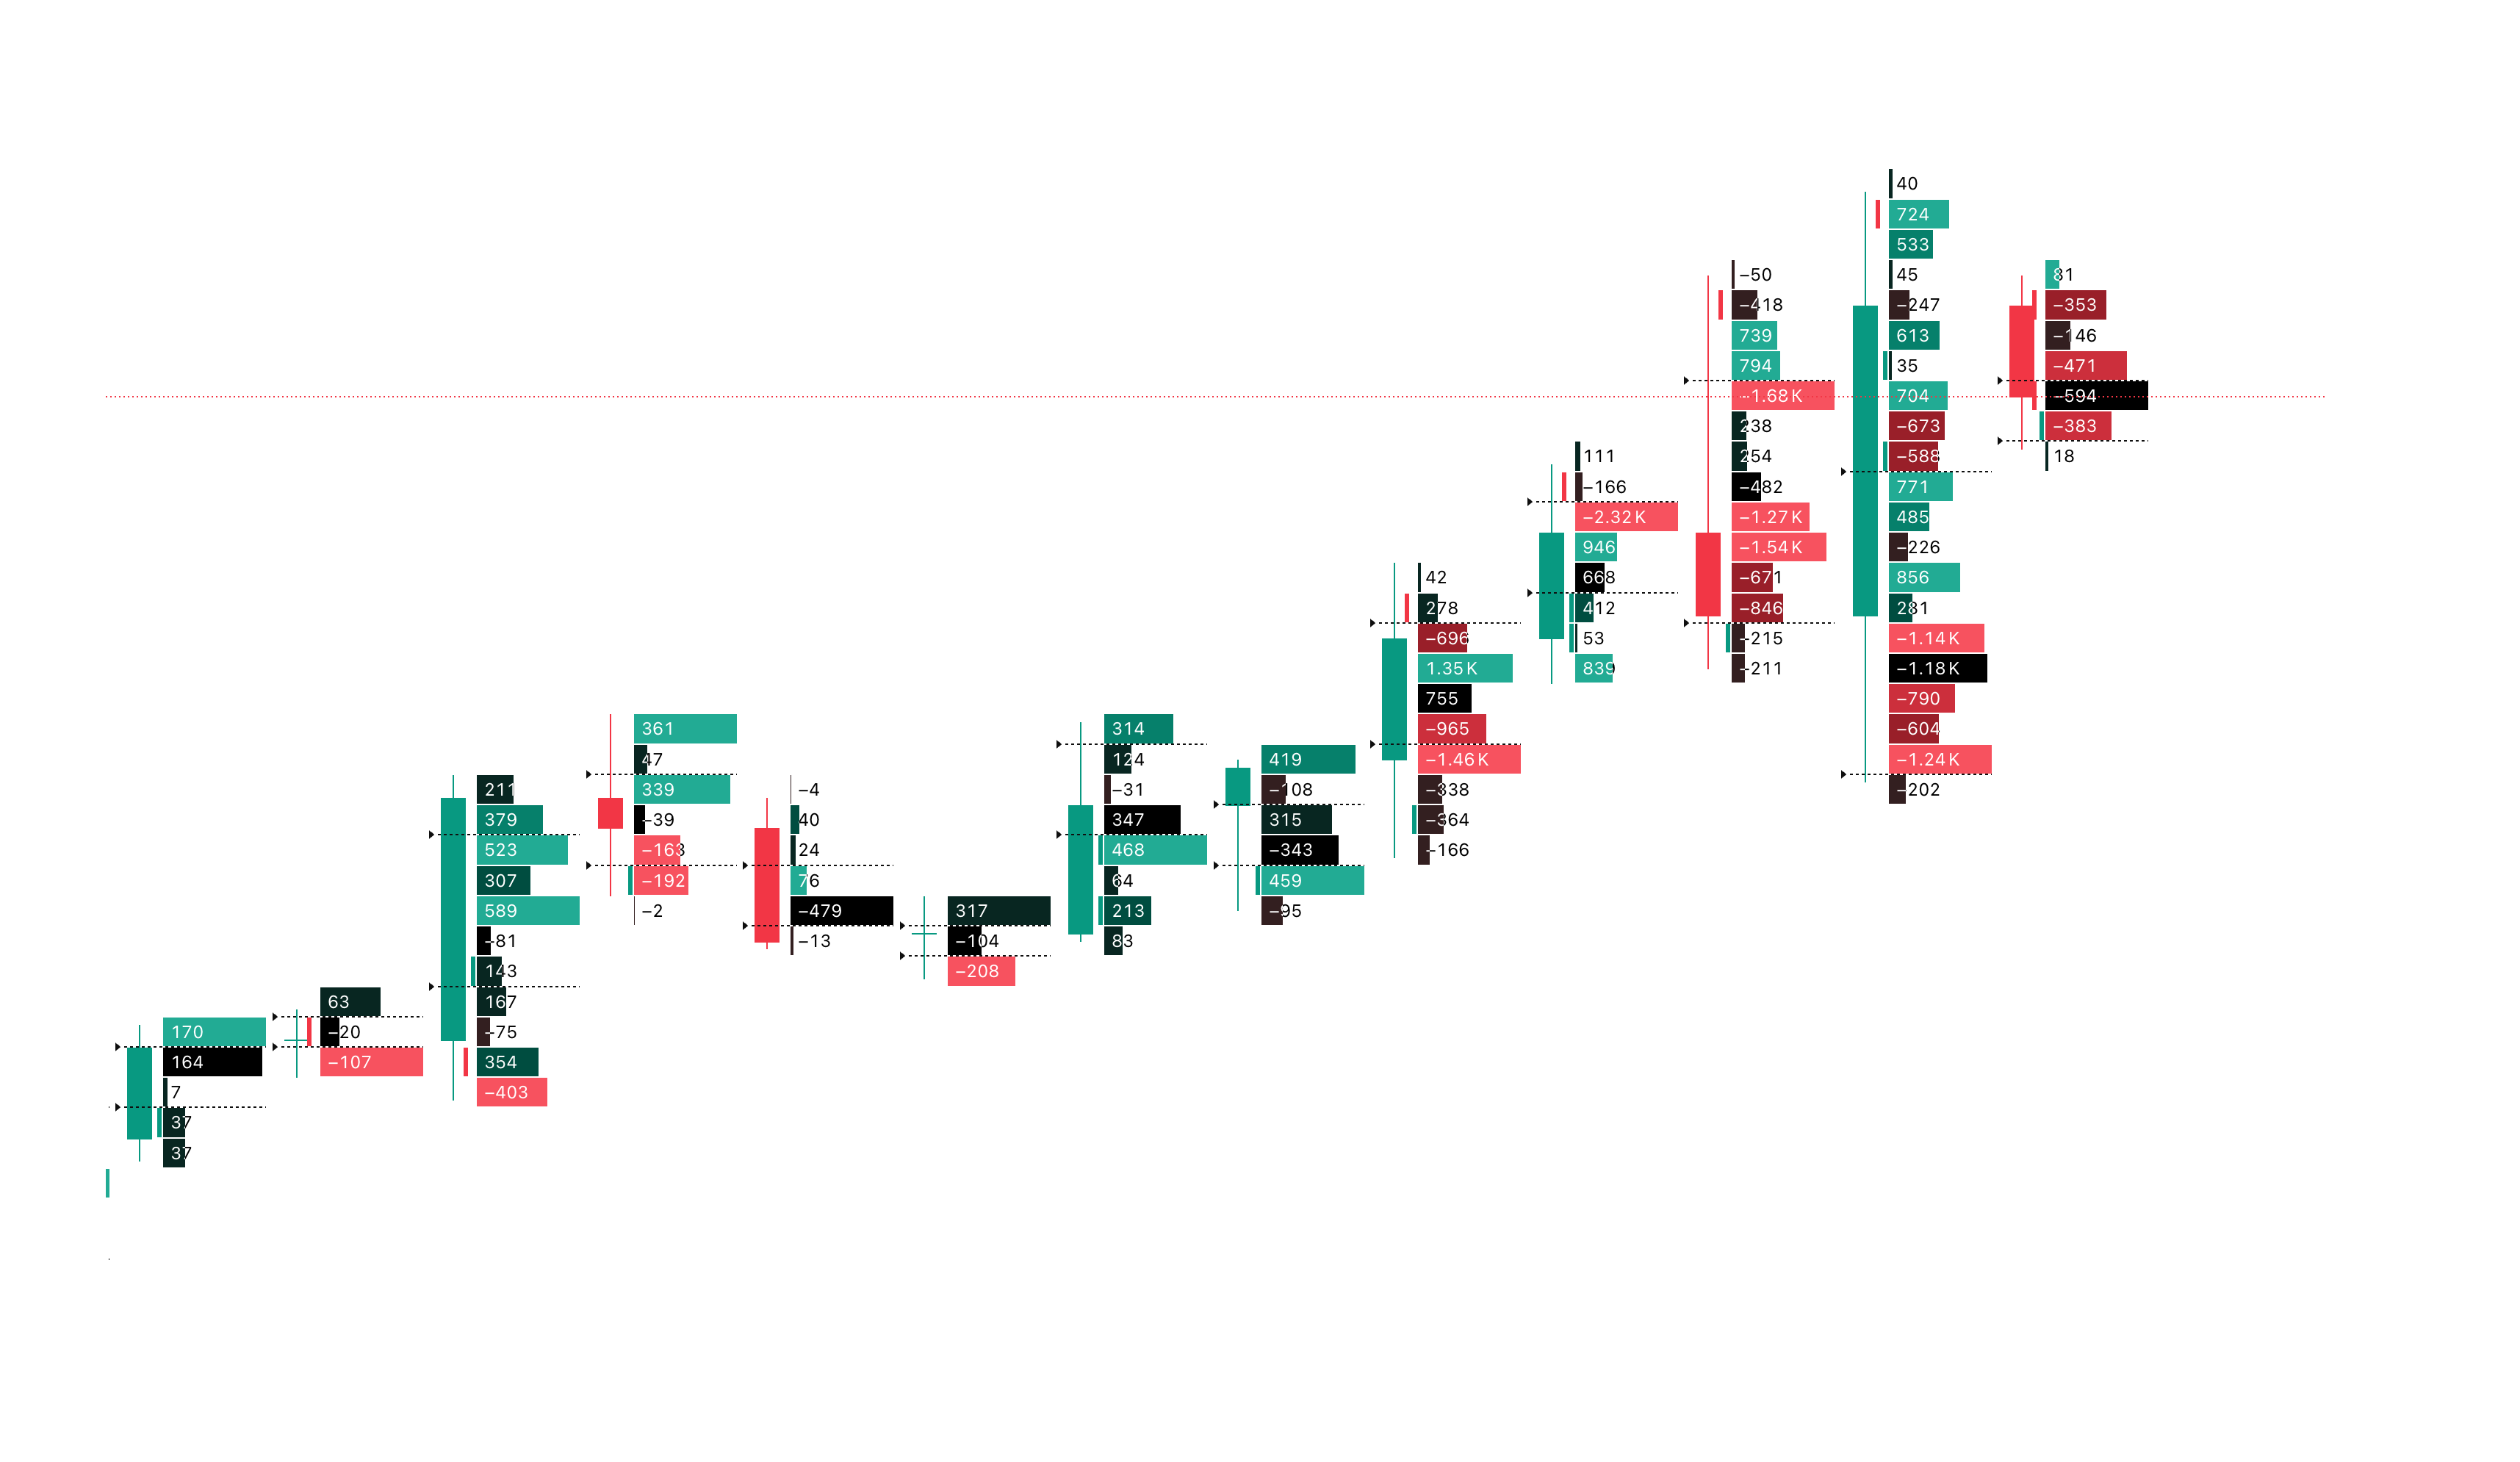
Auction Market Theory provides the macro map; Footprint order flow provides the real-time compass. AMT identifies key value zones, while Footprint charts reveal how aggressive buyers (ask) and sellers (bid) interact at those levels in real time.
Footprint and Order Flow
Key Footprint Elements
- Cumulative Volume Delta (CVD): Net aggressive buying minus aggressive selling. Delta Divergence at an AMT extreme (new price high with lower delta) signals buyer exhaustion.
- Bid/Ask Imbalances: Aggressive order imbalances (e.g., 3:1 ratio). Stacked Imbalances at VAH or VAL confirm institutional level defense.
- Passive Absorption: Heavy volume prints with zero price progression on the footprint matrix, indicating passive limit order absorption.
- Unfinished Auctions: Single-sided volume at candle high/low extremes that act as high-probability retest targets.
How Footprint Confirms AMT Setups
- Responsive Trades: Rejection at VAH/VAL is confirmed on Footprint when opposing stacked imbalances appear and Delta turns sharply against the probe.
- Acceptance Breakouts: Breakouts above VAH or below VAL are confirmed by expanding directional Delta and stacked initiative imbalances.
- Exhaustion Reversals: New session highs met with negative Delta divergence confirm that aggressive buyers have run out of fuel.
Final Summary
Auction Market Theory shifts your focus from guessing price targets to reading market intent. Instead of asking where price will go next, AMT asks: Is the market accepting or rejecting this price level? Who is in control of the auction? Are participants acting responsively or with initiative? Is value migrating or consolidating?
Mastering these core questions equips you with an institutional framework for navigating any liquid market.