
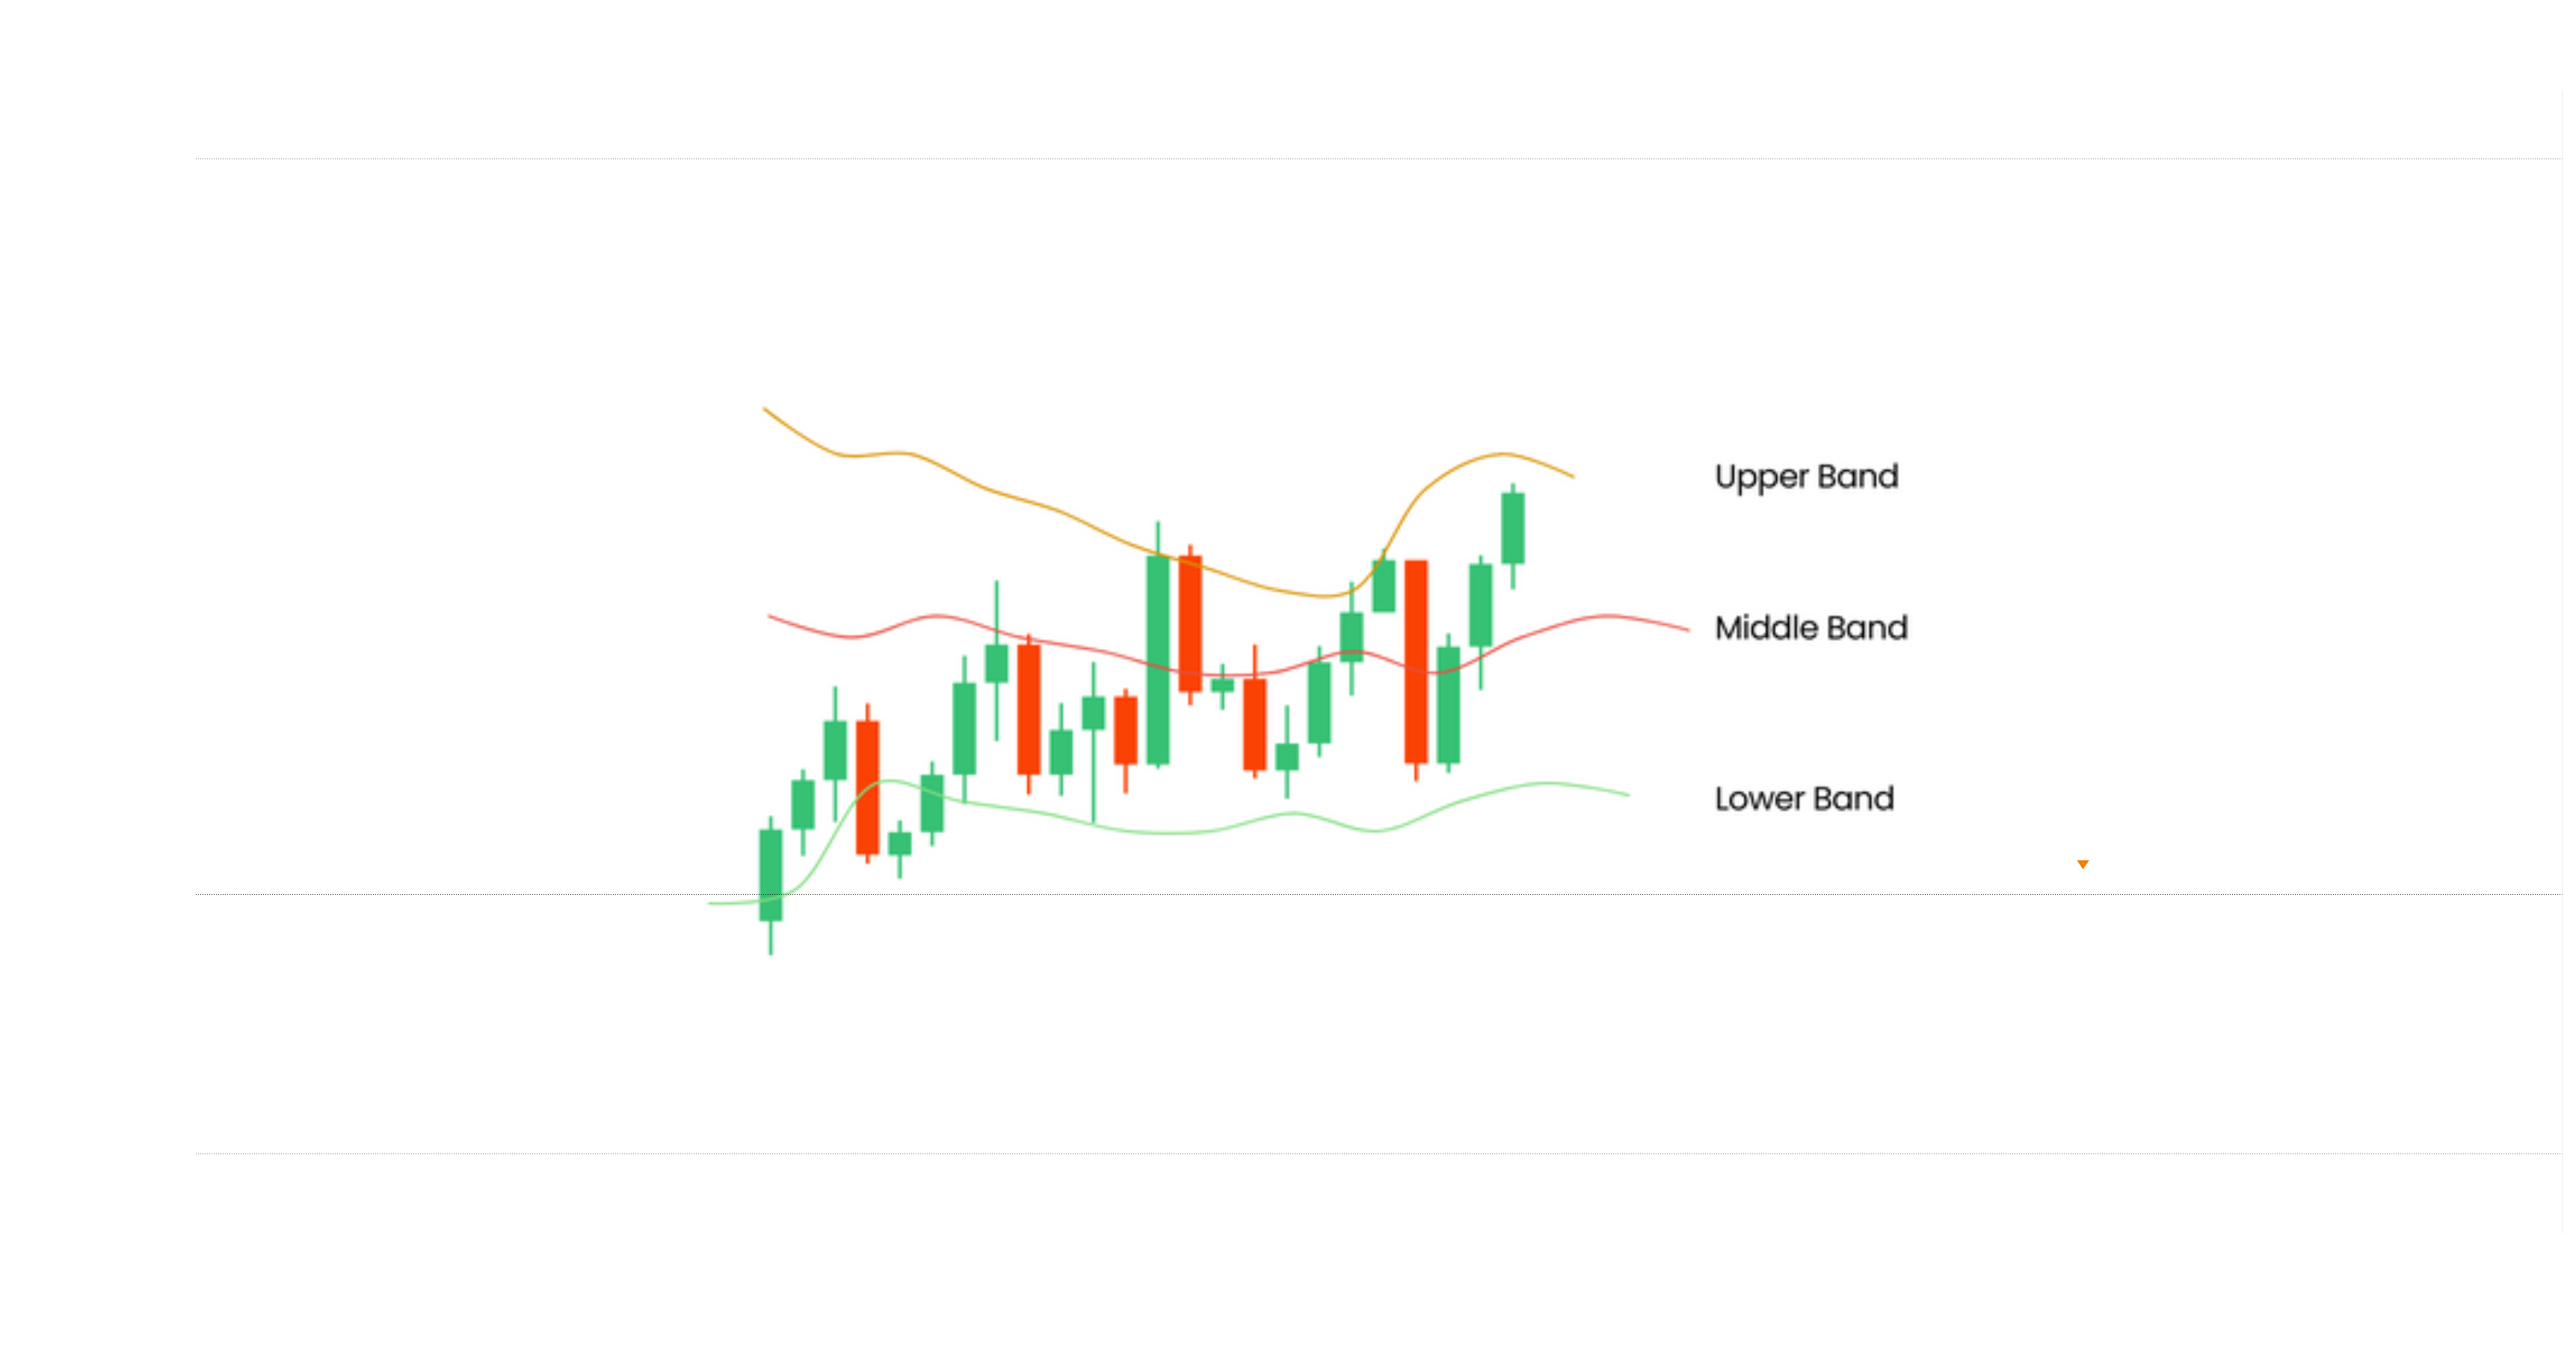
Bollinger Bands remain one of the most versatile technical analysis indicators in modern trading. Designed to measure market volatility and highlight overbought or oversold price levels, this powerful tool dynamically expands and contracts around price action. Whether you are scalping intraday moves, timing swing trades, or positioning for explosive breakouts, understanding how Bollinger Bands react to changing market conditions can give you a distinct statistical edge.
1. What are Bollinger Bands?
Bollinger Bands are a dynamic price channel indicator used by traders across stocks, forex, crypto, and futures to evaluate price dispersion and market volatility. Unlike static support and resistance lines, Bollinger Bands adjust in real time, contracting when the market cools down and expanding when aggressive buying or selling enters the market.
- Dynamic Volatility Tracking: The distance between the outer bands expands during explosive moves and contracts during quiet consolidation periods.
- Overbought & Oversold Context: The outer bands highlight statistical price extremes, signaling when price has stretched too far from its mean.
- Trend & Reversal Insights: Helps traders identify whether a market is in a strong trending regime, preparing for a squeeze breakout, or nearing a mean-reversion exhaustion point.
2. Components
Bollinger Bands Components
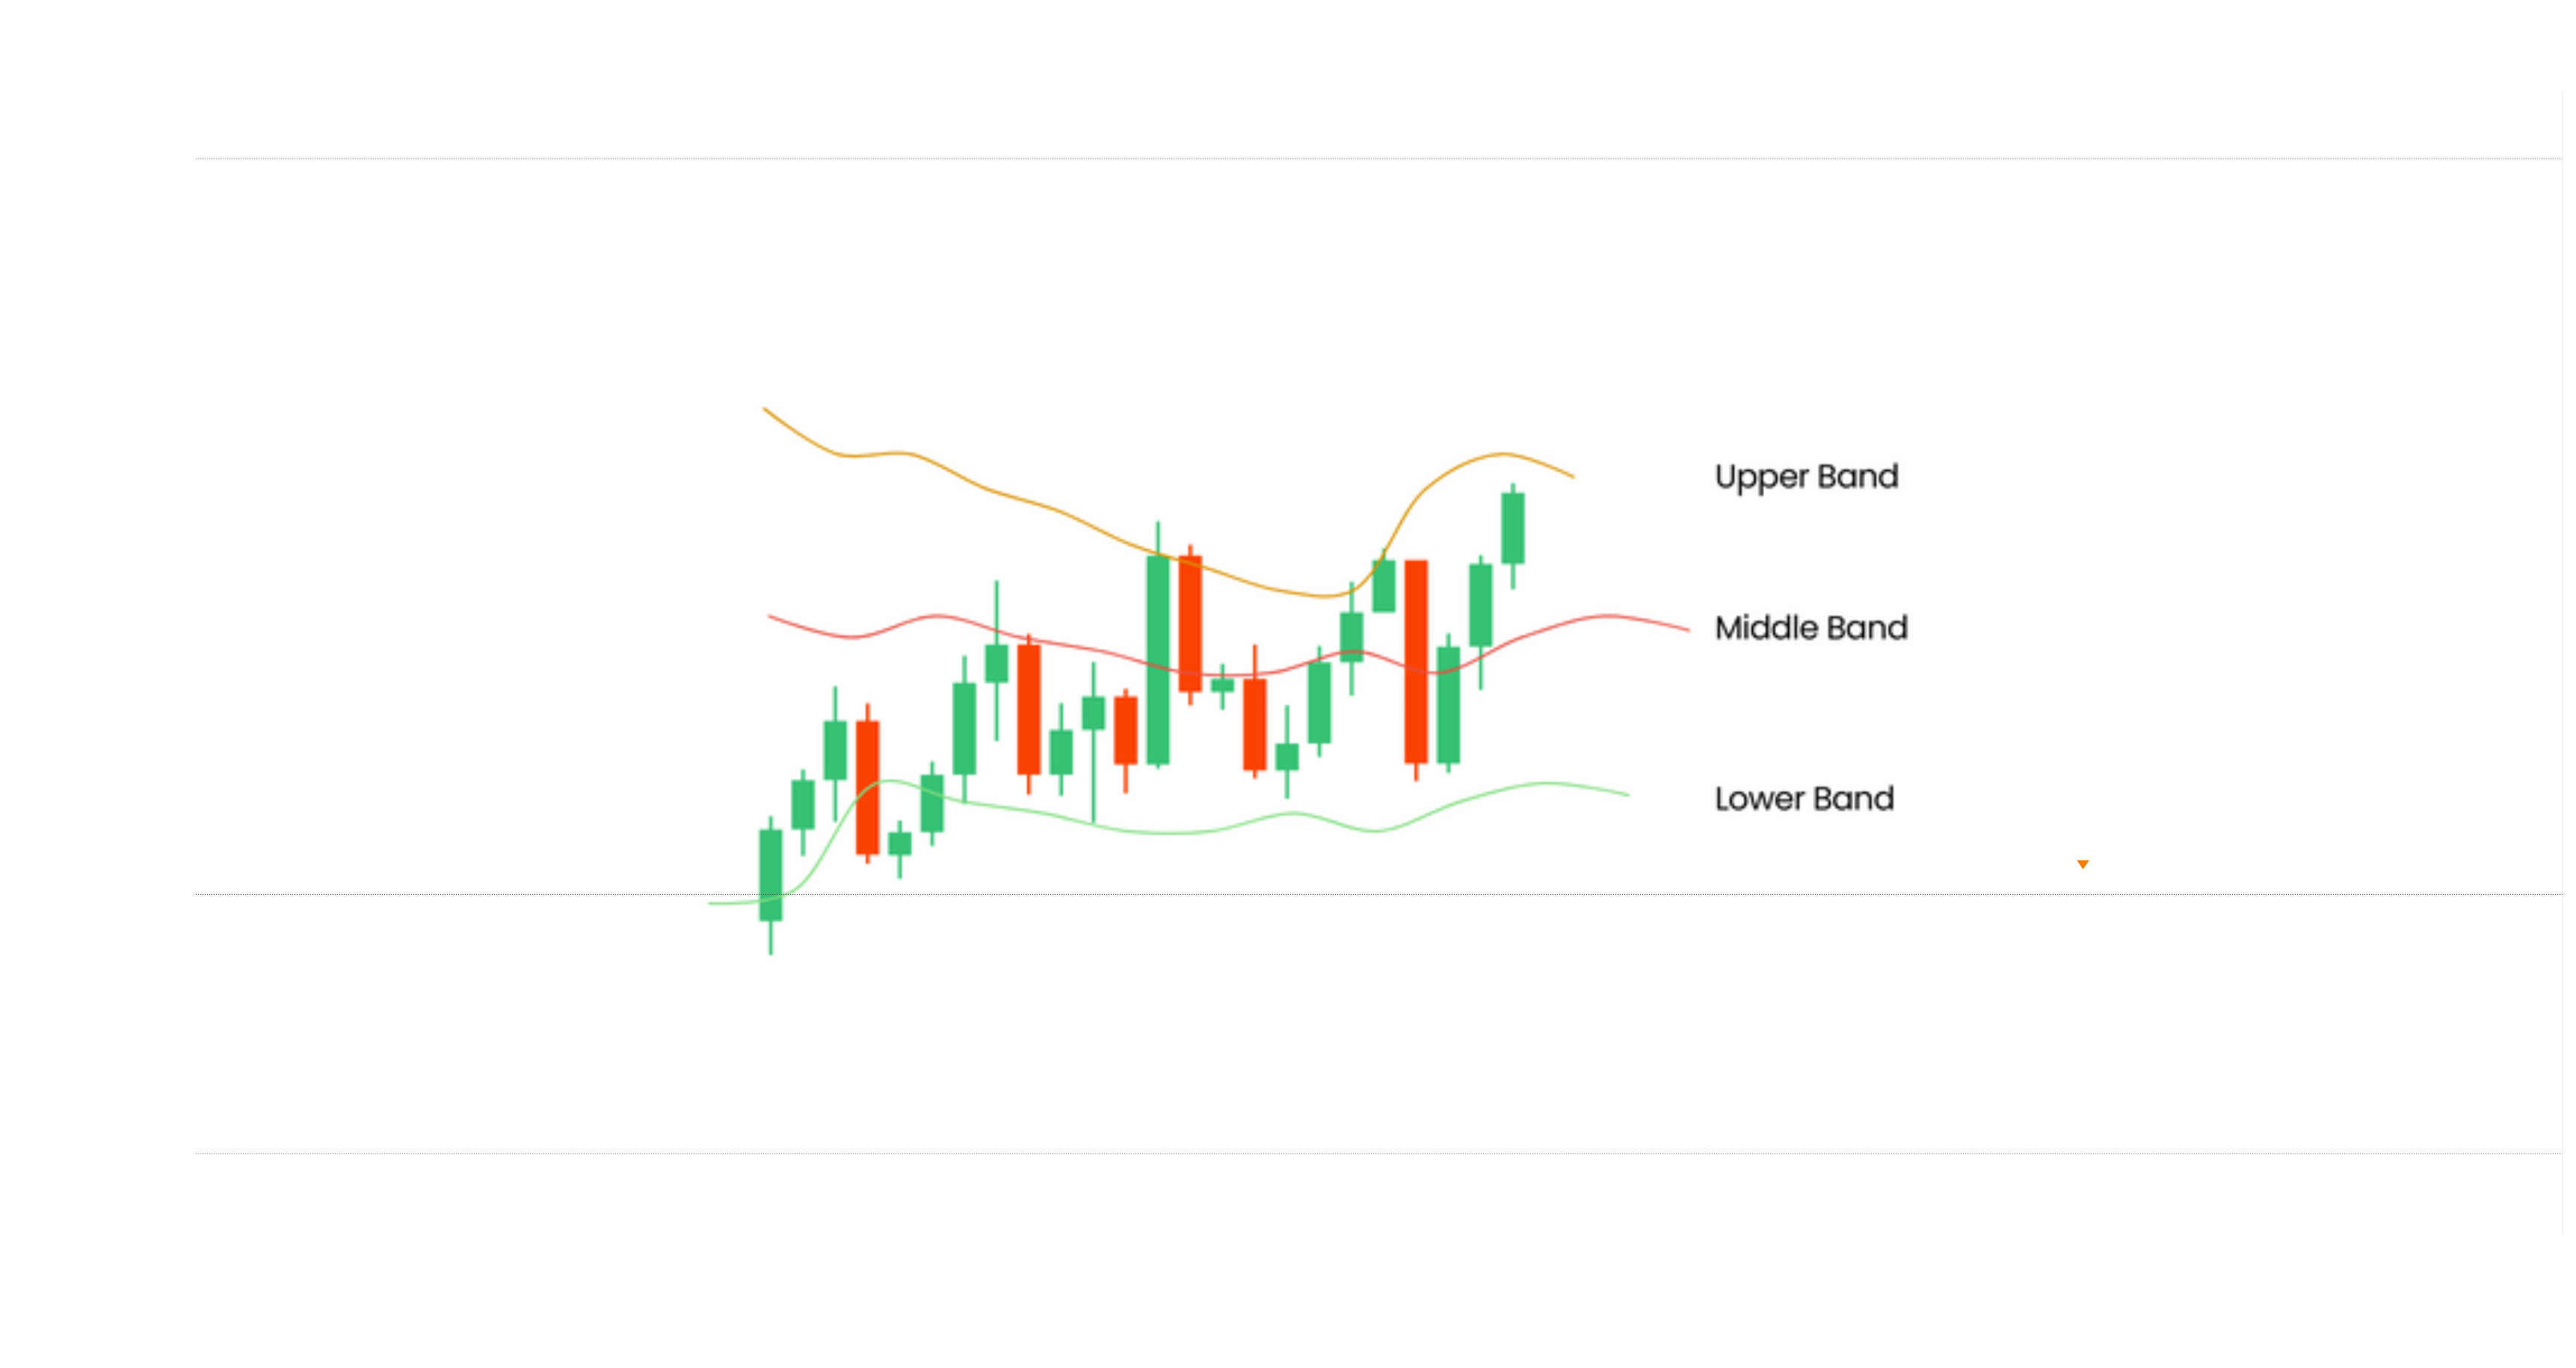
Middle Band (SMA - Simple Moving Average)
- The Middle Band serves as the core baseline, usually set as a 20-period Simple Moving Average (SMA).
- It reflects the average price over the selected period and acts as dynamic support during uptrends or resistance during downtrends.
Upper Band
The Upper Band is calculated as:
Upper Band = Middle Band + (k × σ)
Where:
- $k$ is the standard deviation multiplier (default is set to 2).
- $\sigma$ (sigma) is the standard deviation of closing prices over the selected period.
This band marks statistical resistance. When price approaches or pierces this level, it indicates an overbought market condition relative to the recent moving average.
Lower Band
The Lower Band is calculated as:
Lower Band = Middle Band − (k × σ)
Where:
- $k$ is the standard deviation multiplier (default is set to 2).
- $\sigma$ (sigma) is the standard deviation of closing prices over the selected period.
This band marks statistical support. When price touches or extends past this boundary, it indicates an oversold condition where sellers may be getting exhausted.
3. Role of Standard Deviation in Bollinger Bands
Measuring Volatility
- Standard deviation ($\sigma$) measures how widely price values are spread out from their average (the middle SMA).
- High standard deviation reflects larger price swings and surging market volatility, causing the upper and lower bands to widen significantly.
- Low standard deviation reflects tight price range activity and quiet market conditions, causing the bands to contract.
Adaptive to Market Conditions
- Volatility Expansion: As momentum accelerates and price moves aggressively, the bands widen to accommodate larger price variance.
- Volatility Compression: As trading volume dries up and price consolidates, the bands tighten around the middle moving average, signaling an impending volatility expansion.
Identifying Overbought & Oversold Conditions
Identifying Overbought & Oversold Conditions
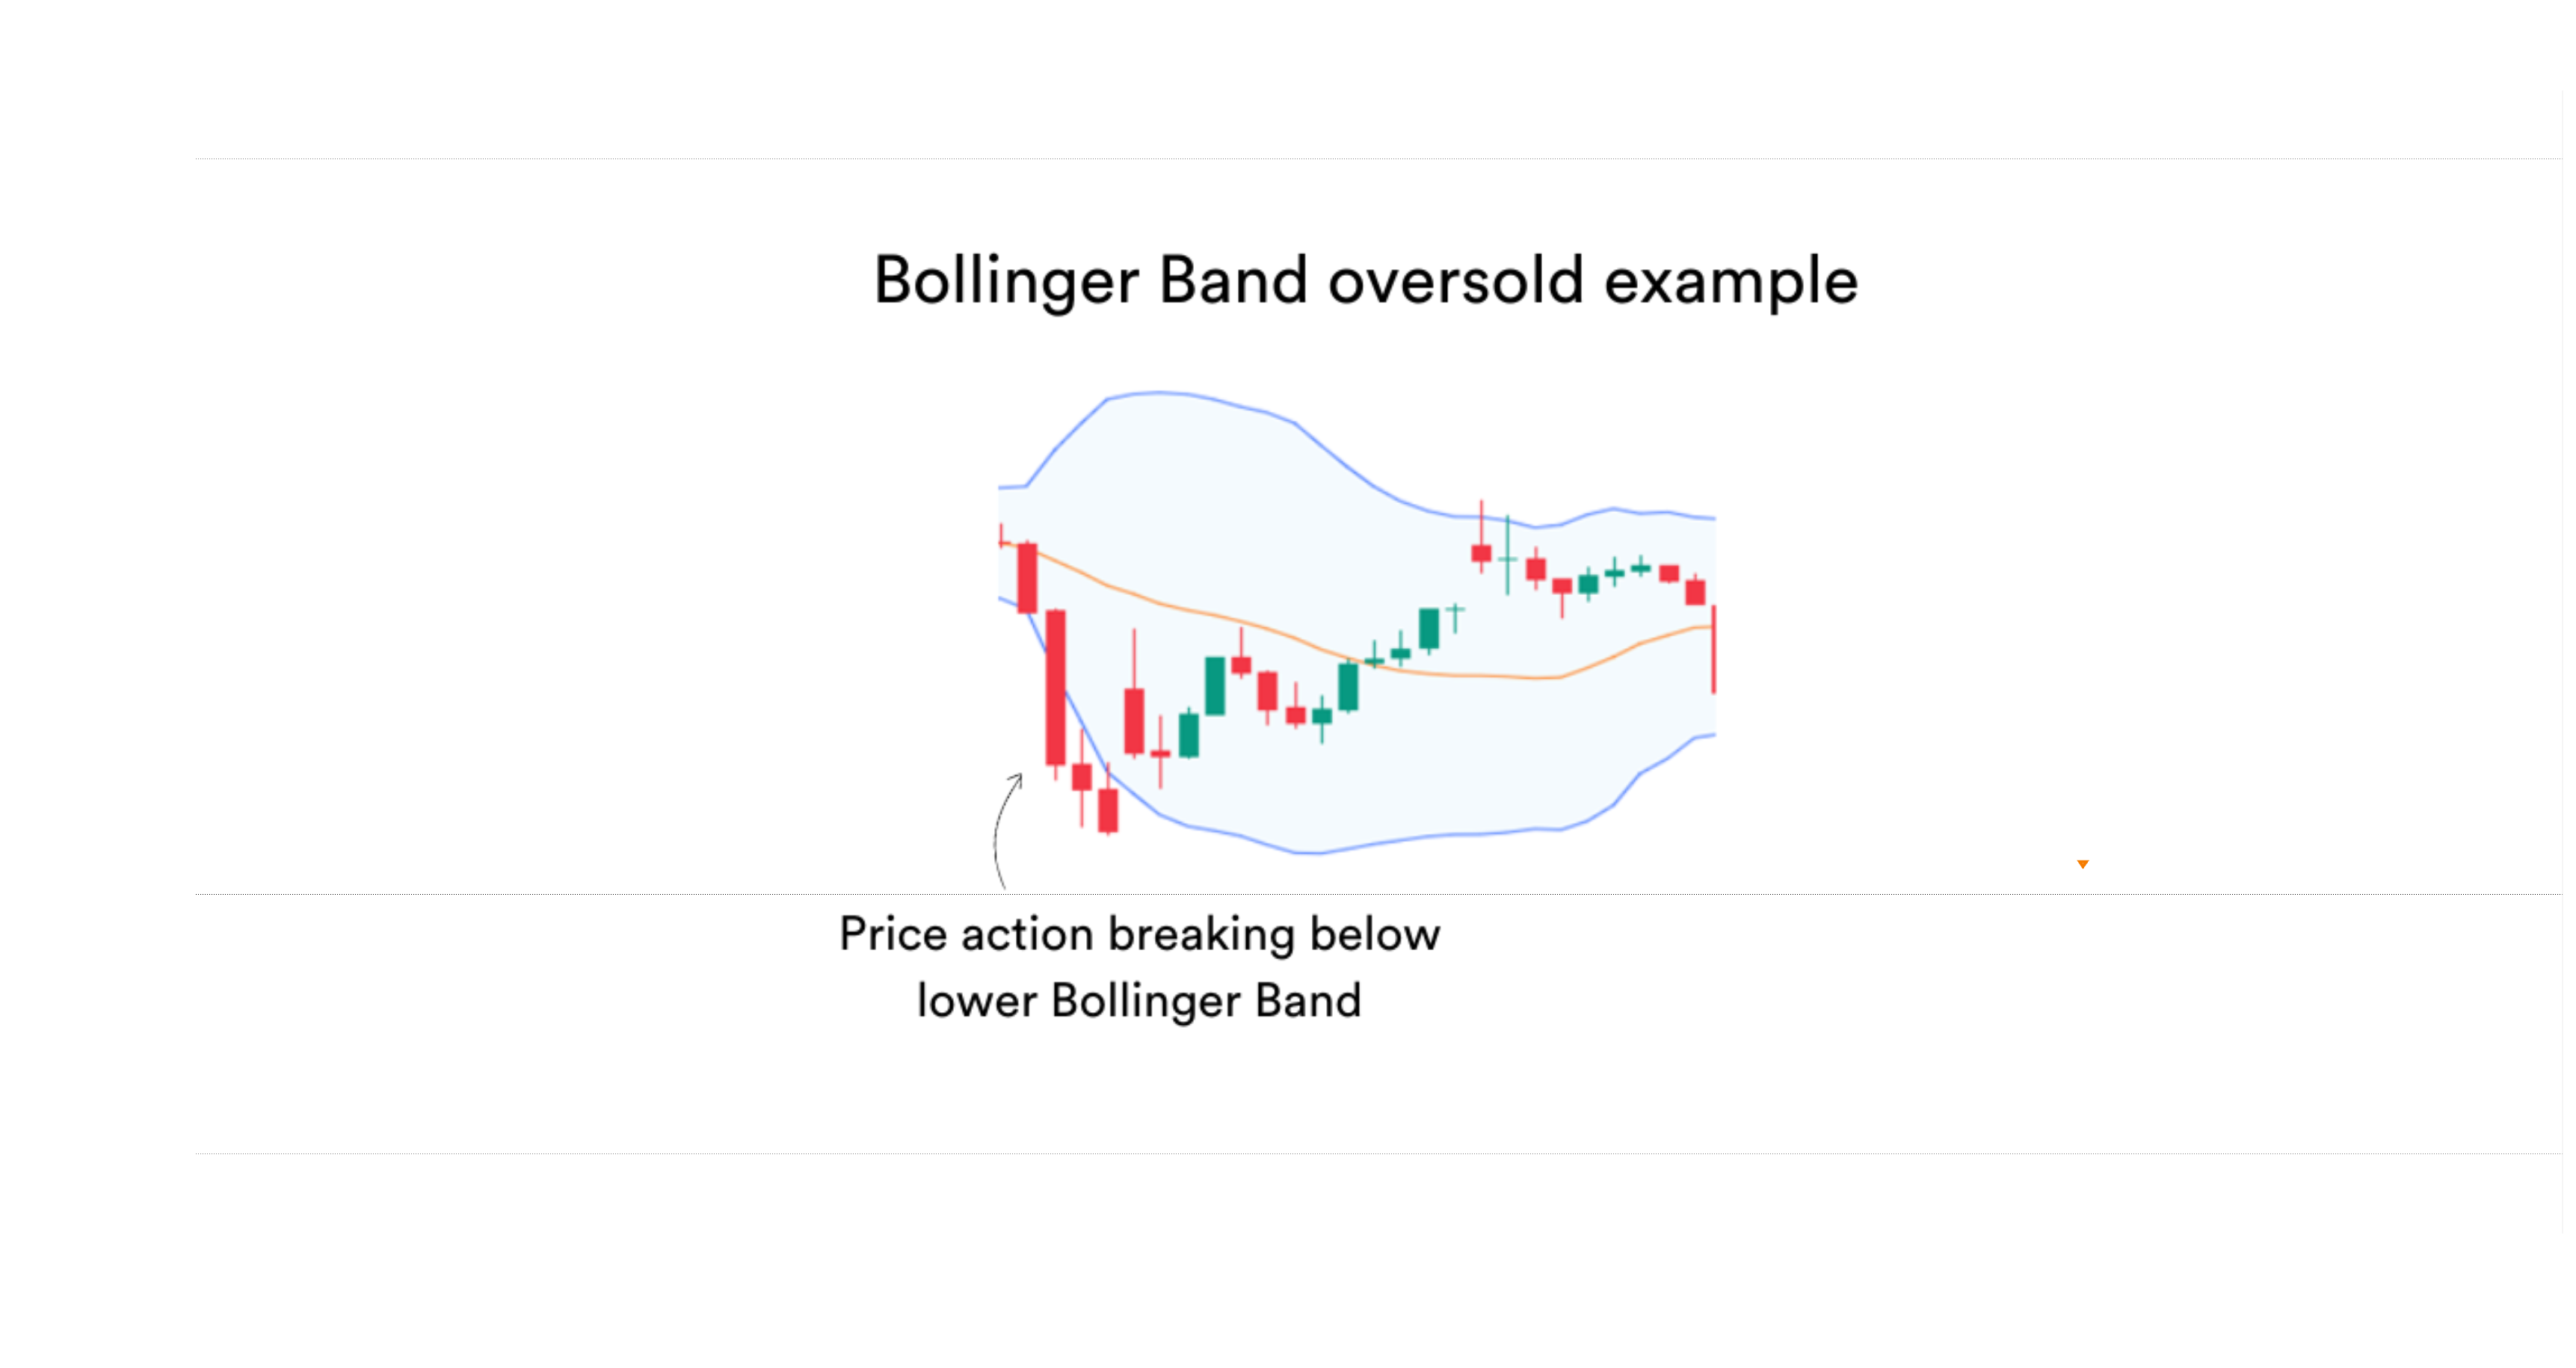
- Upper Band Penetration: Signals that an asset is statistically extended to the upside, which often precedes a healthy pullback or period of consolidation.
- Lower Band Penetration: Indicates that an asset is statistically oversold, often presenting tactical buying opportunities for mean-reversion traders.
- Context is Key: A band touch is a warning signal, not an automatic reversal trigger. In strong trend regimes, price can continuously "walk the band" without turning around immediately.
4. History
1. John Bollinger and the Creation of Bollinger Bands
John Bollinger—a renowned financial analyst, veteran trader, and Chartered Market Technician (CMT)—conceived the indicator in the early 1980s. As the founder of Bollinger Capital Management, he spent decades researching price structure, volatility mechanisms, and quantitative trading frameworks.
2. How Did He Develop Bollinger Bands?
- Before Bollinger's innovation, technical analysts relied heavily on fixed-percentage bands (such as envelope channels plotted at a static percentage above and below a moving average). However, fixed channels failed during market regime shifts because they ignored changing volatility.
- John Bollinger solved this flaw by applying standard deviation directly to price action. His core breakthroughs included:
- Anchoring the indicator to a responsive baseline (the 20-period SMA).
- Setting dynamic upper and lower thresholds calculated by adding and subtracting two standard deviations ($2\sigma$) from the baseline.
- Incorporating adaptive channel widths that naturally adjust to expanding and contracting market volatility.
- Giving traders a robust quantitative framework to anticipate high-probability volatility squeezes, trend continuations, and mean-reversion setups.
5. How Bollinger Bands Work
At their core, Bollinger Bands create a statistical envelope around market price action. Because standard deviation accounts for roughly 95% of price data points occurring within two standard deviations of the mean, price moves outside the bands represent statistically rare events.
The indicator operates across three key parameters:
- Upper Band: Middle Band $+ 2 \times$ Standard Deviation ($2\sigma$).
- Middle Band: 20-period Simple Moving Average (SMA).
- Lower Band: Middle Band $- 2 \times$ Standard Deviation ($2\sigma$).
As market participants push prices rapidly in one direction, volatility increases, pushing the outer bands outward. When the market moves into a quiet balance or range-bound state, volatility drops, causing the bands to contract tightly around price.
6. Bollinger Bands Formula
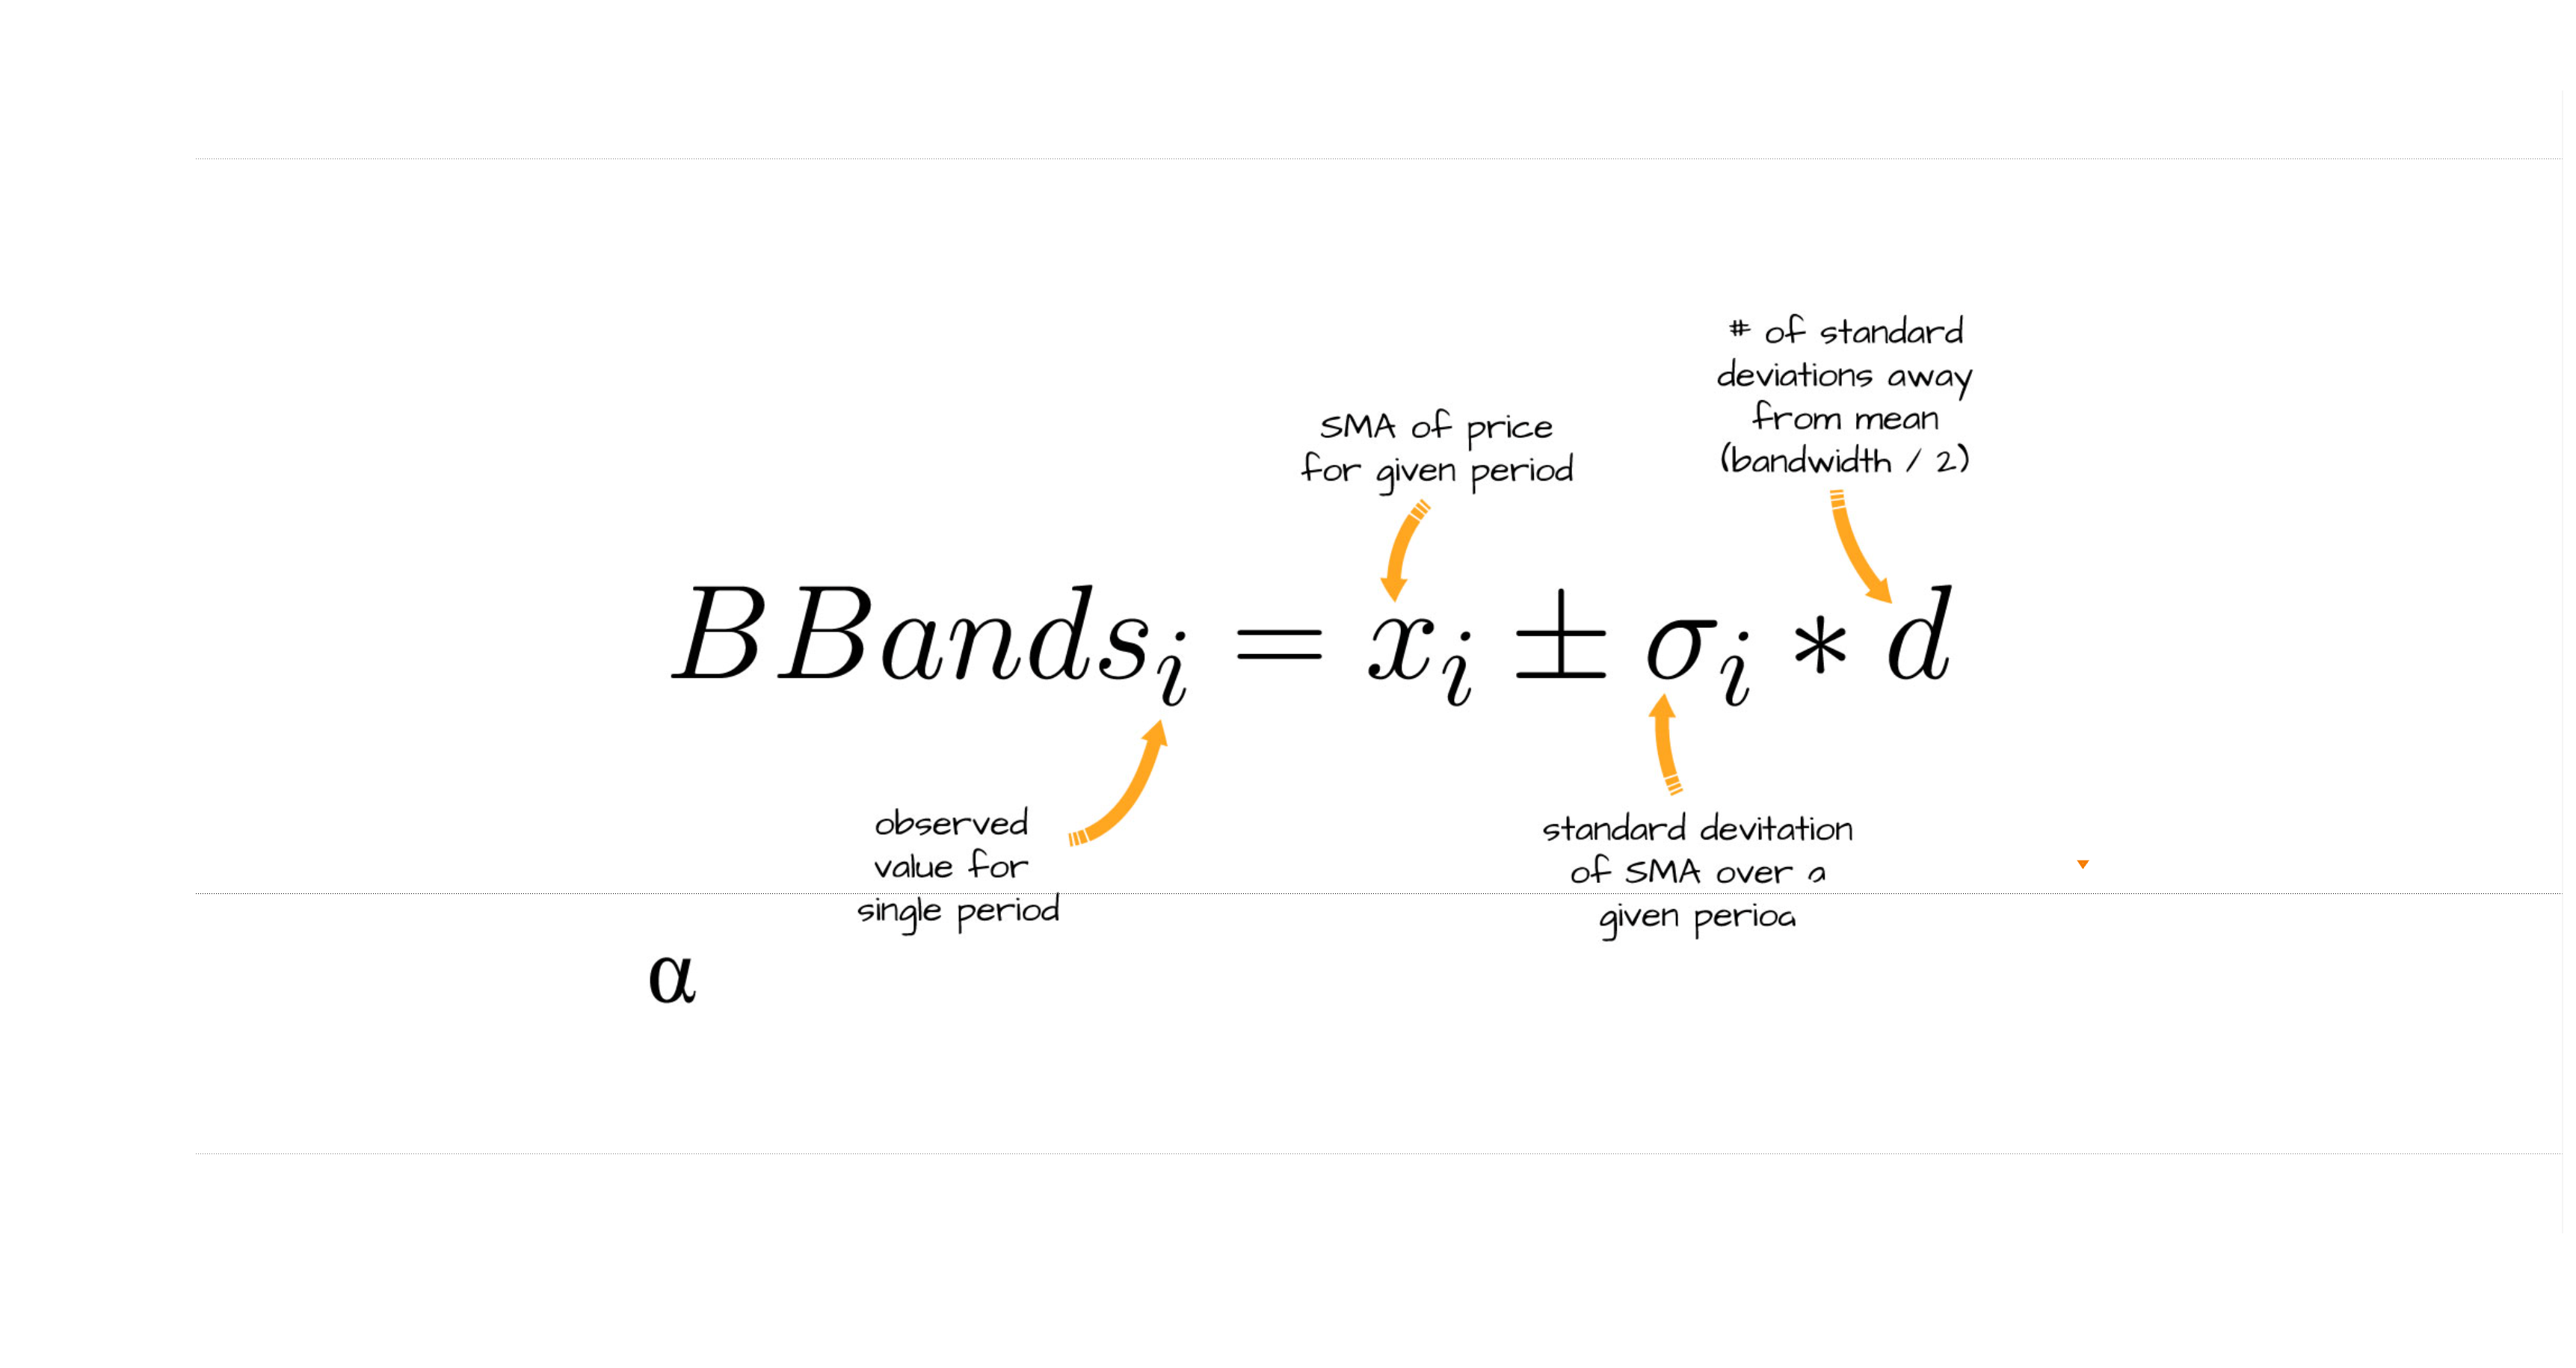
The math behind Bollinger Bands centers on calculating the Simple Moving Average and applying the population standard deviation formula to measure variance over the selected timeframe.
Bollinger Bands Formula
//@version=6
indicator("Bollinger Bands", overlay=true)

// User Inputs
length = input.int(20, minval=1, title="Length")
src = input(close, title="Source")
mult = input.float(2.0, minval=0.001, maxval=50, title="StdDev Multiplier")

// Core Calculations
basis = ta.sma(src, length)
dev = mult * ta.stdev(src, length)
upper = basis + dev
lower = basis - dev

// Plotting Outputs
plot(basis, "Middle Band", color=color.blue)
p1 = plot(upper, "Upper Band", color=color.red)
p2 = plot(lower, "Lower Band", color=color.green)
fill(p1, p2, title="Background", color=color.rgb(33, 150, 243, 95))
7. Interpreting Bollinger Bands
1. Identifying Overbought and Oversold Conditions
Professional traders utilize Bollinger Bands to gauge whether price is trading at an unsustainable extreme relative to its recent average.
- Overbought Conditions: When price pushes above the Upper Band, it reflects an aggressive buying surge. In range-bound markets, this signals an overextended rally ripe for a mean-reversion pullback toward the 20 SMA.
- Oversold Conditions: When price pierces below the Lower Band, heavy selling pressure has stretched price far below value. In non-trending regimes, this often signals seller exhaustion and an imminent bounce.
📌 Pro Tip: A band tag is not an automatic counter-trend signal. In powerful trend regimes, price can repeatedly hug or breach the outer band. Always cross-reference band touches with momentum indicators like RSI, MACD, or market structure before placing an order.
2. Understanding Price Action Near the Bands
Strong Trends
- Bullish Band Walking: When price repeatedly rides along the Upper Band, it confirms powerful institutional buying momentum rather than an immediate reversal setup.
- Bearish Band Walking: When price rides down along the Lower Band, it demonstrates strong downward pressure and trend continuation.
Reversal Signals
- Band Re-Entry Patterns: If price shoots outside an outer band and quickly closes back inside the channel, it points to a false breakout or buyer/seller exhaustion—frequently triggering a swift reversal back toward the middle band.
Mean Reversion
- Reversion to the Mean: Because prices statistically fluctuate around their average, extended moves to either band tend to pull back toward the Middle Band (20 SMA). Range traders leverage this mechanic by executing long trades near the Lower Band and short trades near the Upper Band in non-trending markets.
3. Understanding Market Signals
Support & Resistance
- The middle band functions as dynamic trailing support during an uptrend and dynamic resistance during a downtrend.
Trend Analysis
- Uptrend: Sloping upward middle and upper bands with higher highs and higher lows.
- Downtrend: Sloping downward middle and lower bands with lower lows and lower highs.
- Consolidation: Horizontal, flat bands indicating market equilibrium before the next expansion phase.
Compression & Expansion
- Compression (Bands Tighten) → Breakout: Indicates low historical volatility before an explosive breakout.
- Expansion (Bands Widen) → Trend Continuation: Confirms surging volatility increase and trend continuation.
8. Strategies
1. Squeeze Strategy
The Bollinger Band Squeeze is one of the most reliable volatility breakout strategies in technical analysis. Volatility is cyclical: periods of extreme compression are consistently followed by periods of rapid expansion.
Bollinger Band Squeeze Strategy
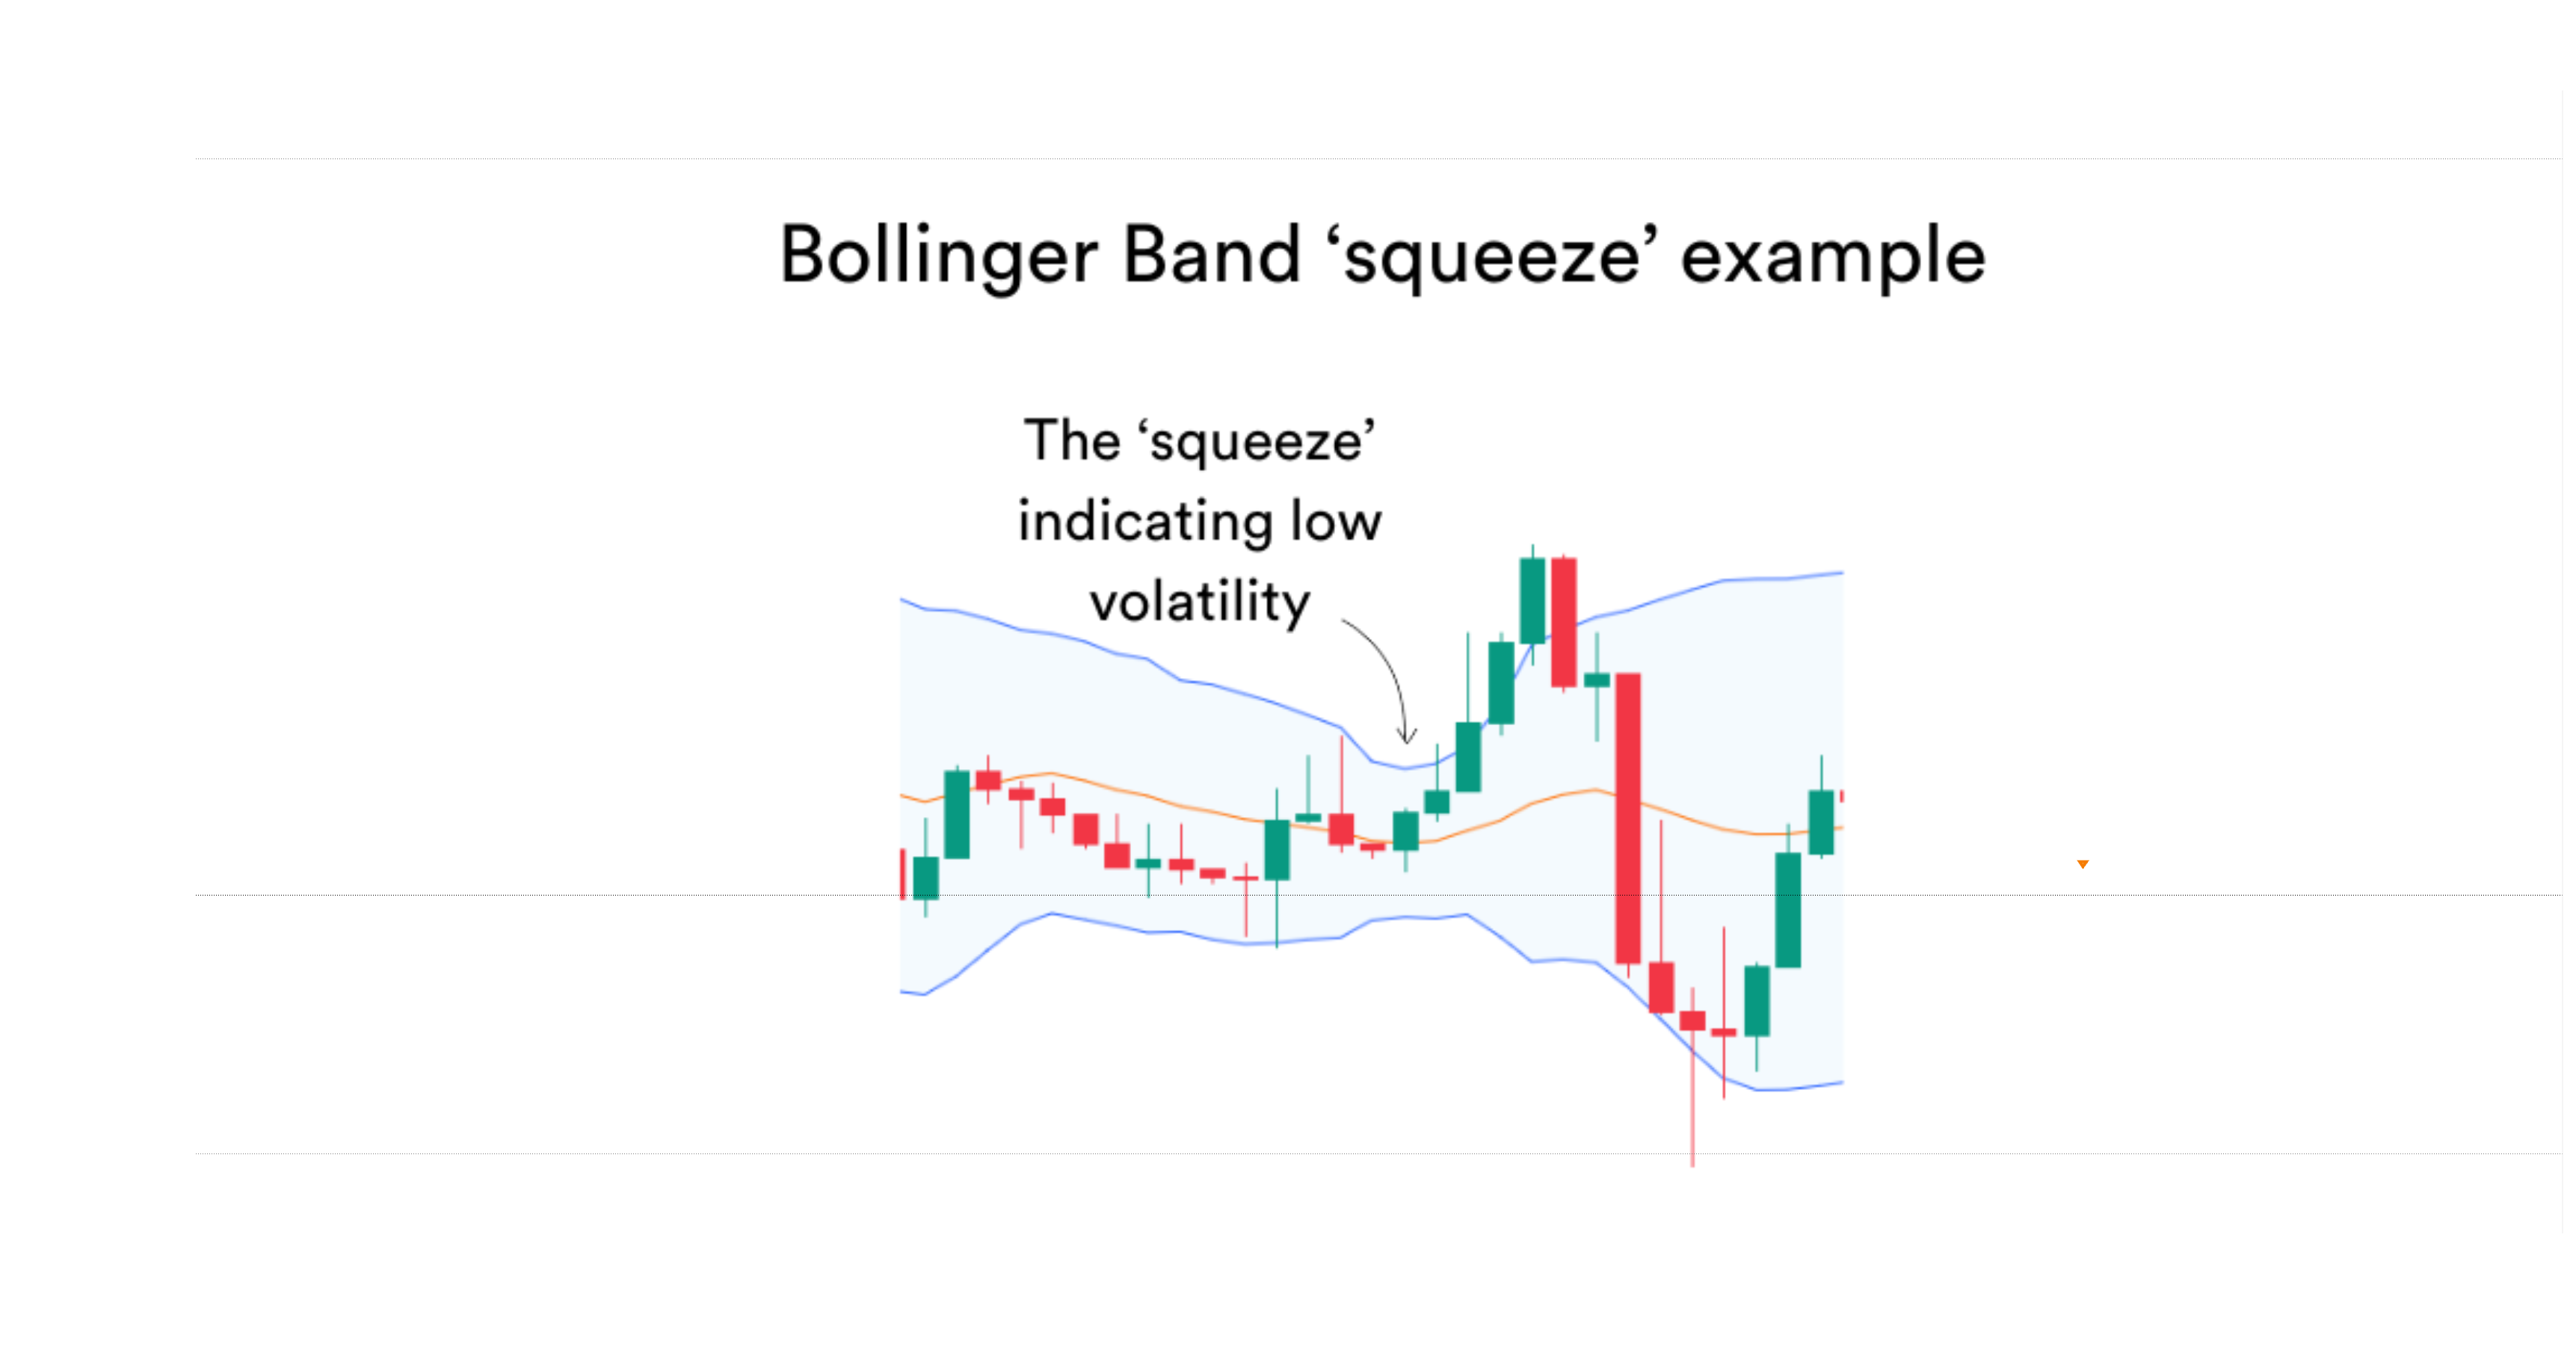
- The squeeze occurs when the bands contract tightly, signaling low historical volatility.
- This setup warns that a major breakout is building, though directional confirmation requires price action validation.
How to Trade the Squeeze
- Identify the Compression: Locate a chart pattern where the upper and lower bands contract to their narrowest width after a period of expansion.
- Await the Momentum Trigger: Do not guess the direction during compression. Wait for a decisive candle close above the Upper Band or below the Lower Band.
- Execute on Breakout: Enter a trade in the direction of the breakout as the bands begin to flare outward.
- Confirm with Volume & Momentum: Cross-check the move with indicators like RSI or MACD to filter out false breakouts.
- Risk Management: Place your stop-loss order near recent price consolidation areas or just behind the middle 20 SMA.
📌 Example:
- If price breaks cleanly above the Upper Band, enter a long position (buy).
- If price breaks cleanly below the Lower Band, enter a short position (sell).
✅ Best for: Trending markets, momentum traders, breakout traders.
2. Breakout Strategy
Unlike mean-reversion setups that fade band touches, the Bollinger Band Breakout Strategy embraces strong momentum, aiming to ride powerful directional trends as price expands beyond statistical boundaries.
Bollinger Band Breakout Strategy
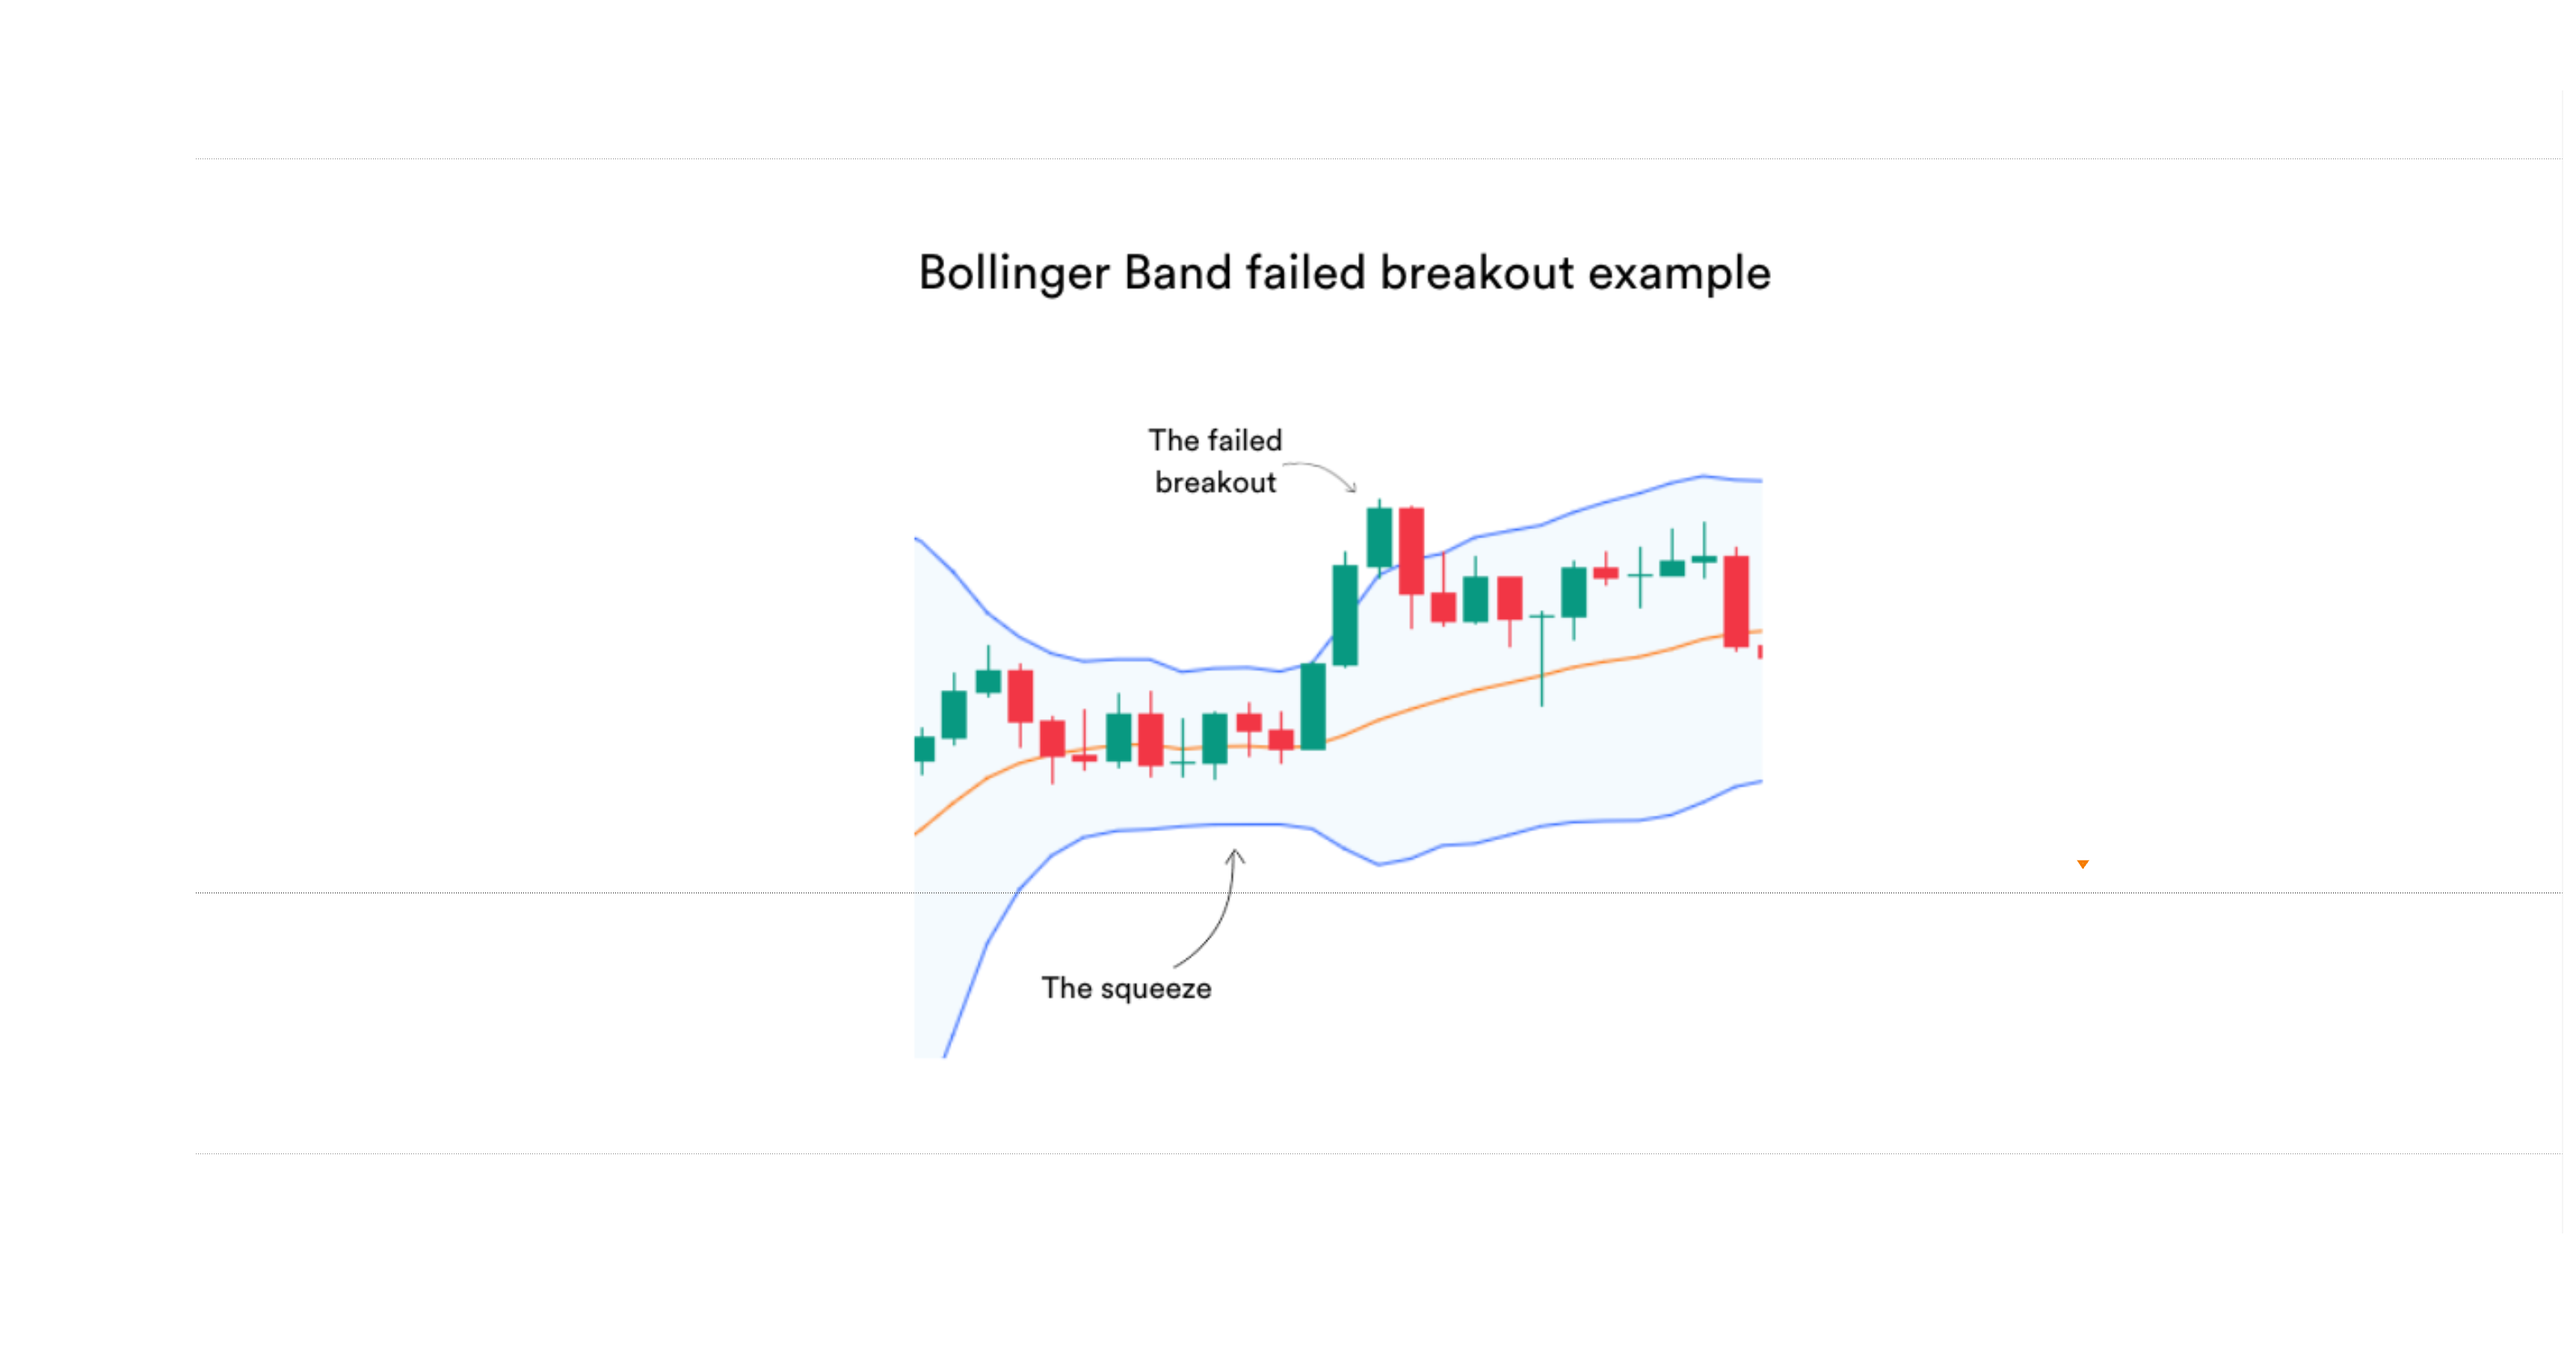
- A breakout occurs when price moves outside the bands with strong volume, signaling trend continuation.
- Traders use this opportunity to ride powerful trends rather than fading them.
How to Trade the Breakout
- Wait for a Confirmed Outer Close: Look for price to close outside the Bollinger Bands (not just touch or wick them).
- Validate Directional Momentum: Enter a trade in the direction of the breakout after confirming with volume or a momentum oscillator.
- Set Dynamic Risk Boundaries: Place a stop-loss near the Middle Band (20 SMA) or recent swing high/low.
- Manage Trade Exit: Exit the trade when price starts consolidating or shows an explicit structural reversal pattern.
📌 Example:
- If a security closes above the Upper Band with strong volume, enter a long trade.
- If a security closes below the Lower Band with strong volume, enter a short trade.
✅ Best for: Trend-following traders, breakout traders, high-momentum markets.
9. Key Takeaways
- Indicator structure: Composed of three core lines — a 20-period SMA middle baseline flanked by upper ($+2\sigma$) and lower ($-2\sigma$) standard deviation channels.
- Volatility measurement: Bands automatically widen during high market volatility and compress during low volatility consolidation phases.
- Trend direction: The middle band acts as dynamic trend support/resistance; prices consistently holding above the middle band confirm bullish control, while prices below confirm bearish control.
- Dynamic boundaries: Upper and lower bands function as statistical resistance and support points, framing potential overbought and oversold zones.
- Mean reversion mechanic: In ranging or non-trending markets, price naturally pulls back toward the 20-period middle moving average after touching outer bands.
- Confluence is essential: Maximize win rates by combining Bollinger Bands with momentum tools (RSI, MACD) and volume indicators for multi-factor confirmation.