Candle Range Theory, also known as CRT, is a sophisticated price action concept that allows traders to understand the internal structure of any given candlestick. While most traders see a single candle as a single "unit" of price action, CRT views each candle as its own mini-market cycle.
Candle Range Theory (CRT)
By breaking down a candle into its Accumulation, Manipulation, and Distribution (AMD) phases, you can identify high-probability entries at the "wick" of a higher-timeframe candle before it even forms.
1. Core Principles: The Anatomy of a Candle Range
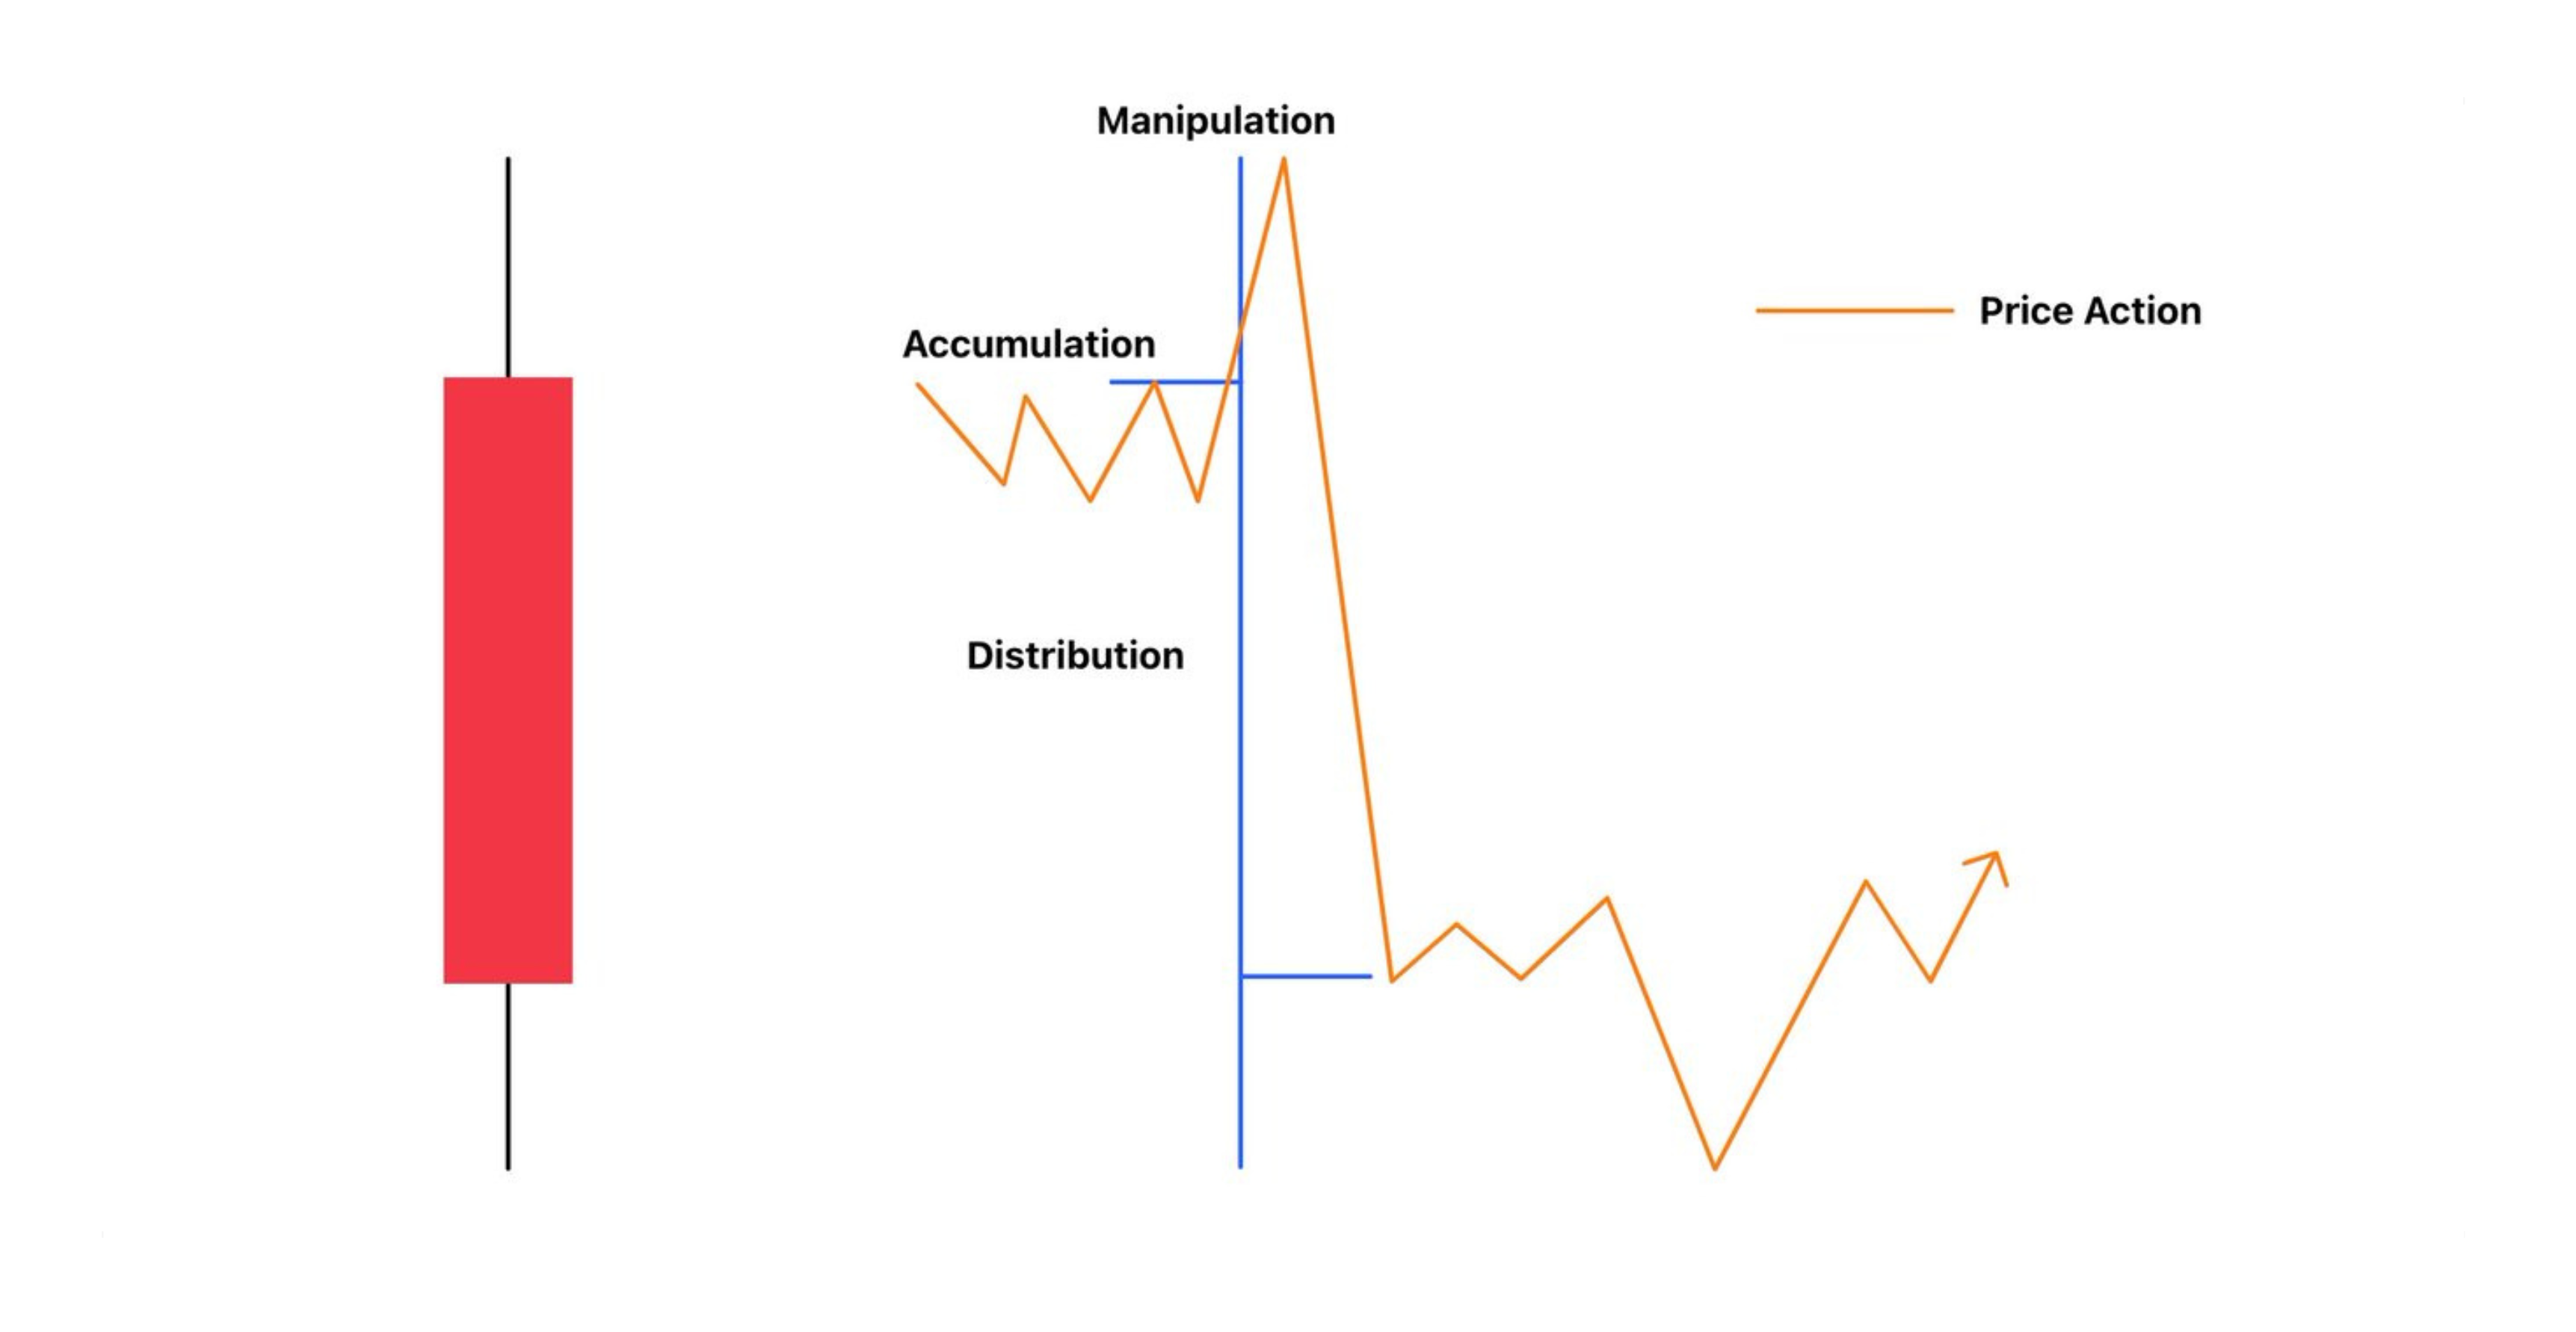
CRT is based on the idea that every candle follows a specific institutional "Power of Three" (Po3) cycle:
- Accumulation: Near the candle's open, price consolidates as orders are built up.
- Manipulation: Price is pushed beyond the open, usually to the "opposite" direction of the intended move, to trap retail traders (creating the wick).
- Distribution: Price reverses and expands toward the final destination, creating the "body" of the candle and eventually closing.
Power Of Three (AMD)
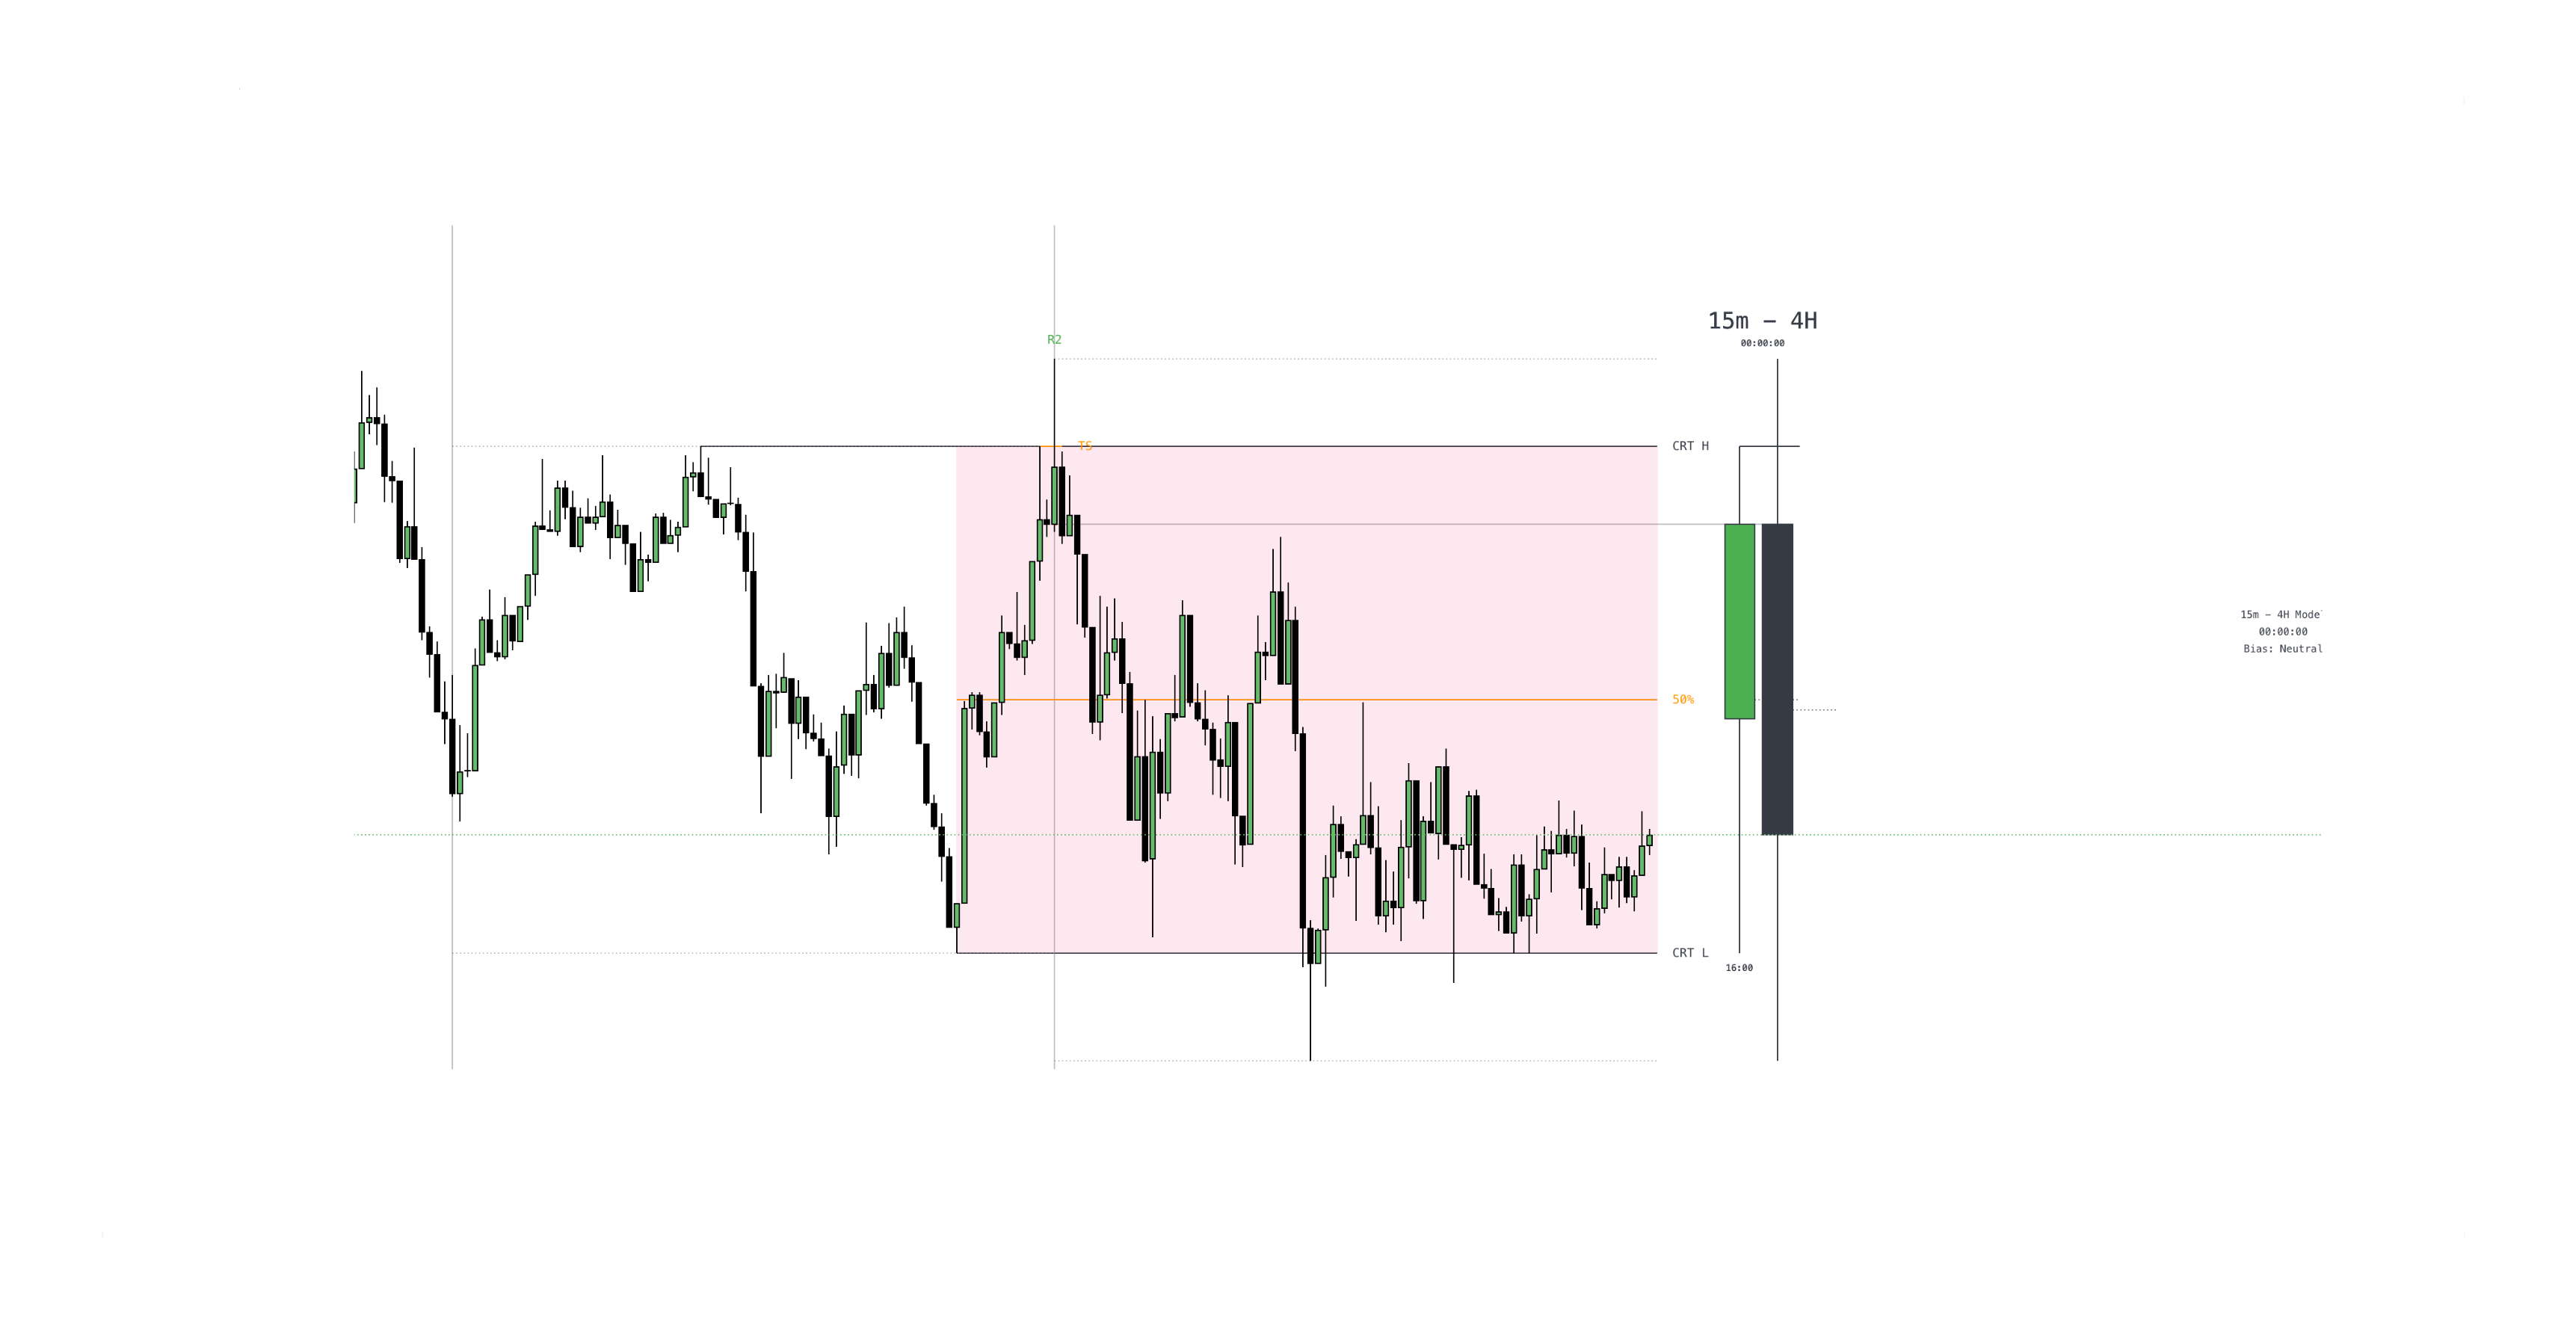
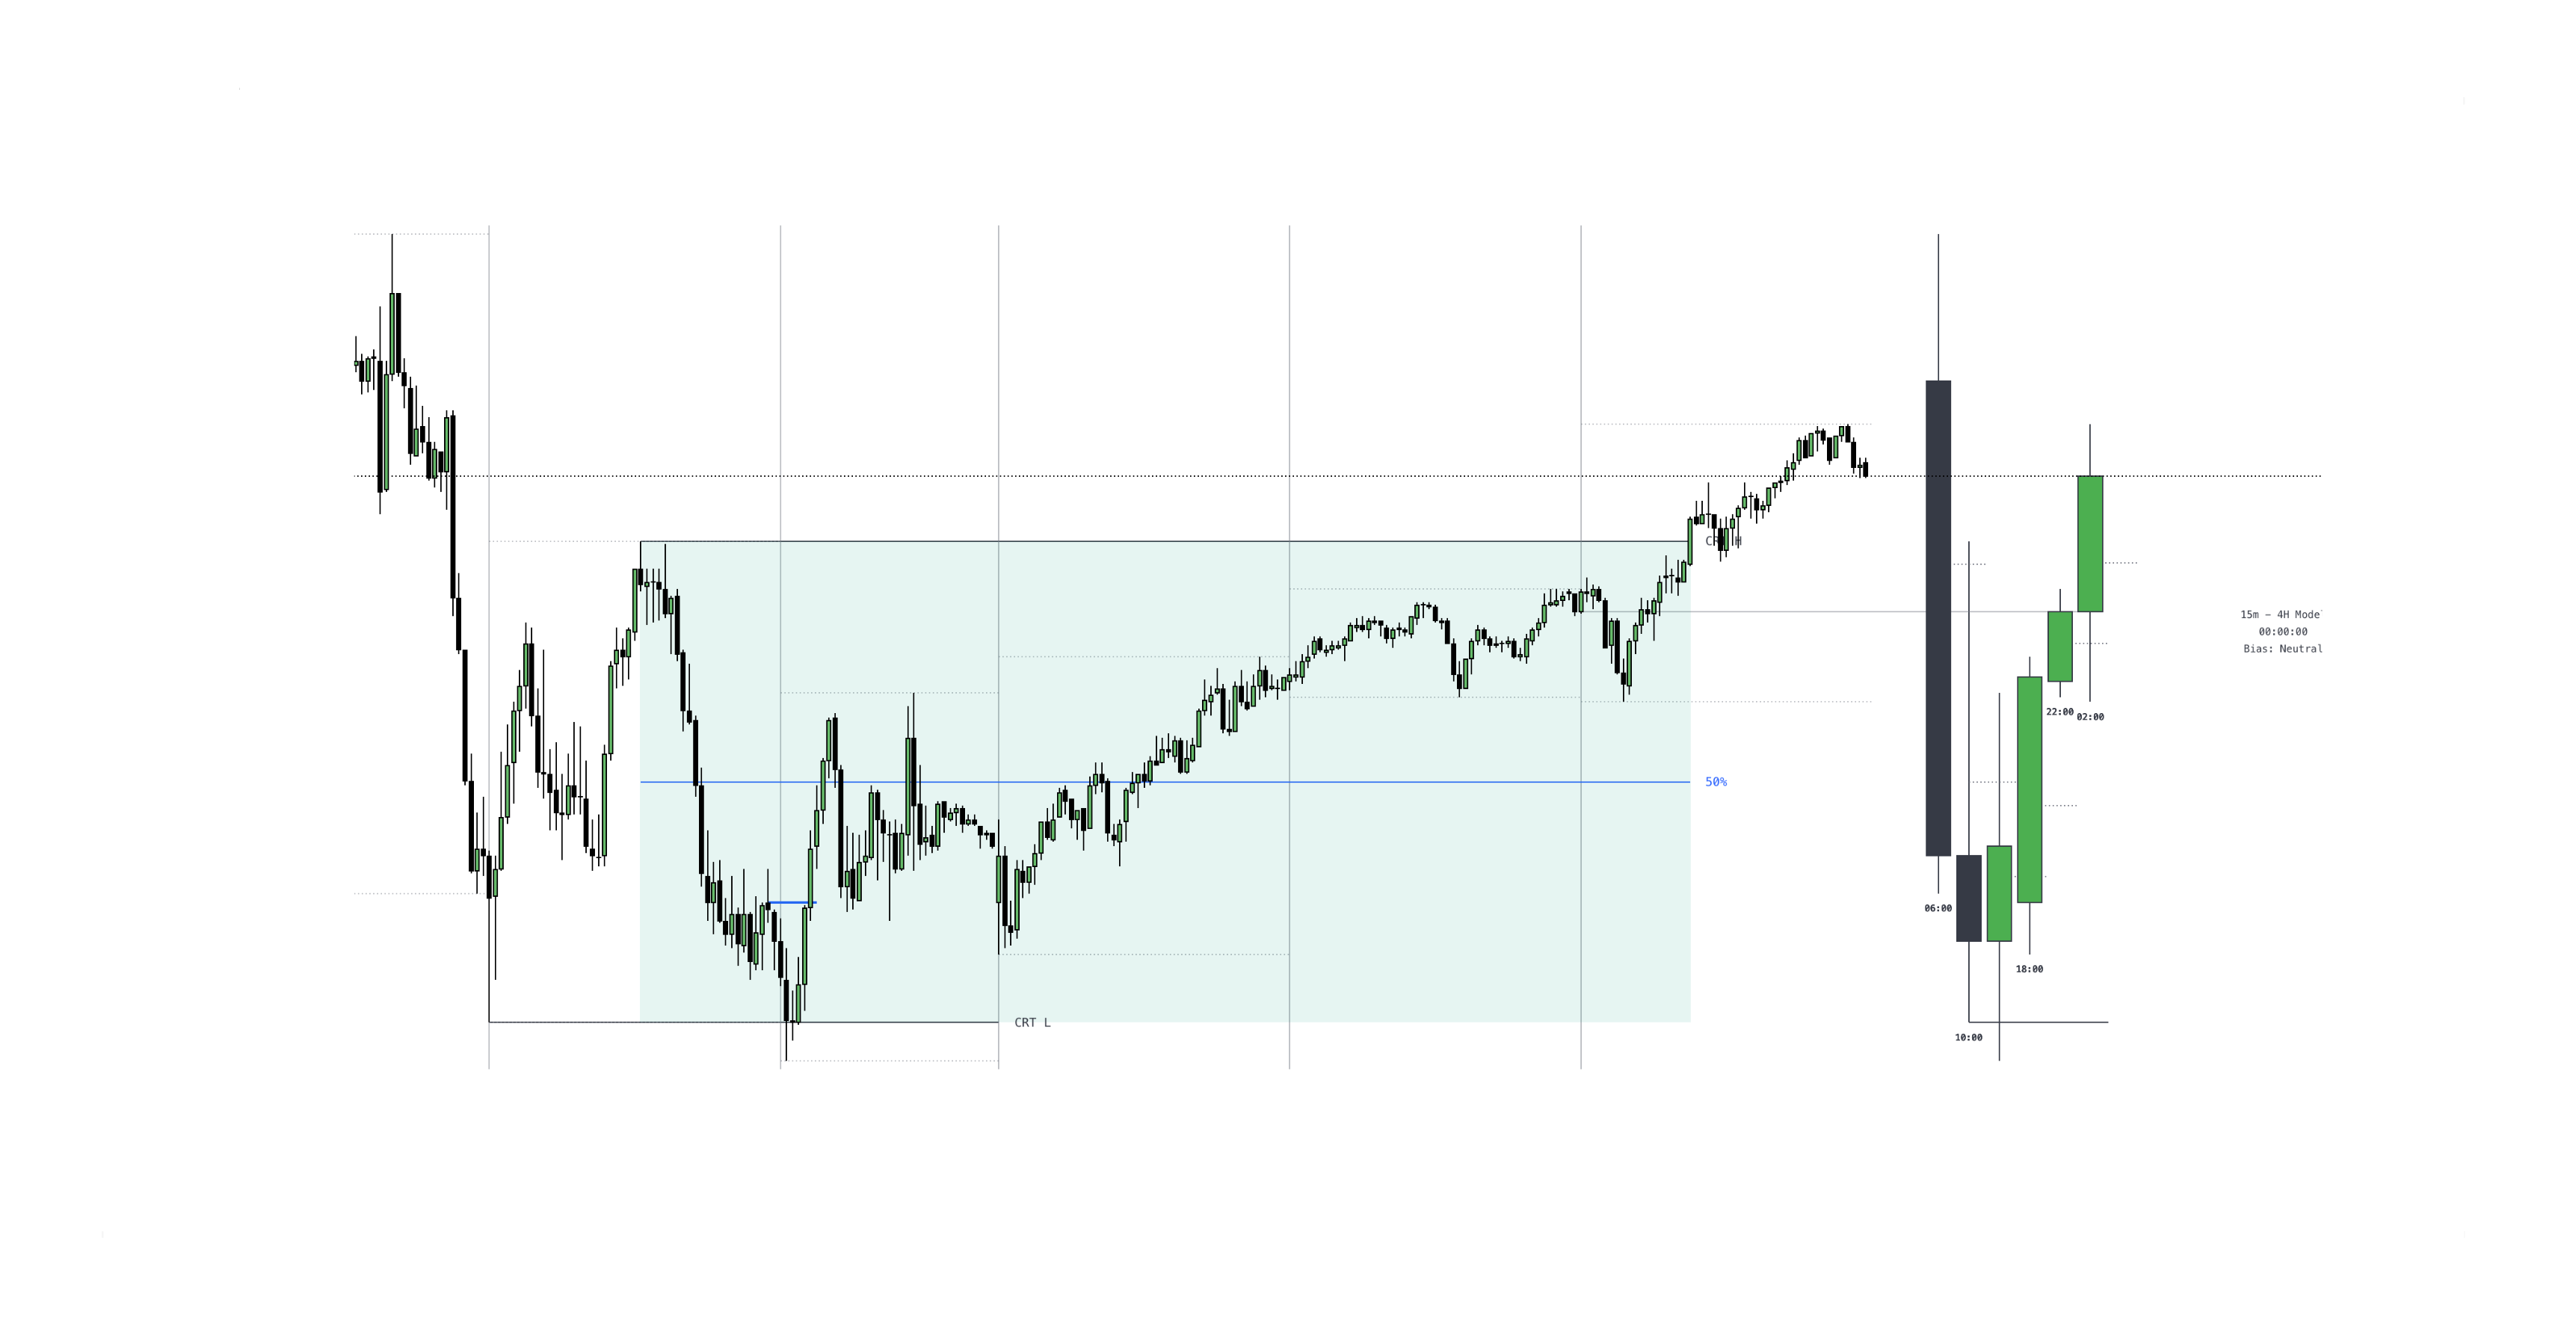
In CRT, we call the high and low of a candle the CRT-High and CRT-Low. These levels are key liquidity zones for the next candle, with the 50% (Mean) of the range acting as a primary target for distribution or mean-reversion.
2. Timeframe Alignment: The Fractal View
Timeframe Alignment
CRT relies on specific pairings between higher and lower timeframes to identify setups.
Recommended Timeframe Pairings
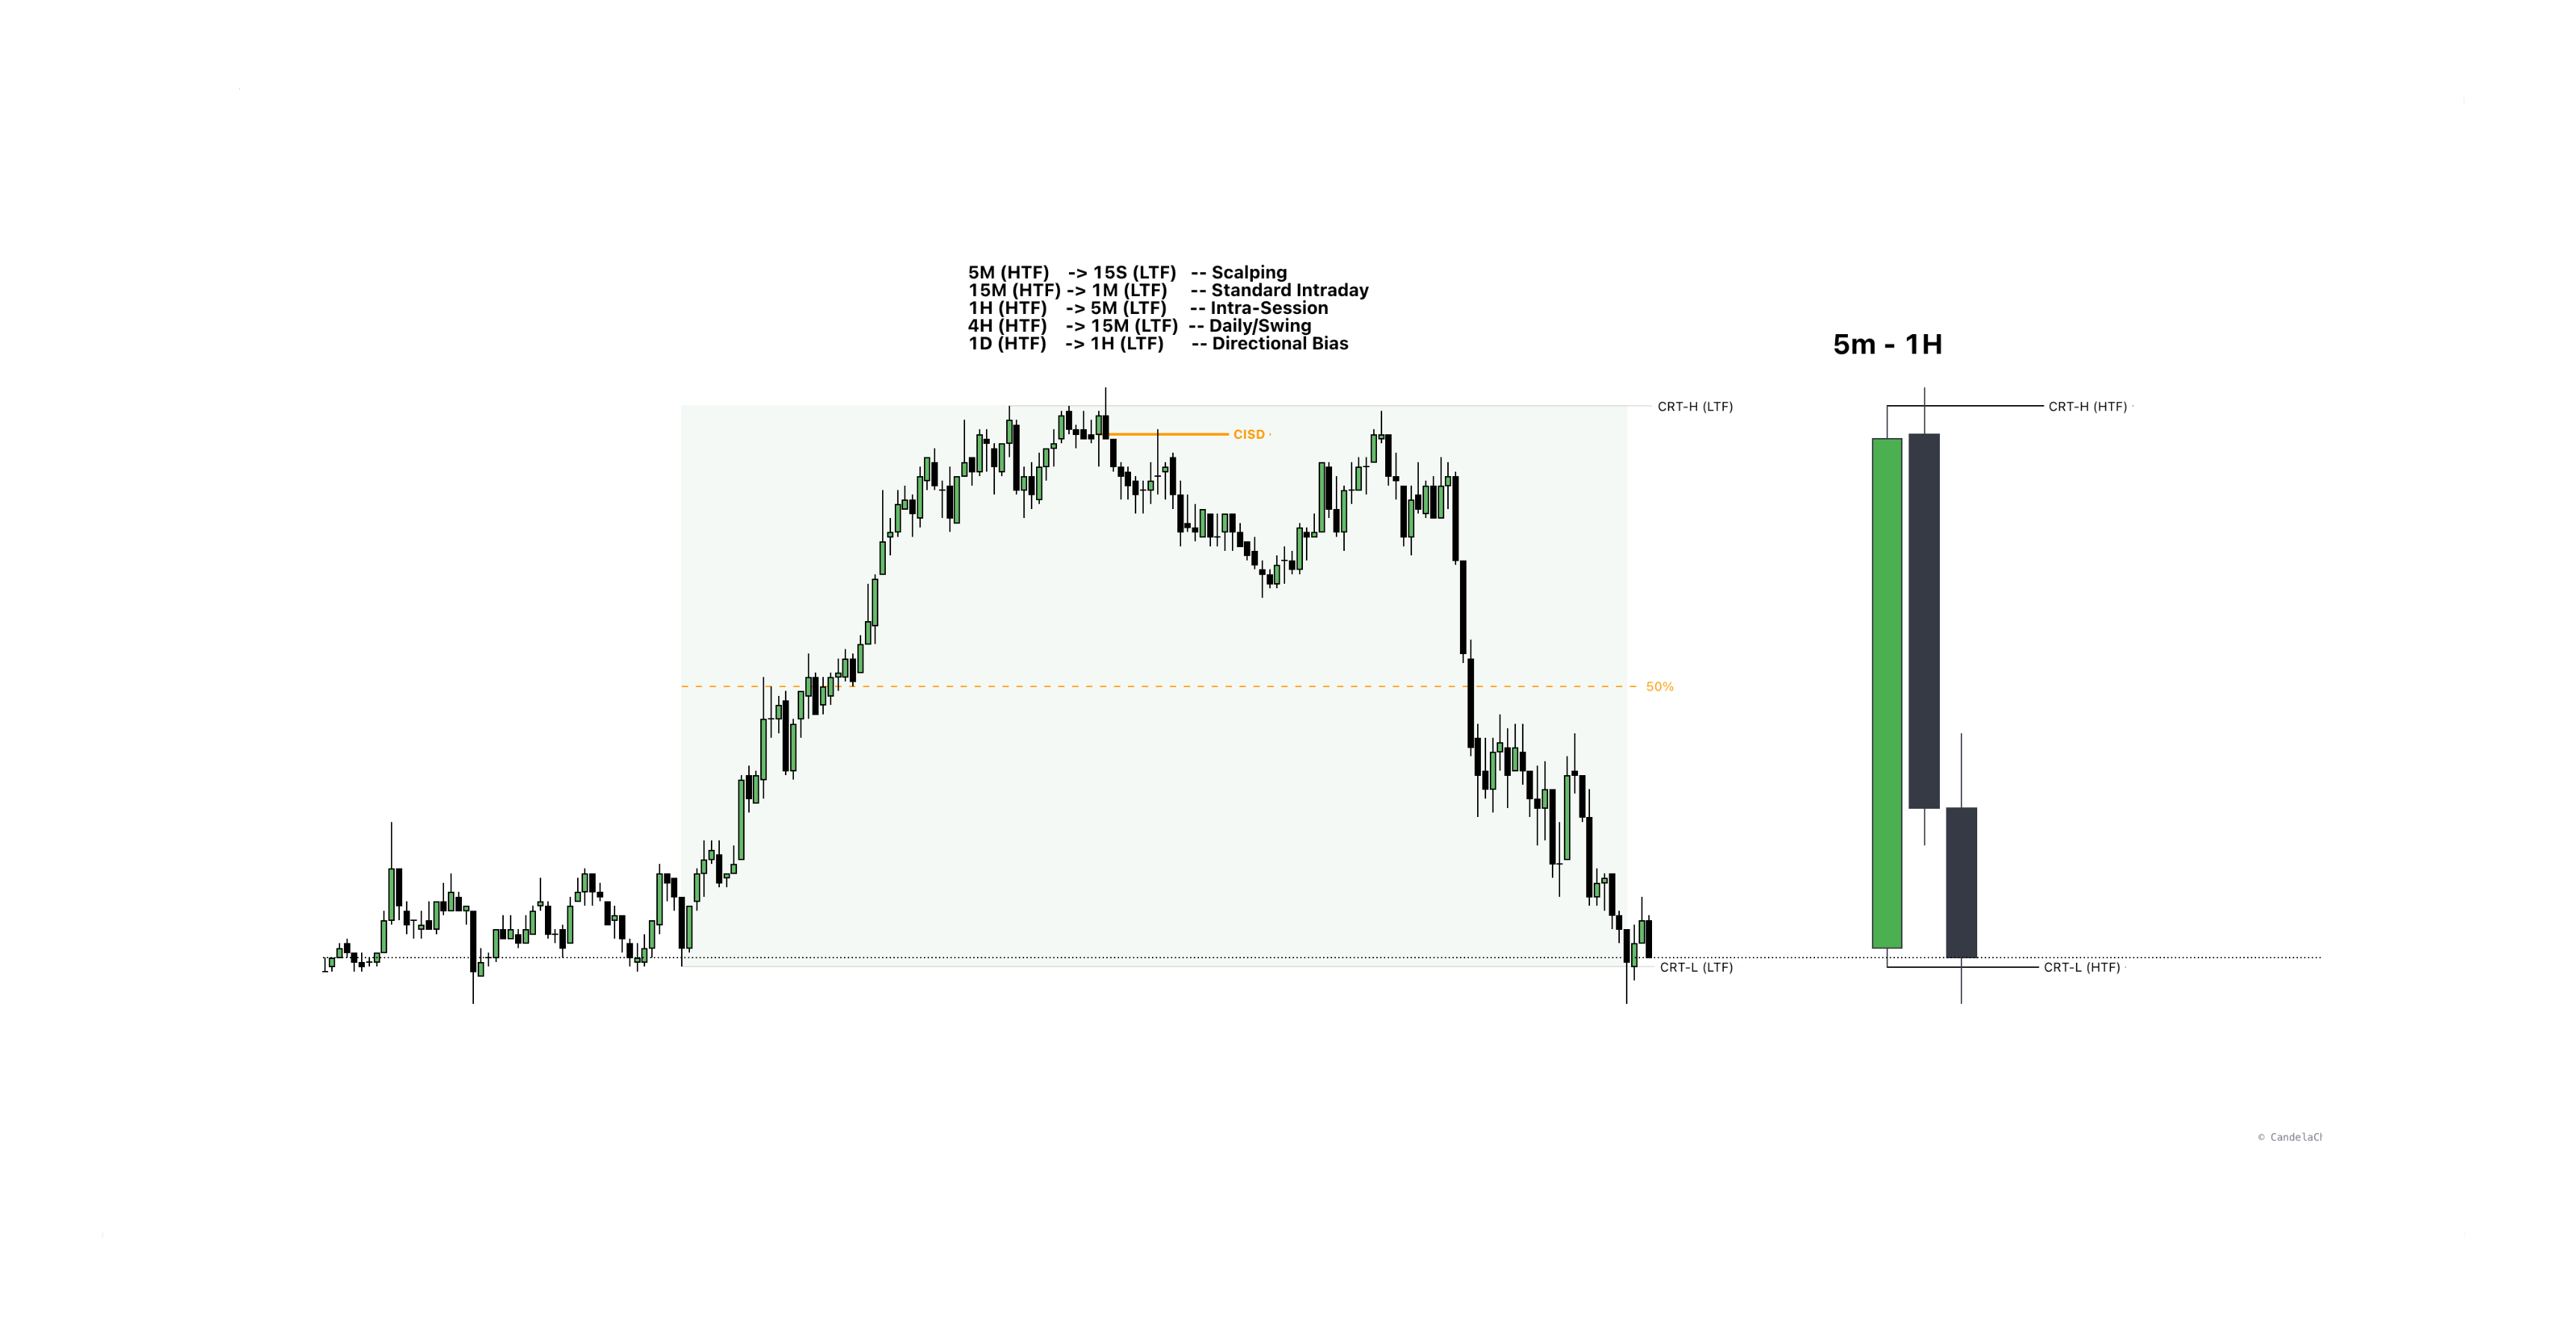
- 5 Minute (HTF) → 15 Second (LTF) — Scalping / Micro-Entries
- 15 Minute (HTF) → 1 Minute (LTF) — Standard Intraday CRT
- 1 Hour (HTF) → 5 Minute (LTF) — Intra-Session Trading
- 4 Hour (HTF) → 15 Minute (LTF) — Day Trading / Swing
- Daily (HTF) → 1 Hour (LTF) — Directional Bias
- Weekly (HTF) → 4 Hour (LTF) — Swing Trading / Weekly Range Bias
- Monthly (HTF) → Daily (LTF) — Position Trading / Long-Term Bias
3. CRT Workflow: Top-Down Analysis
This workflow ensures your bias, plan, and entries are always synchronized across all timeframes.
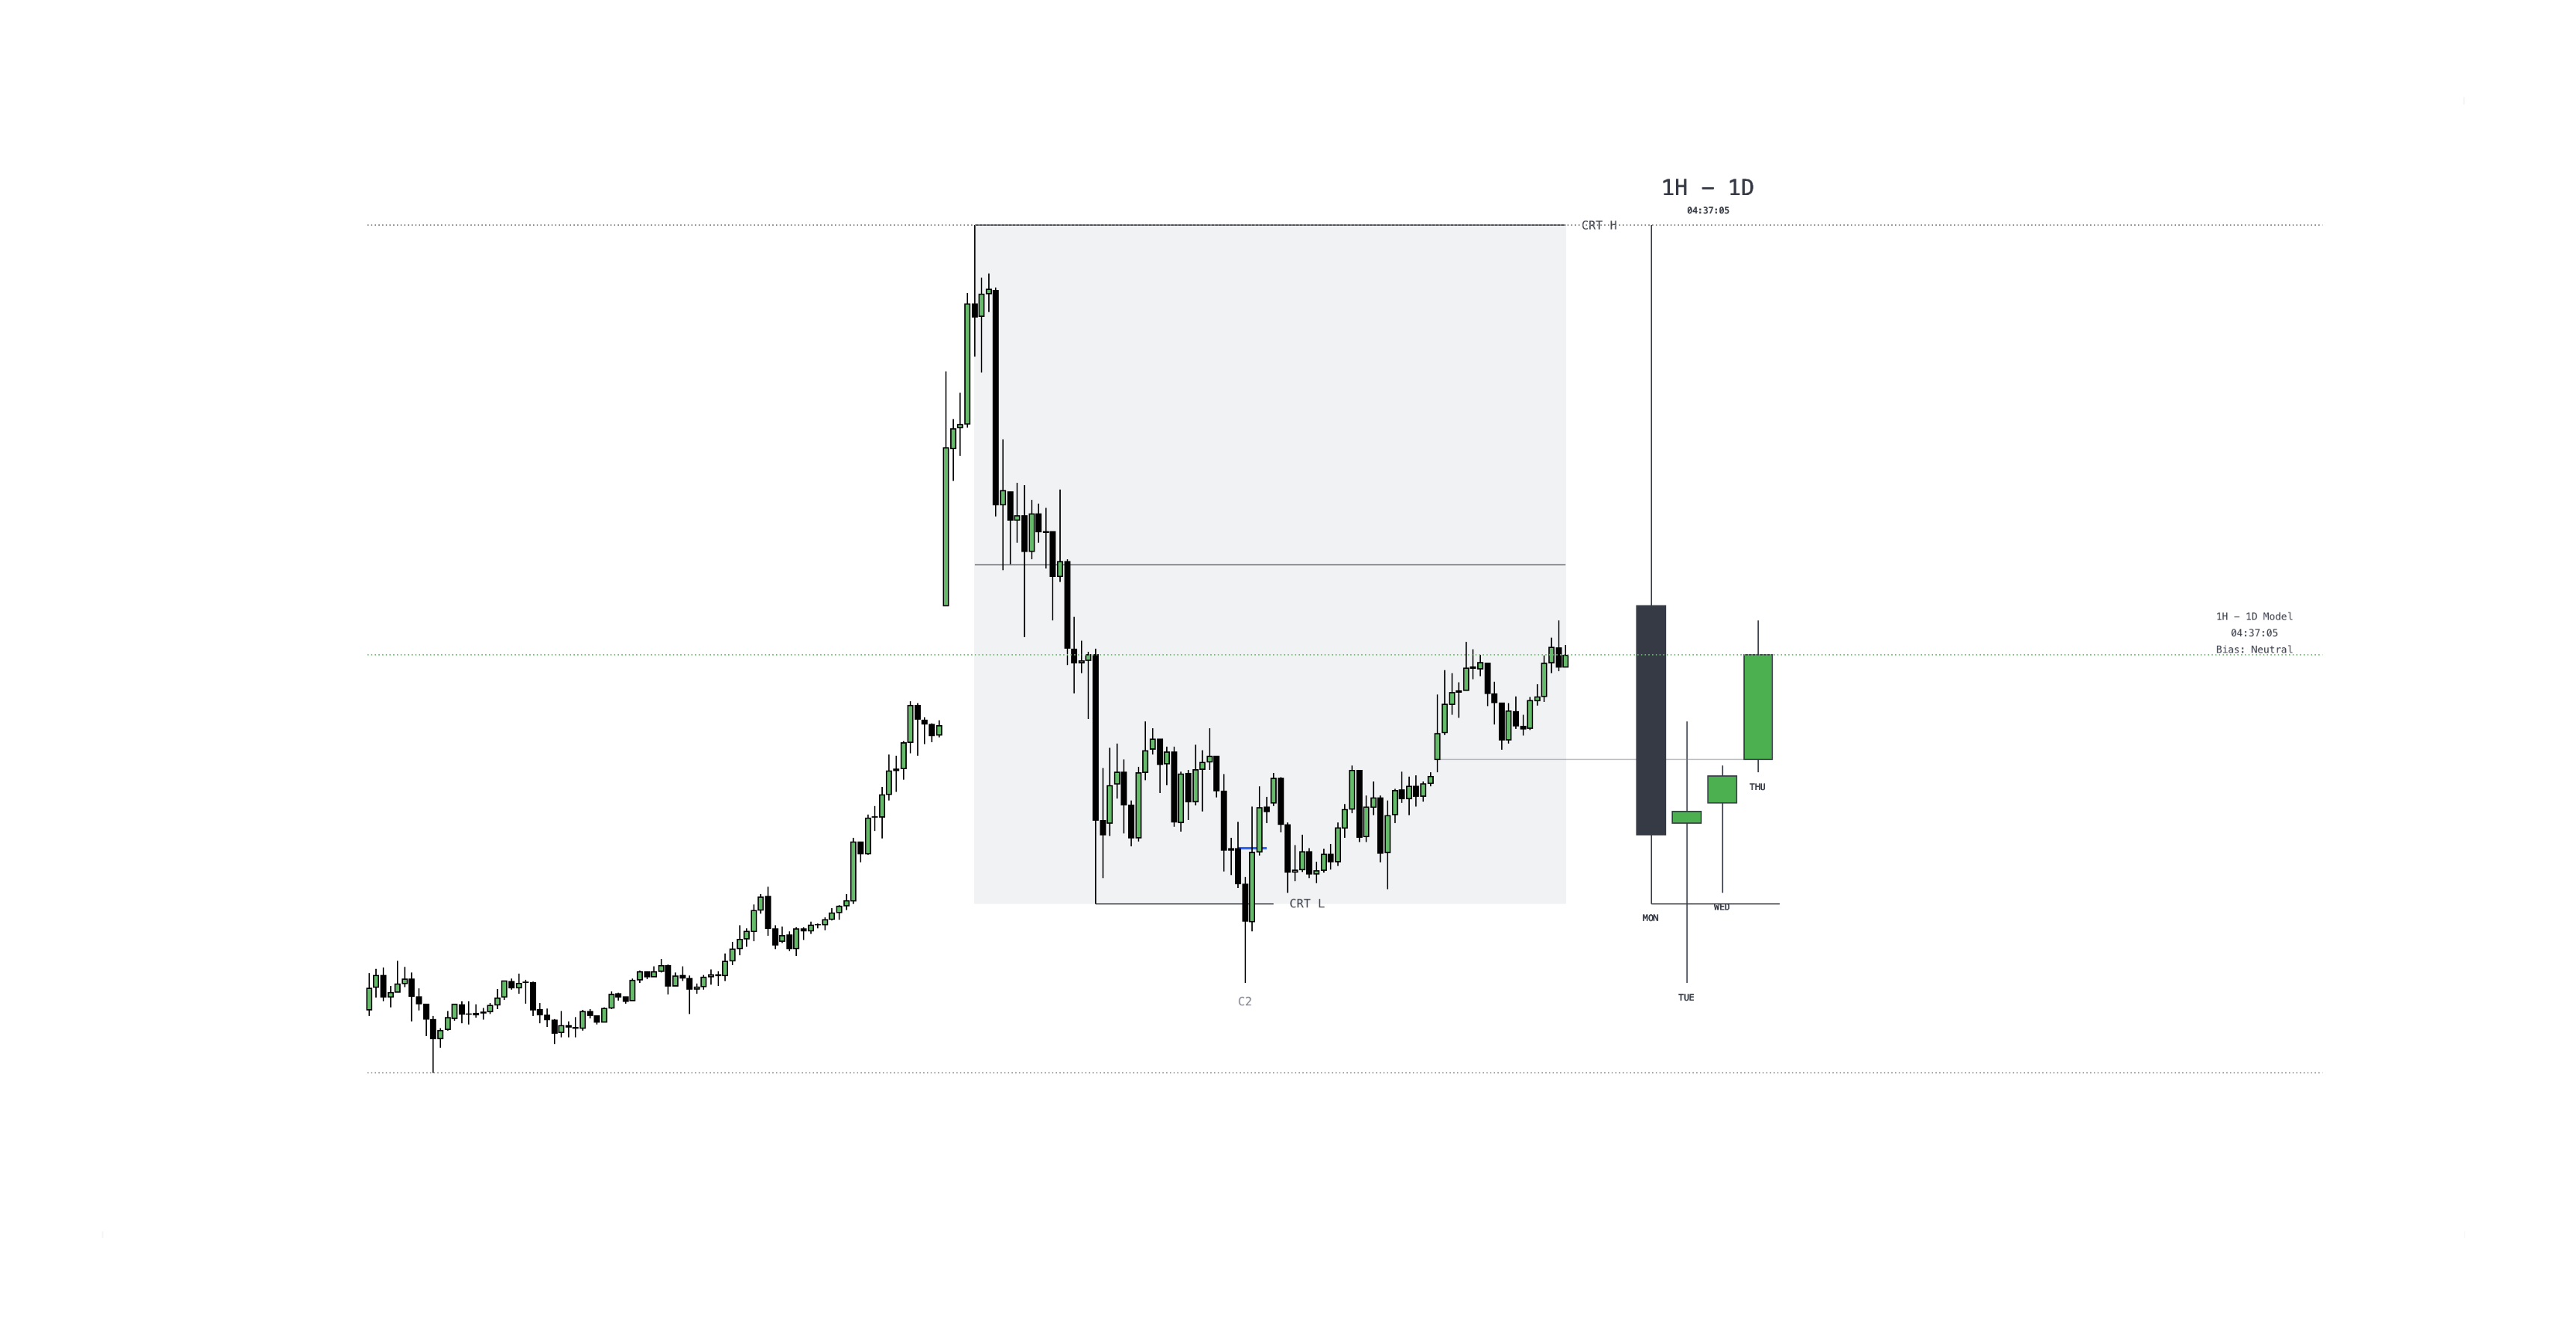
- Step 1: Higher Timeframe Sets Direction (1D / 1W / 1M) — Start by mapping the higher-timeframe CRT Model. Use price phases, equilibrium (0.5), and decisive candle closes to lock in your directional bias.
- Step 2: Intermediate Timeframe Builds the Plan (4H / 1H) — Validate your bias and sketch the structure. Look for a CISD (Change in State of Delivery), mark your POIs, and wait for a reaction or a protected swing.
- Step 3: Lower Timeframe Executes with Precision (15M / 5M) — Refine entries for better R:R. Require a confirming CISD so all timeframes agree. Trigger on new protected high/lows or continuation order blocks (OBs).
4. Step-by-Step CRT Strategy
The power of CRT comes from combining microscopic inner-candle cycles with macroscopic higher-timeframe levels.
CStep-by-Step CRT Strategy
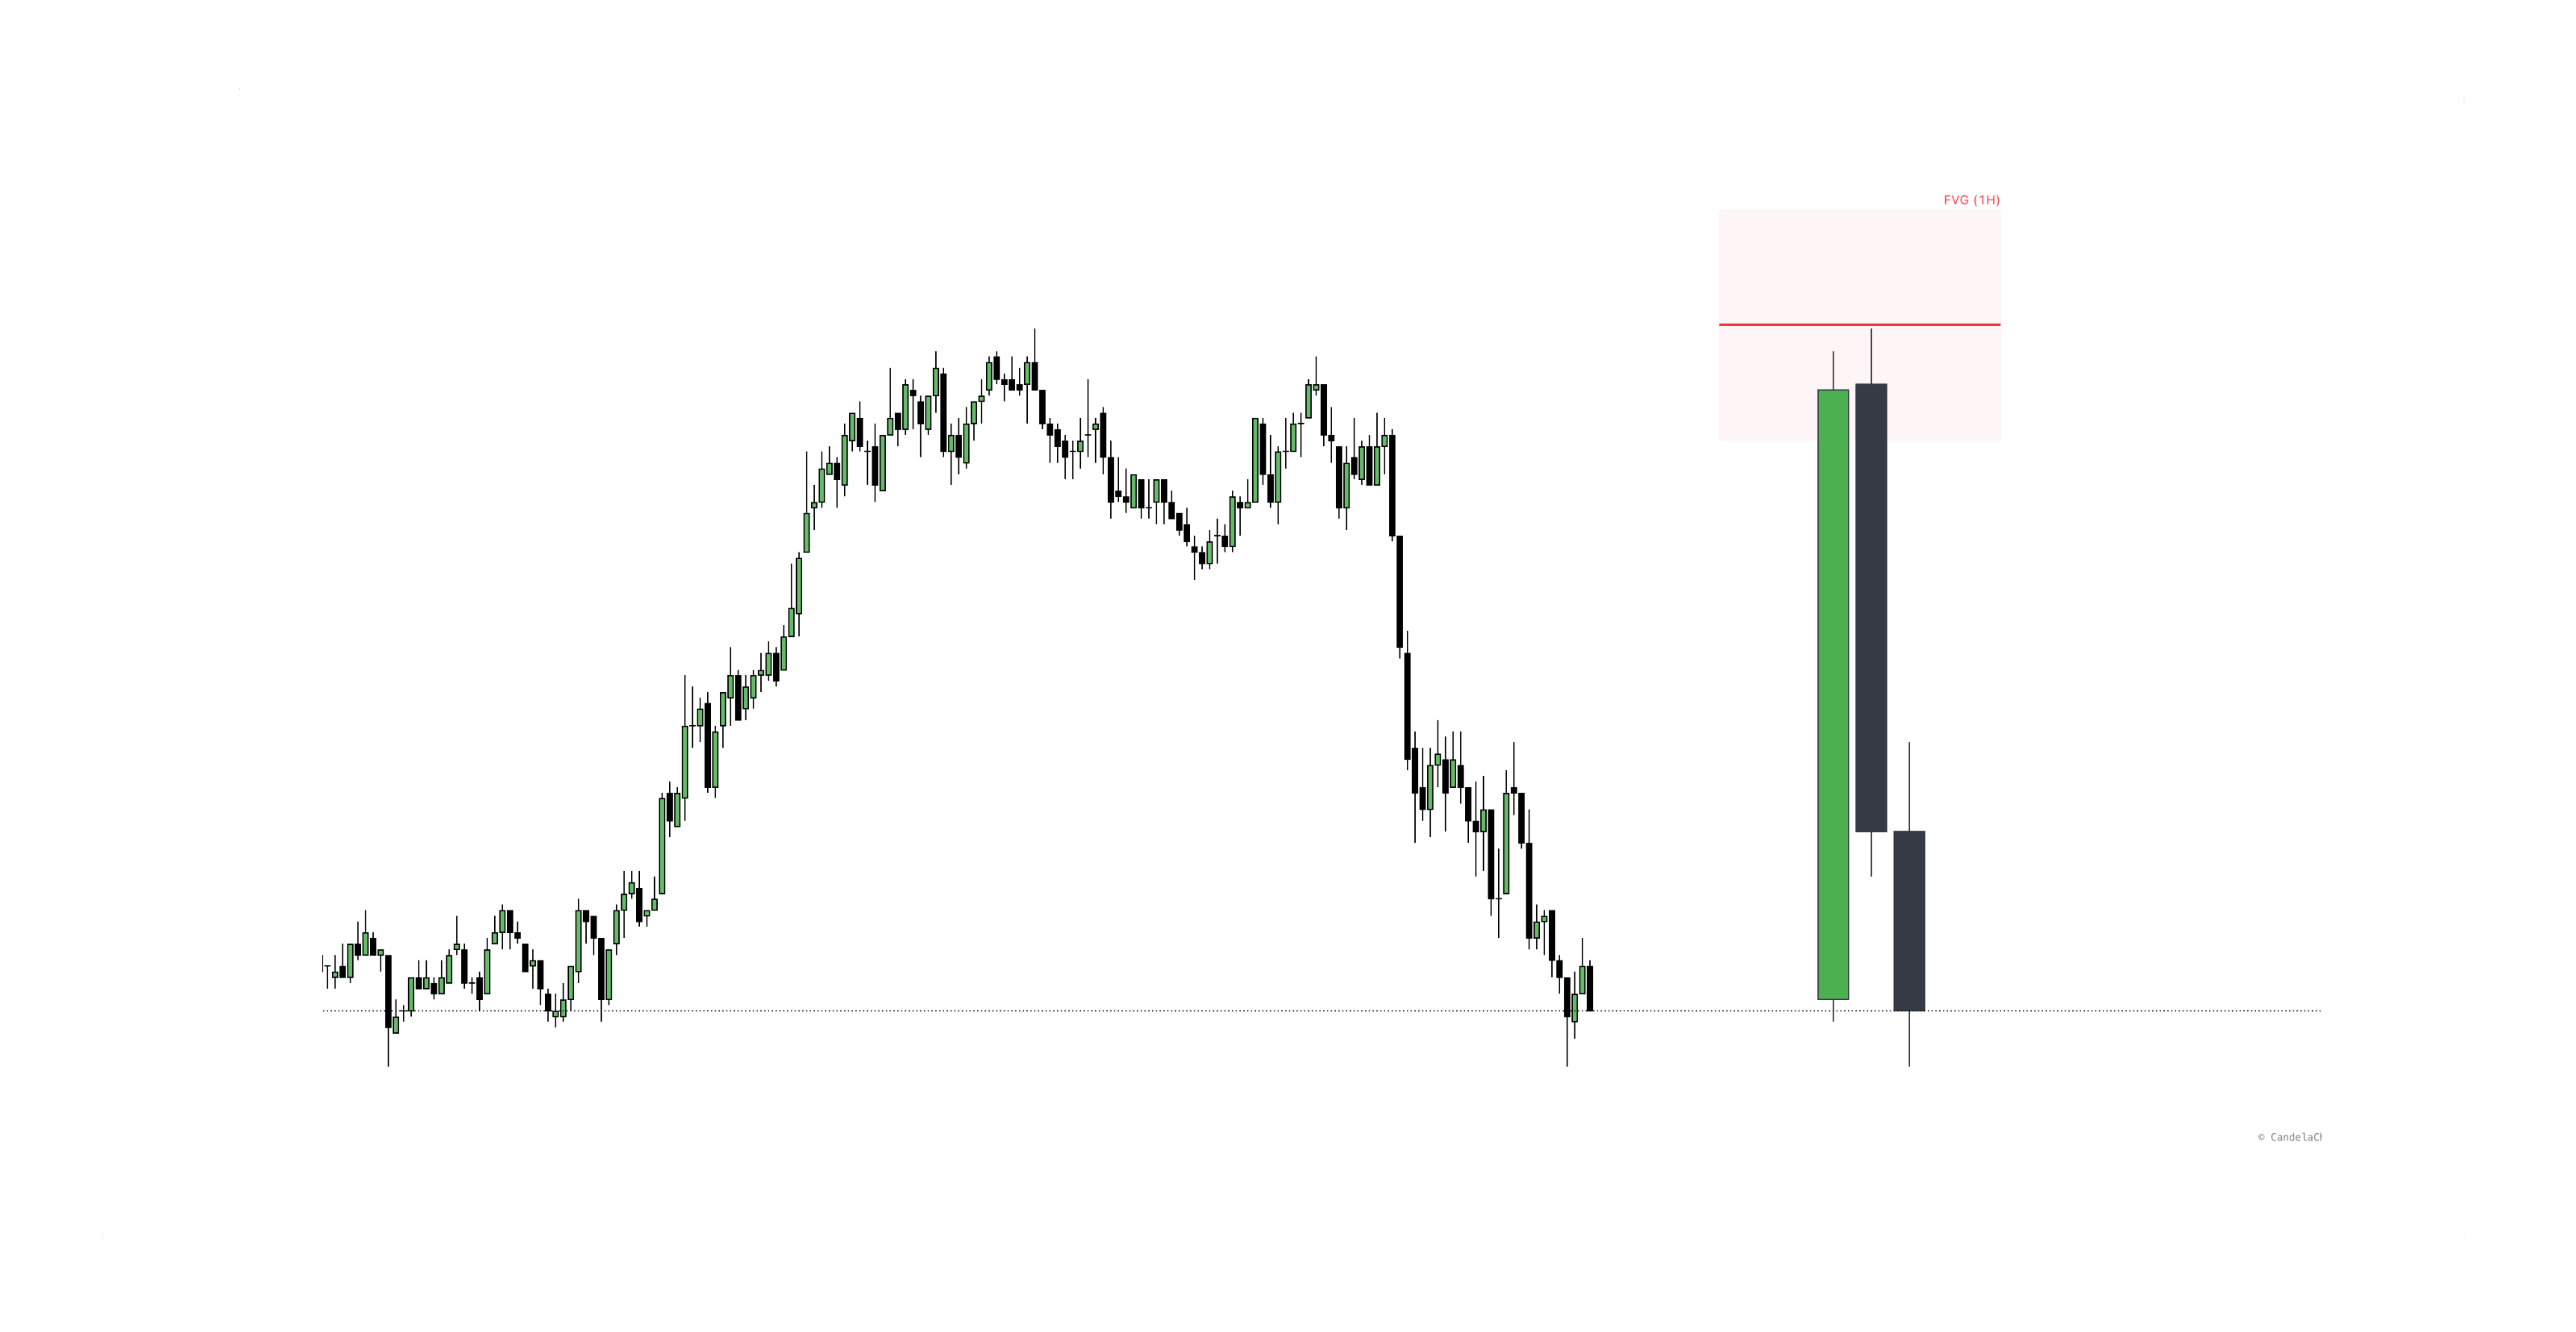
Step 1: Identify HTF Context (PD Arrays)
Before anything else, you must identify your "draw on liquidity." The CRT setup is only as strong as the level it is reacting to. Look for price to tap into:
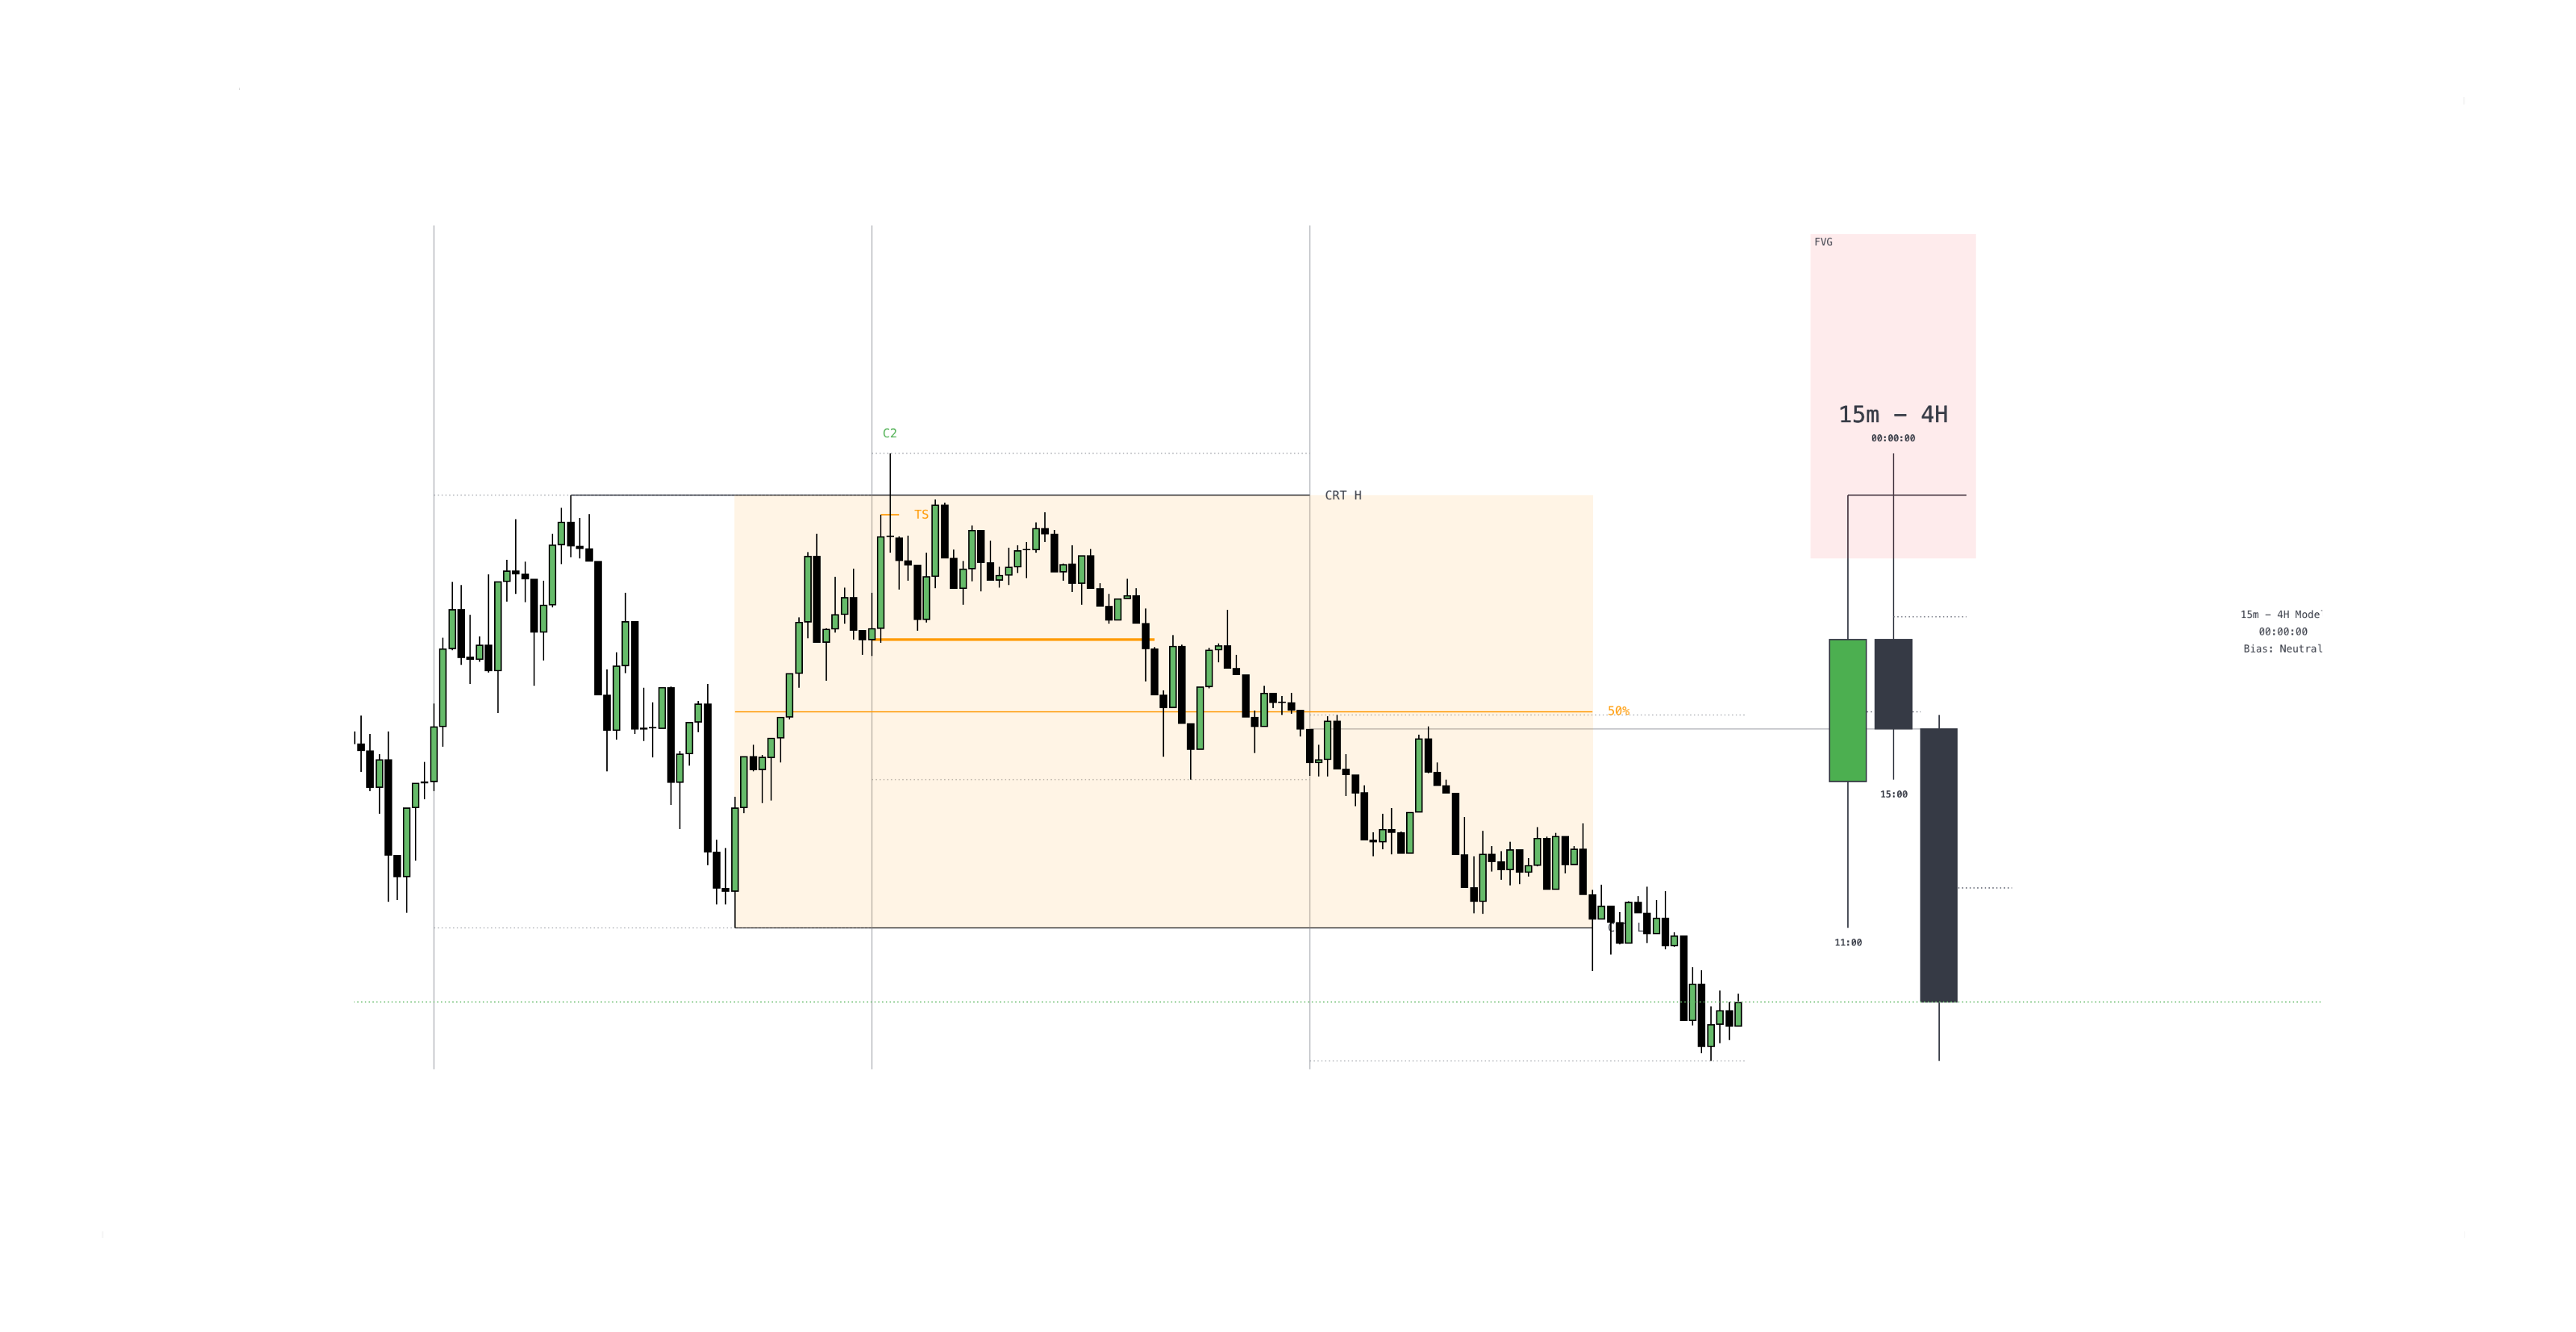
- HTF PD Arrays: Higher-timeframe (1H, 4H, or Daily) Fair Value Gaps (FVG), Inversion FVGs, Order Blocks, or Breaker Blocks.
- Liquidity Pools: Major institutional levels such as Previous Day High/Low (PDH/PDL) or Previous Week High/Low (PWH/PWL).
Step 1
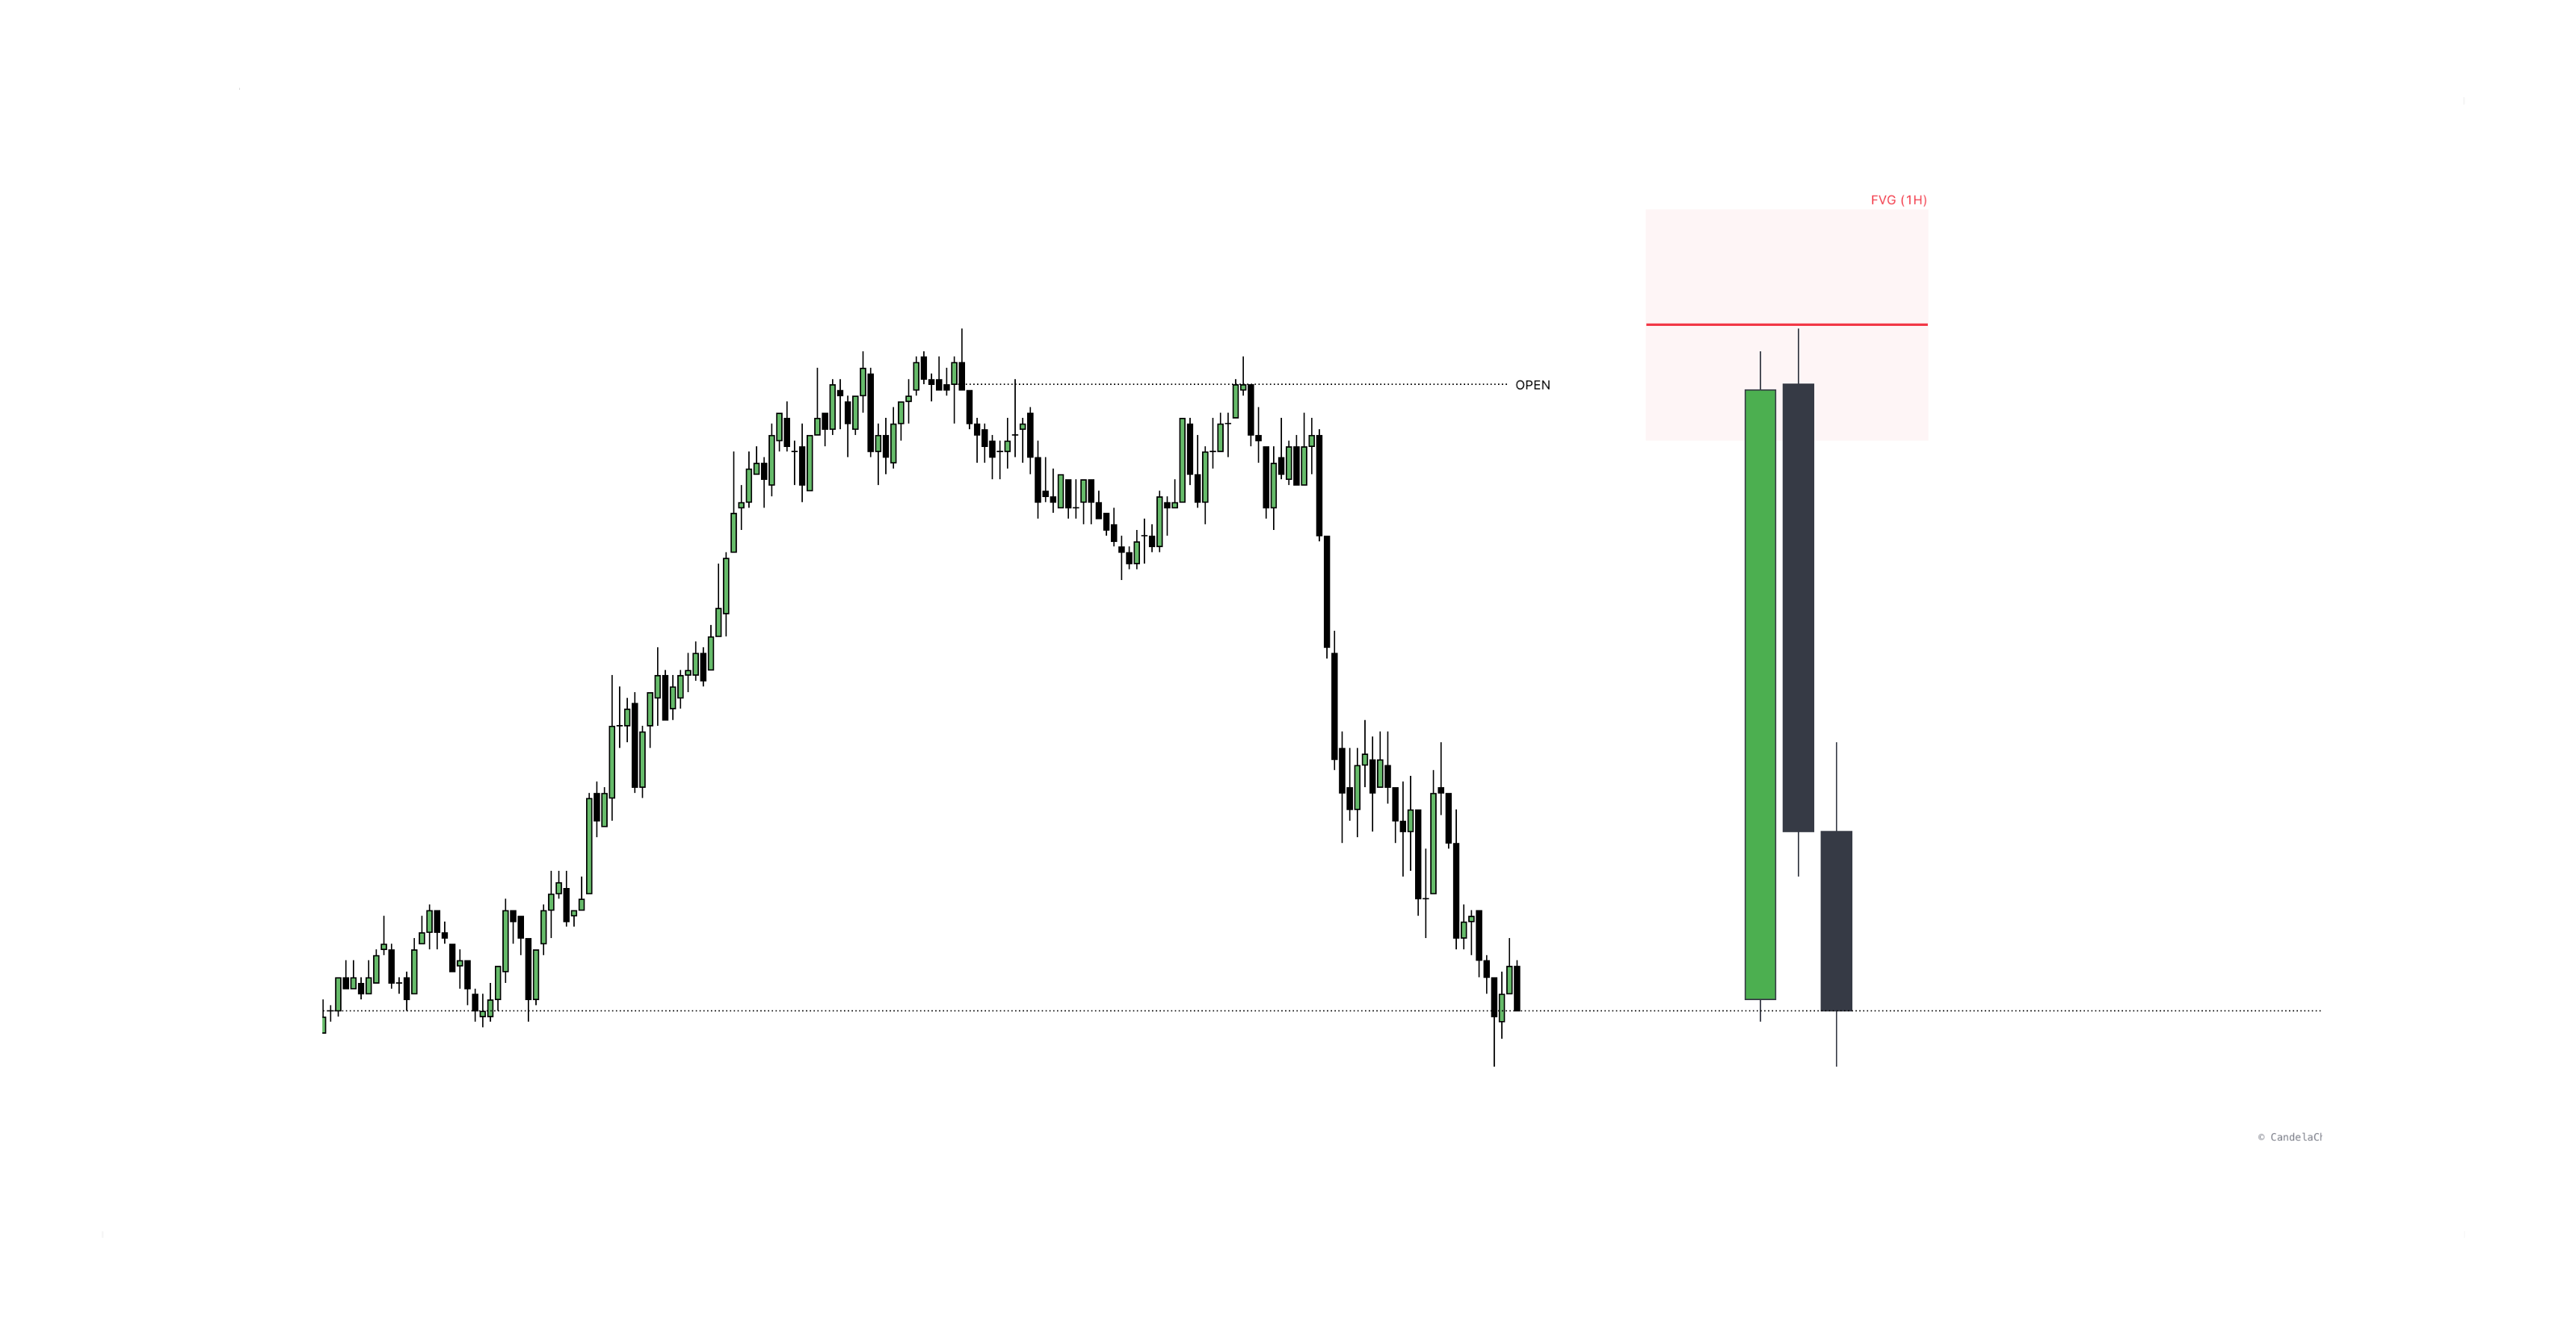
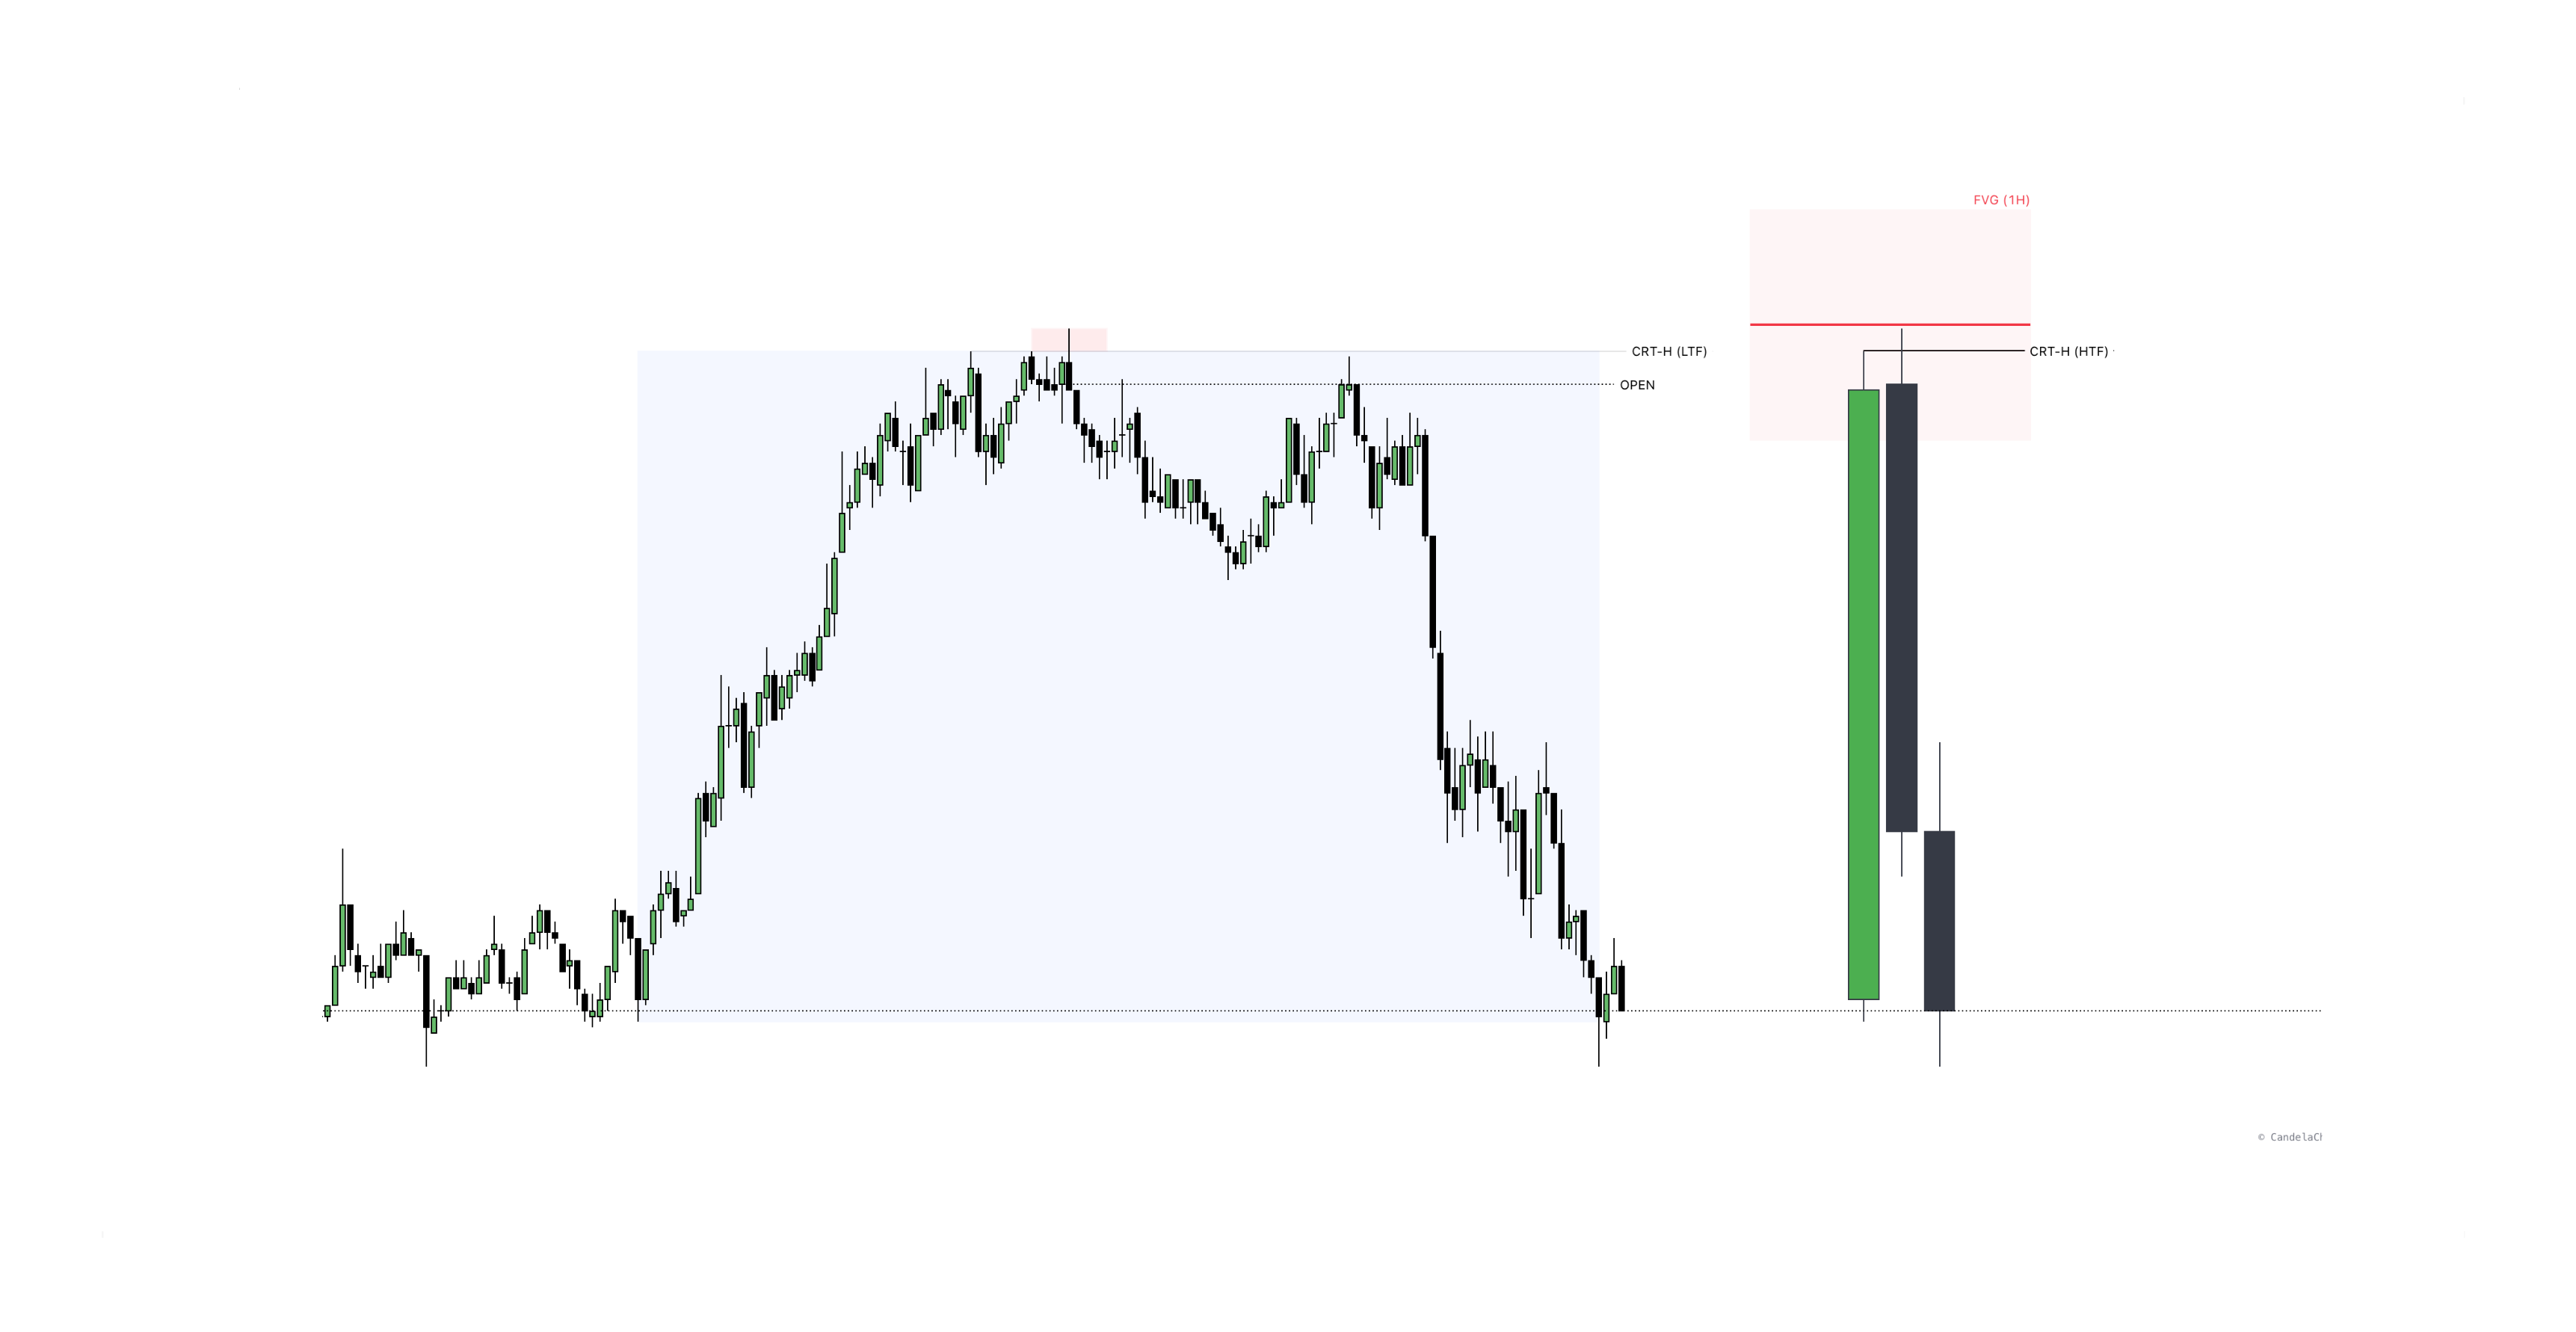
Step 2: Mark the Opening Price
Identify the opening price of the candle immediately following the CRT candle. This level serves as the structural anchor point for your current model, providing the baseline for the next phase of delivery.
Step 2
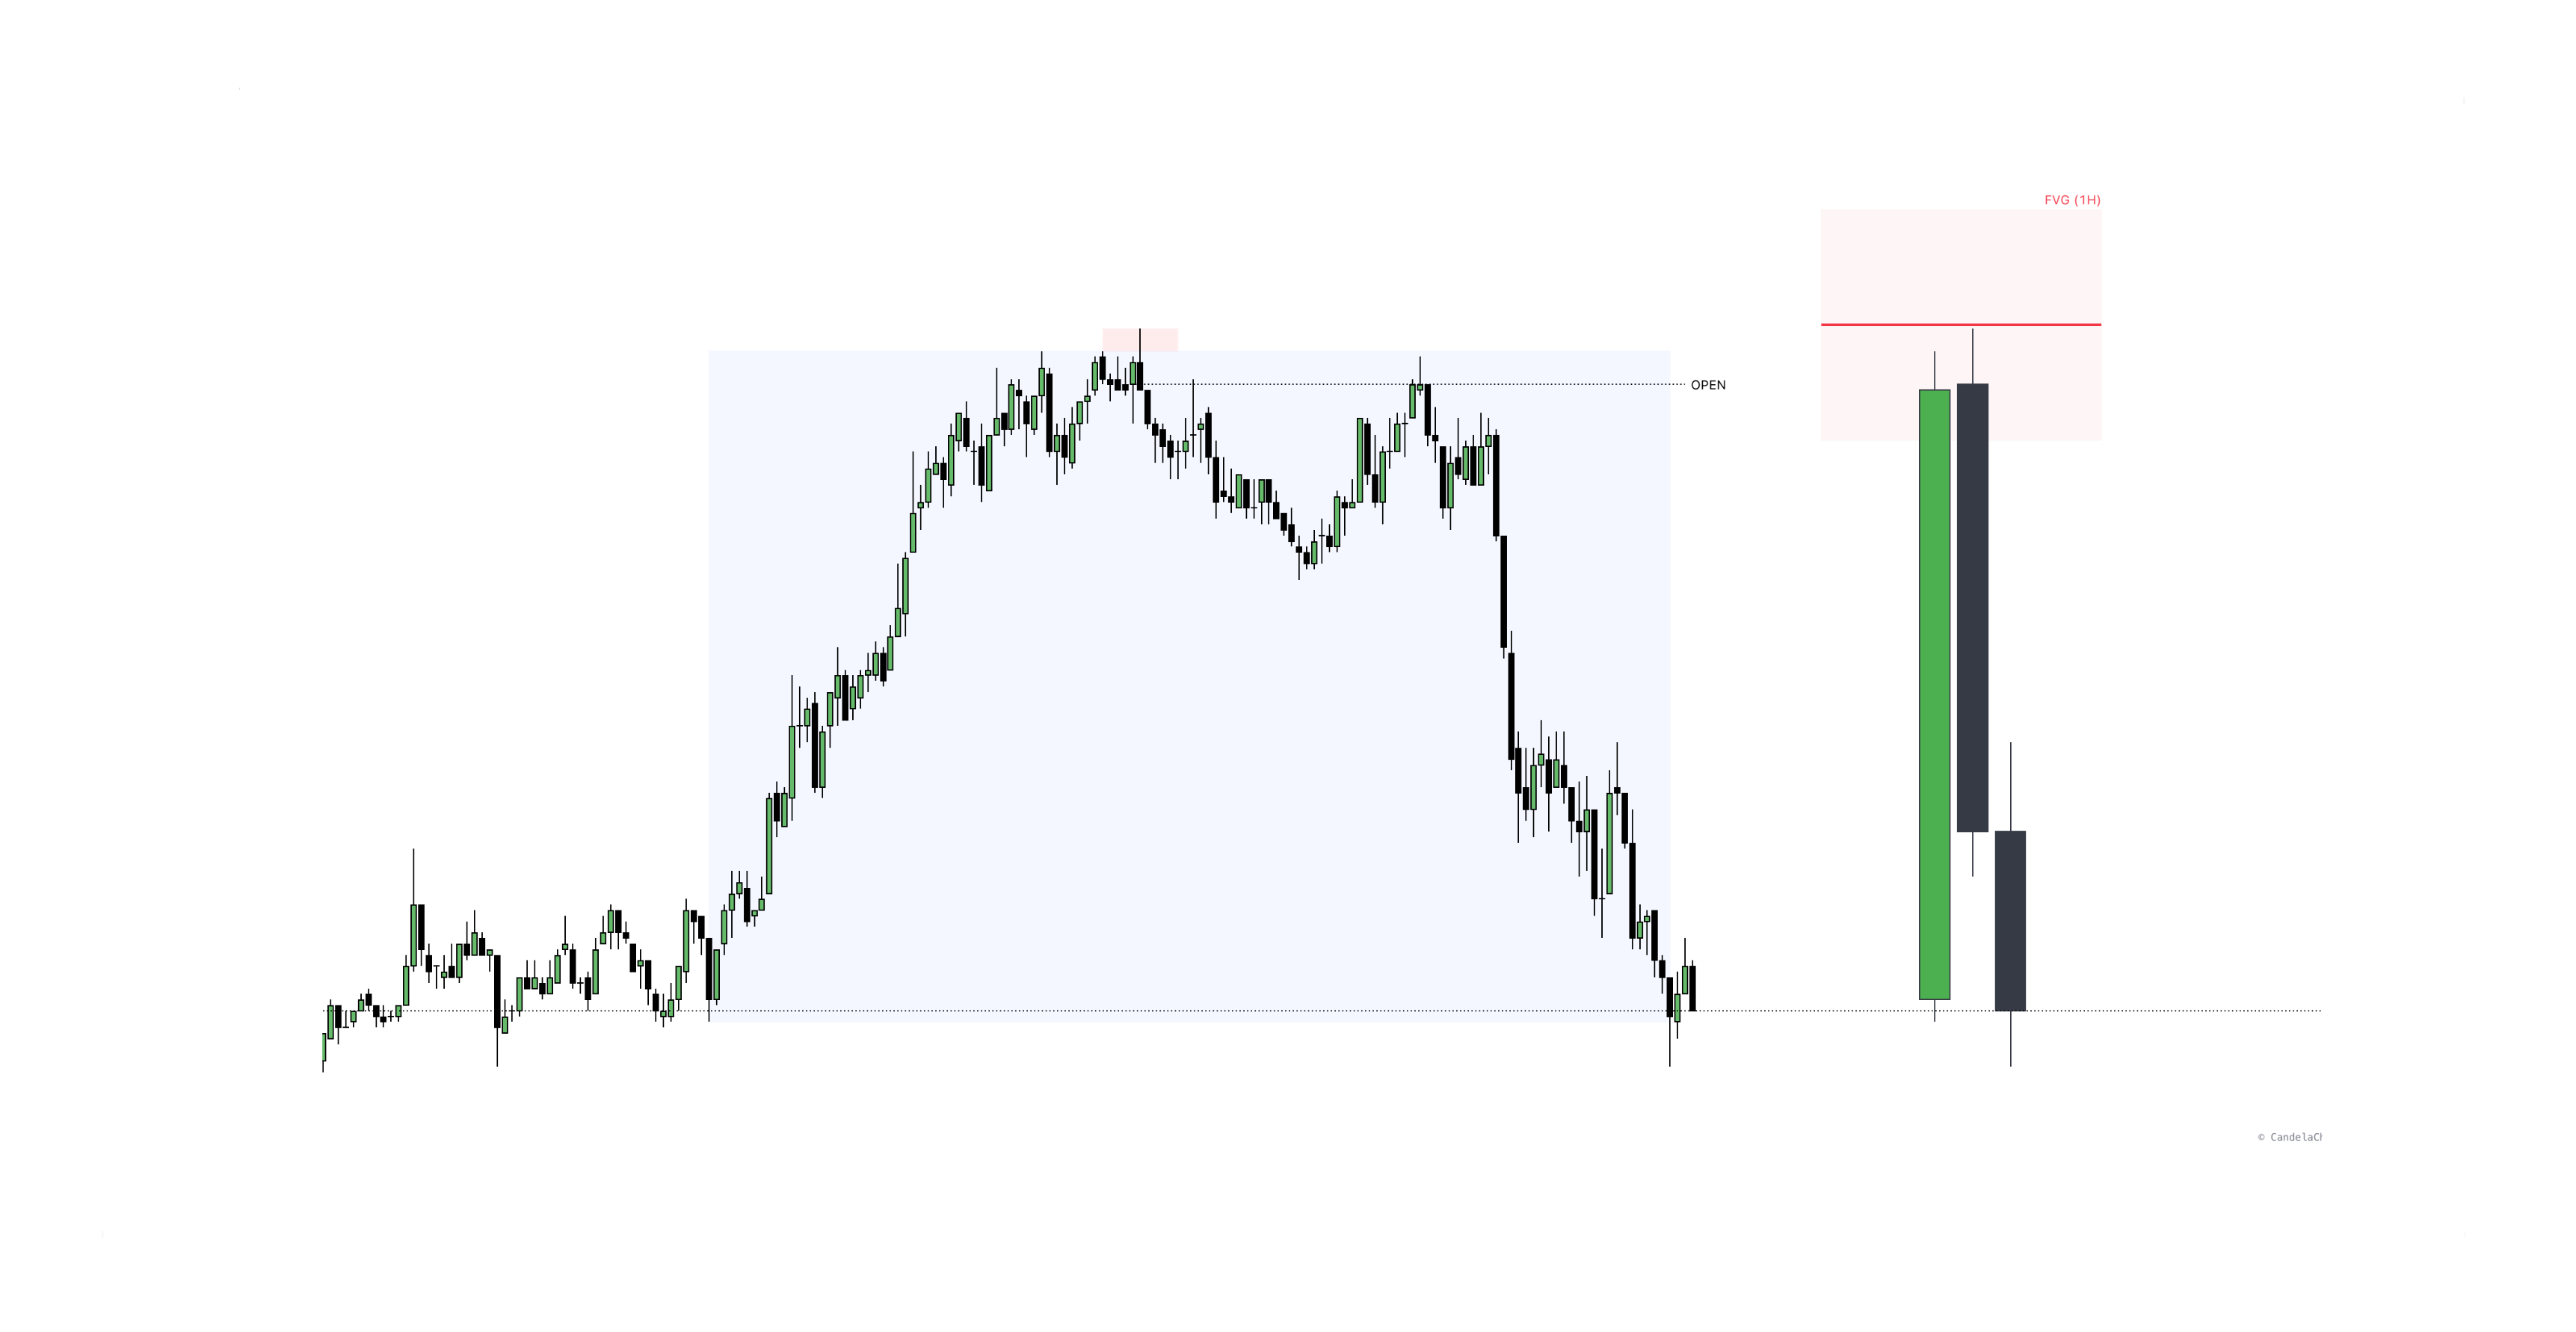
Step 3: Wait for Manipulation (The Wick)
Wait for price to move away from your intended bias.
- Bullish Bias: Wait for price to drop below the opening price and into an HTF discount level.
- Bearish Bias: Wait for price to rally above the opening price and into an HTF premium level.
Step 3
Step 4: Identify the CRT Raid
Look for price to "sweep" the previous candle's high or low (CRT-High/Low) or an HTF level, then quickly reject it. This is the manipulation phase where "Smart Money" traps retail traders and builds their positions.
Step 4
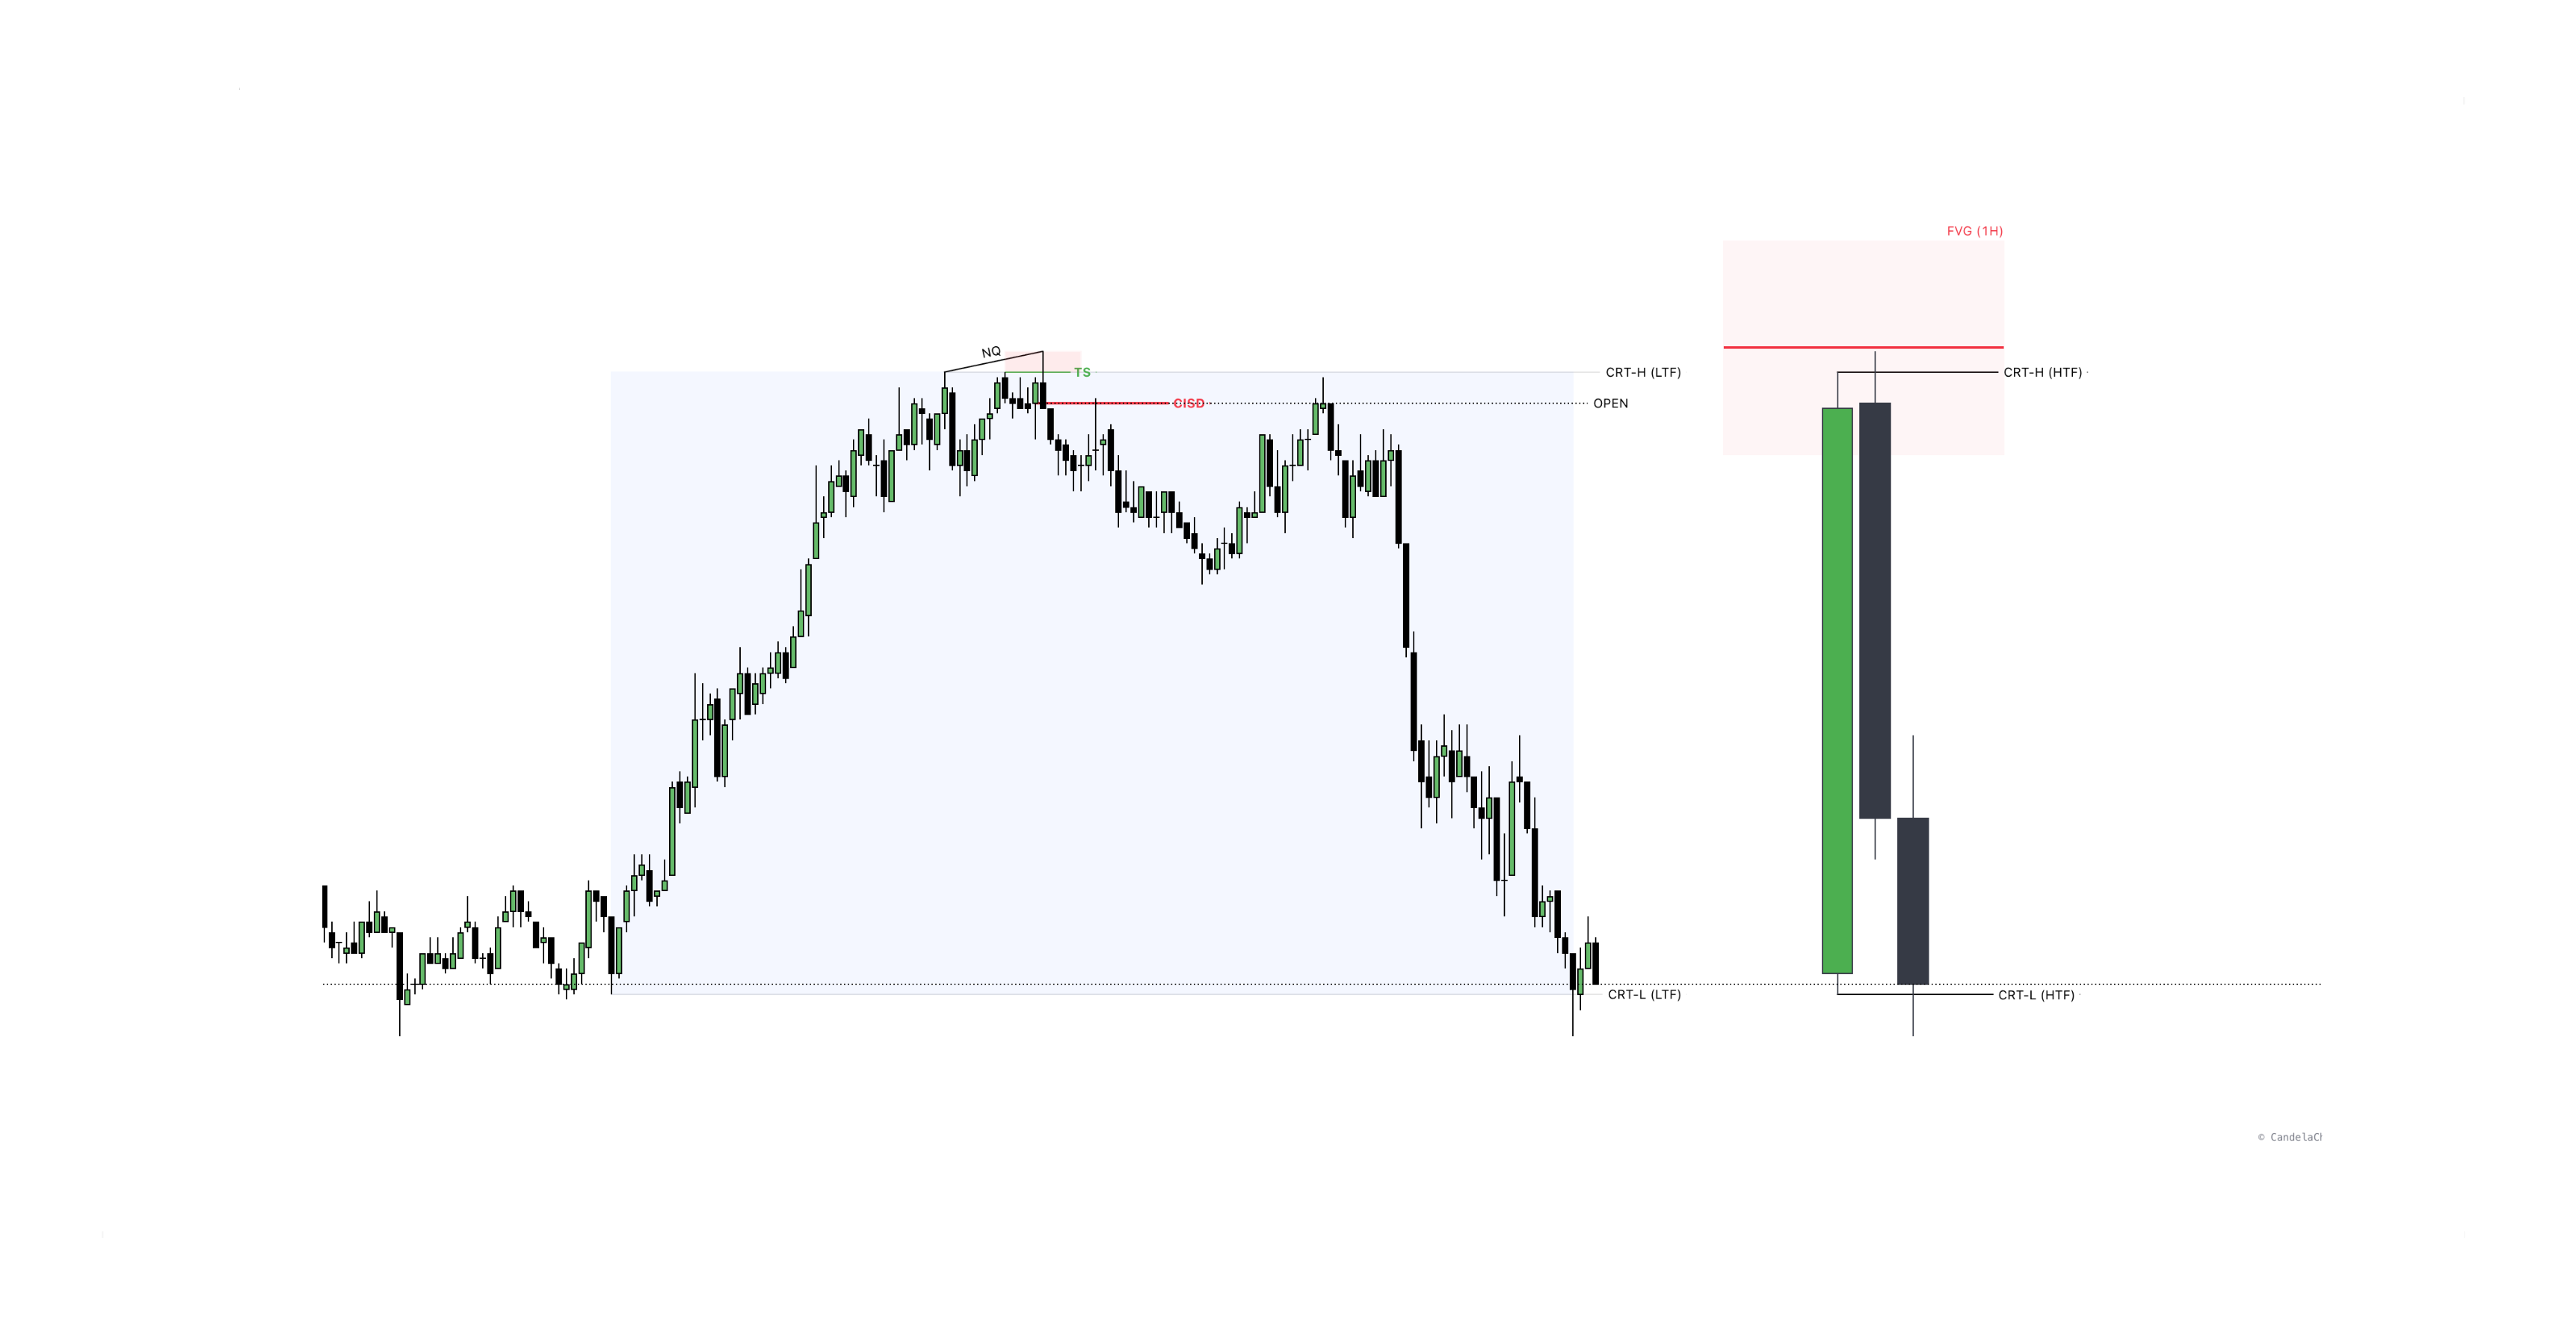
Step 5: The Change In State Of Delivery (CISD)
Once the raid occurs, move to your lower timeframe (1m or 5m) and wait for a Change In State Of Delivery (CISD). This confirms the manipulation phase is over and the Distribution phase is beginning.
Step 5

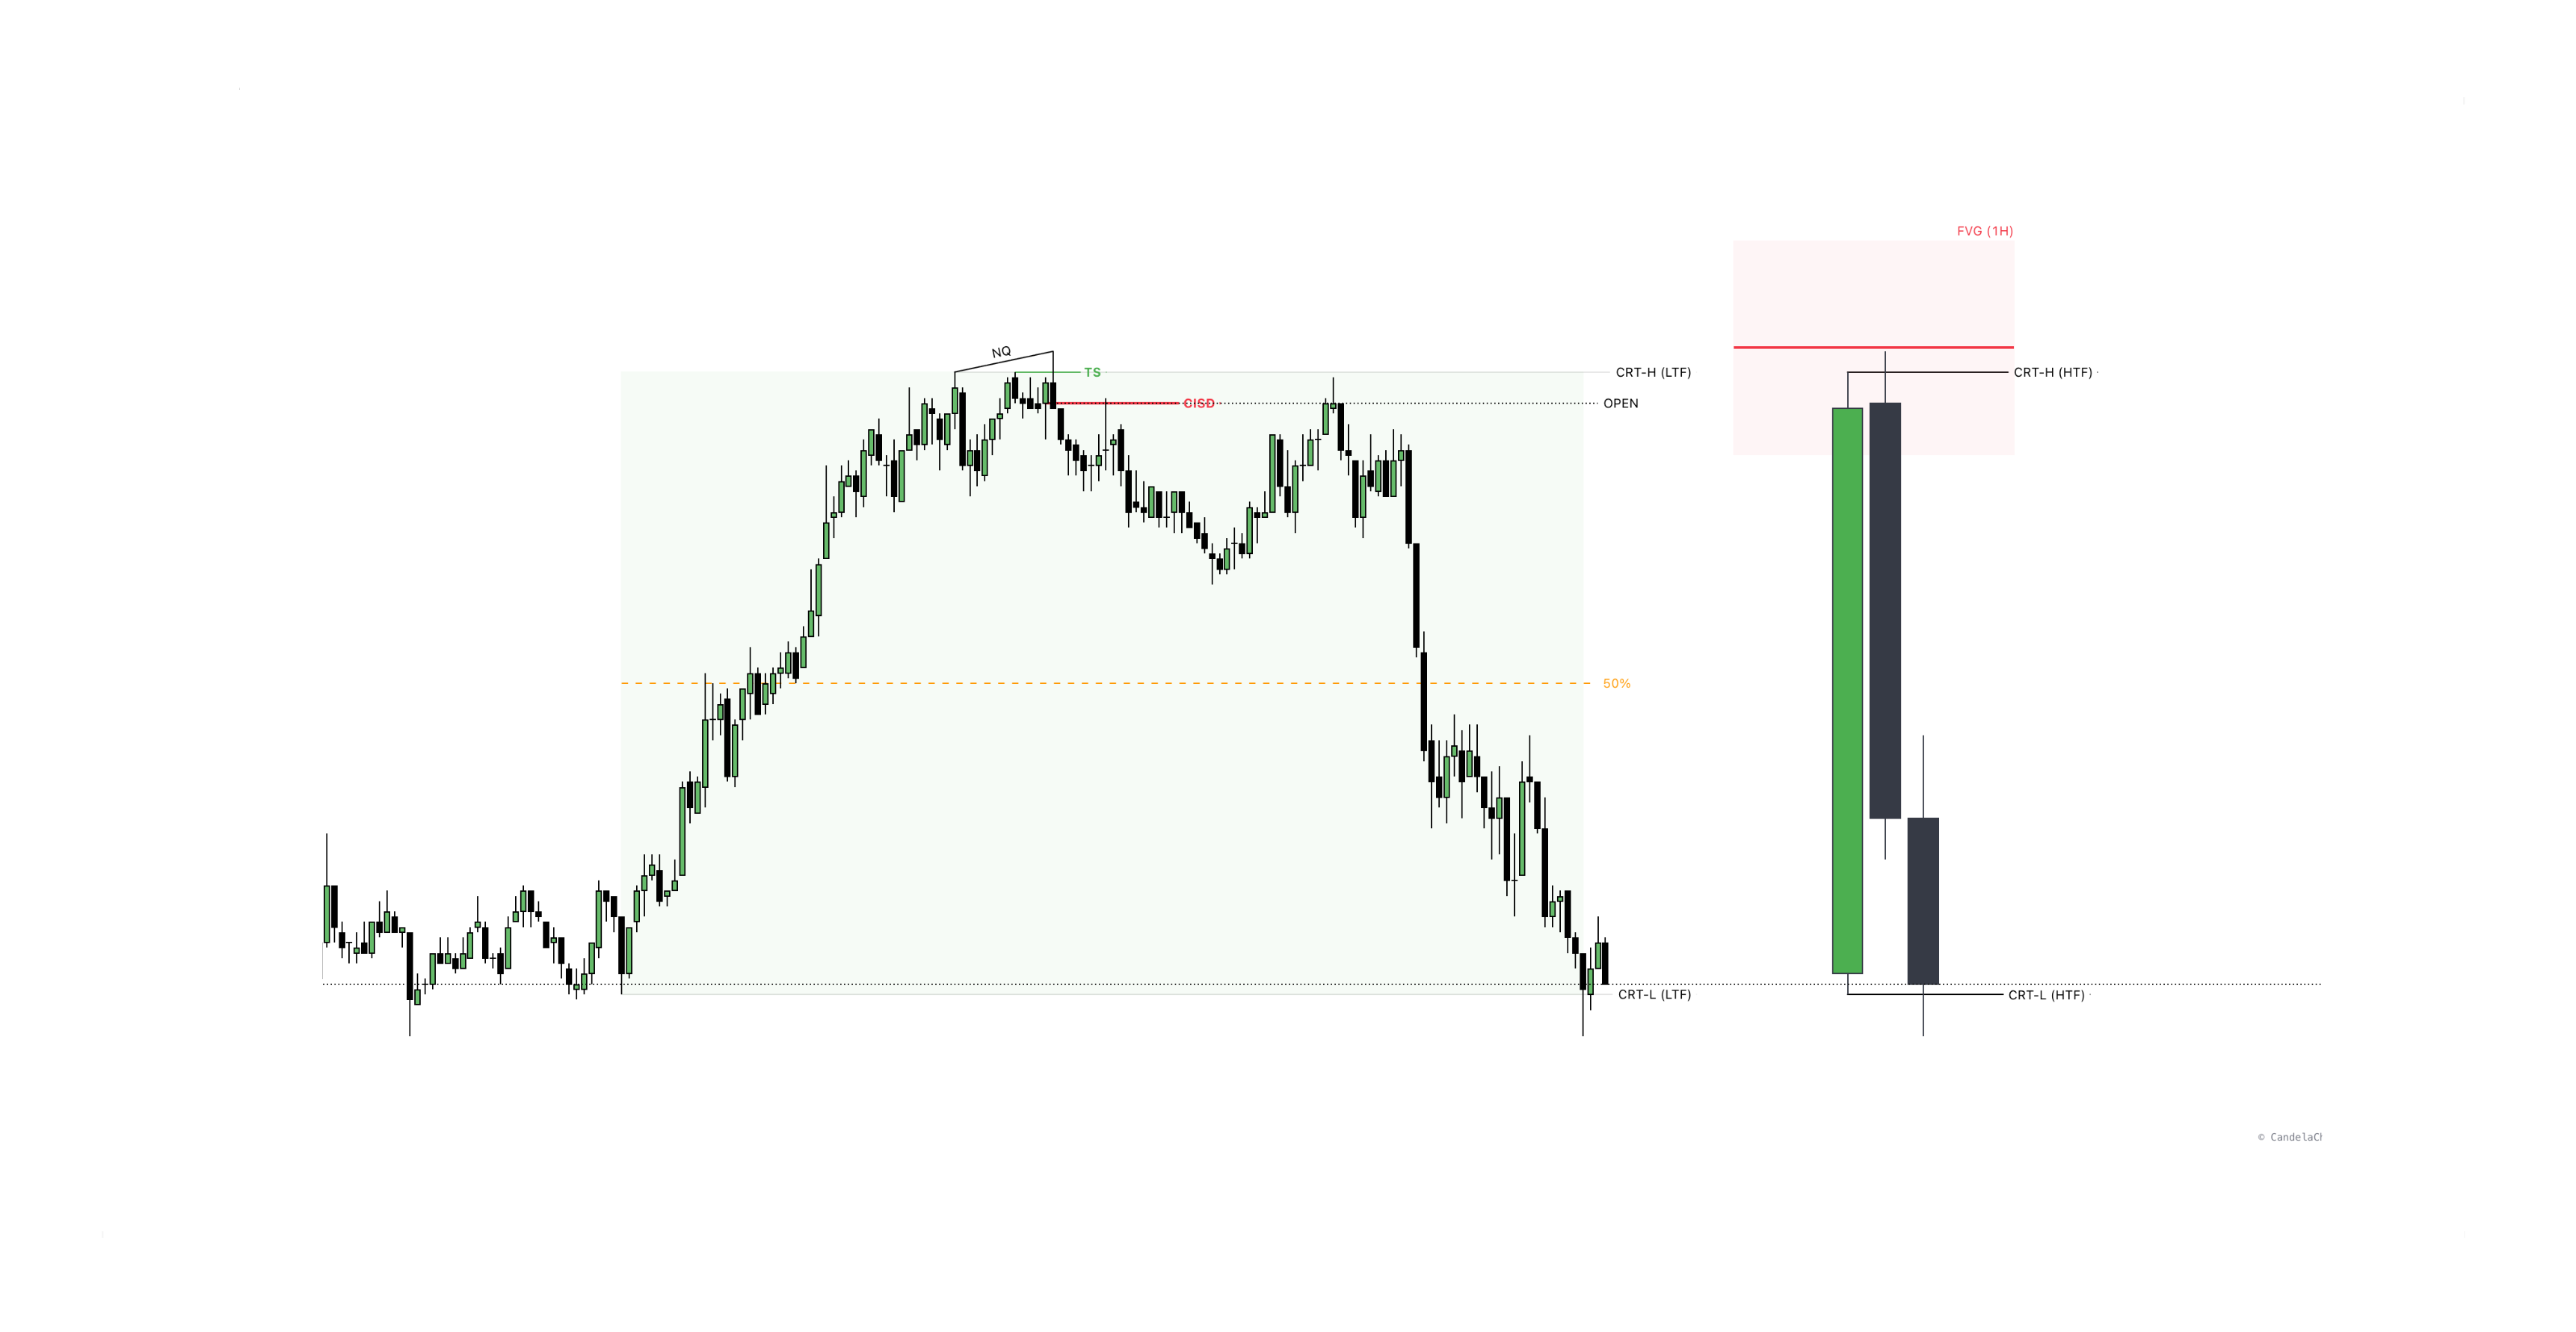
Step 6: Turtle Soup
Identify the raid or sweep of previous liquidity levels as a confirmation of high-probability reversal.
Step 6

Step 7: SMT (Smart Money Technique)
Look for SMT Divergence between correlated markets (e.g., EURUSD/GBPUSD or ES/NQ) to validate the institutional sponsorship.
Step 7
Step 8: Entry and Target
- Entry: Trade the retest of a newly created LTF FVG or Order Block after the MSS.
- Target: The Mean (50%) of the range as a first target, followed by the opposing CRT-High/Low or an HTF liquidity target.
Step 8
Confluence: Overlapping CRT Models
For the highest accuracy setups, look for the overlapping convergence of three different CRT models:
- 1 Hour (HTF) → 5 Minute (LTF) — Intra-Session Trading
- 4 Hour (HTF) → 15 Minute (LTF) — Day Trading / Swing
- Daily (HTF) → 1 Hour (LTF) — Directional Bias
When these three timeframes align in their bias and execution phases, it provides significantly greater accuracy and institutional weight to the trade.
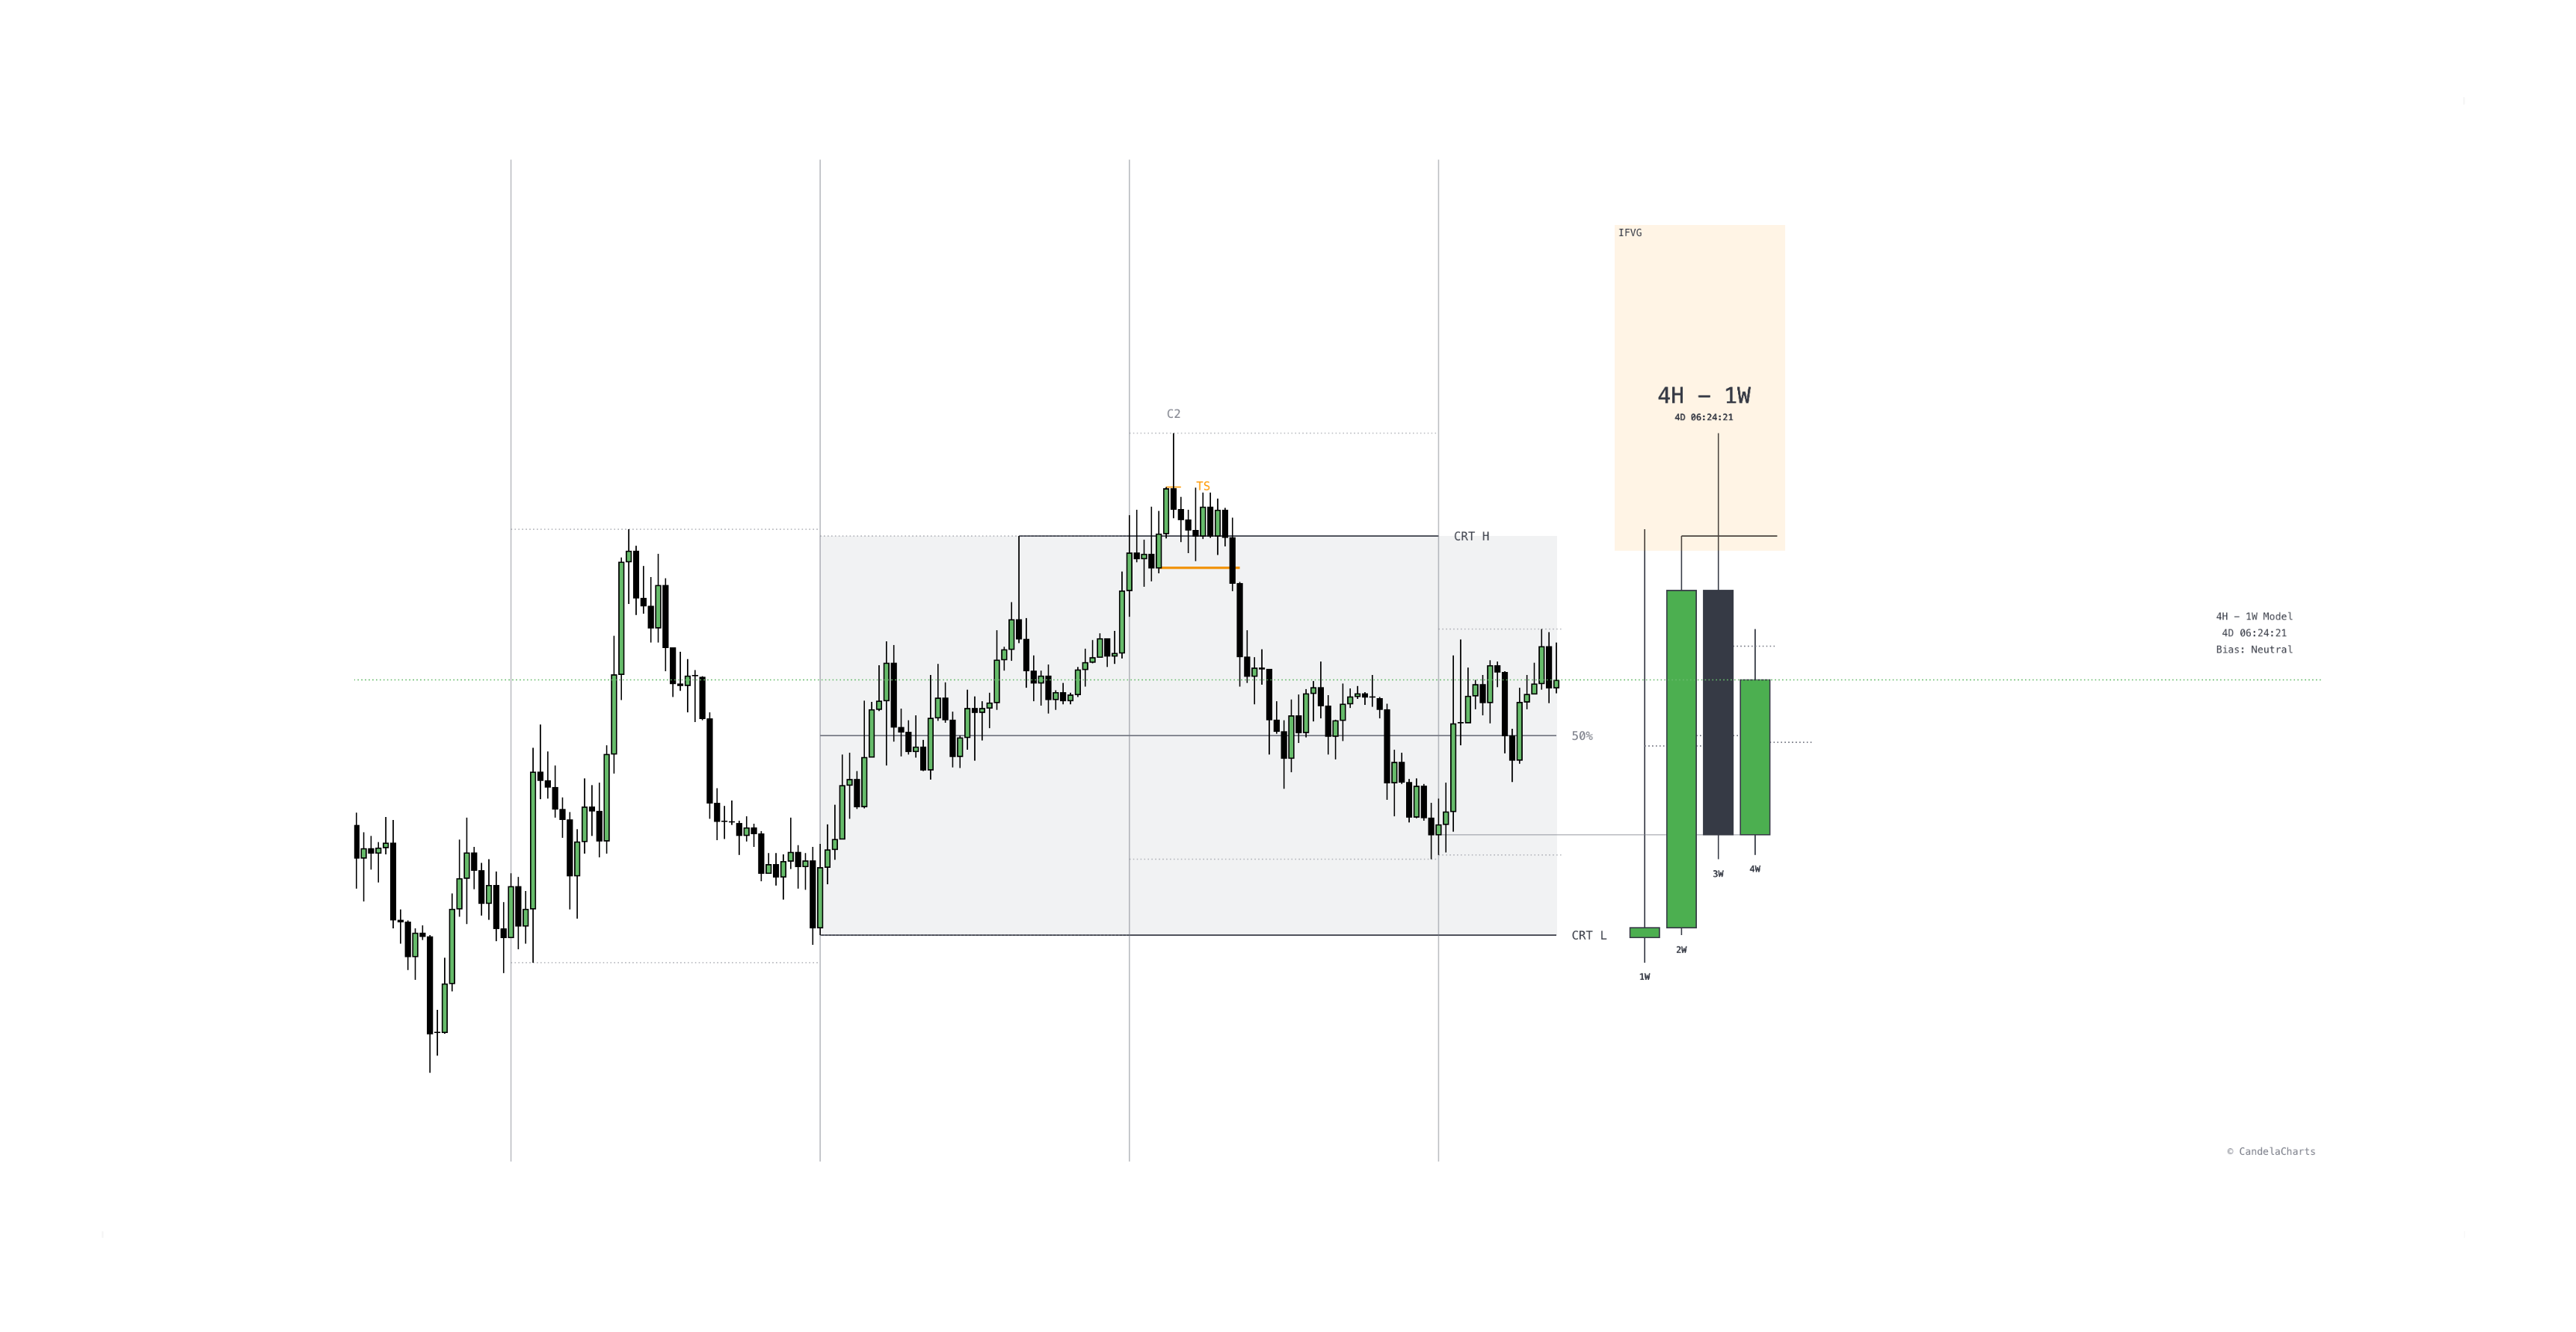
The High Probability CRT Model
The most potent CRT setups occur when multiple institutional signatures align perfectly. While any CRT model can provide a trade, the following three components are core and non-negotiable for a truly high-probability setup:
- HTF PD Array: The setup must react from a Higher Timeframe (4H, Daily, or Weekly) Point of Interest—such as a Fair Value Gap (FVG), Order Block (OB), or Breaker. Without HTF context, the CRT is just noise.
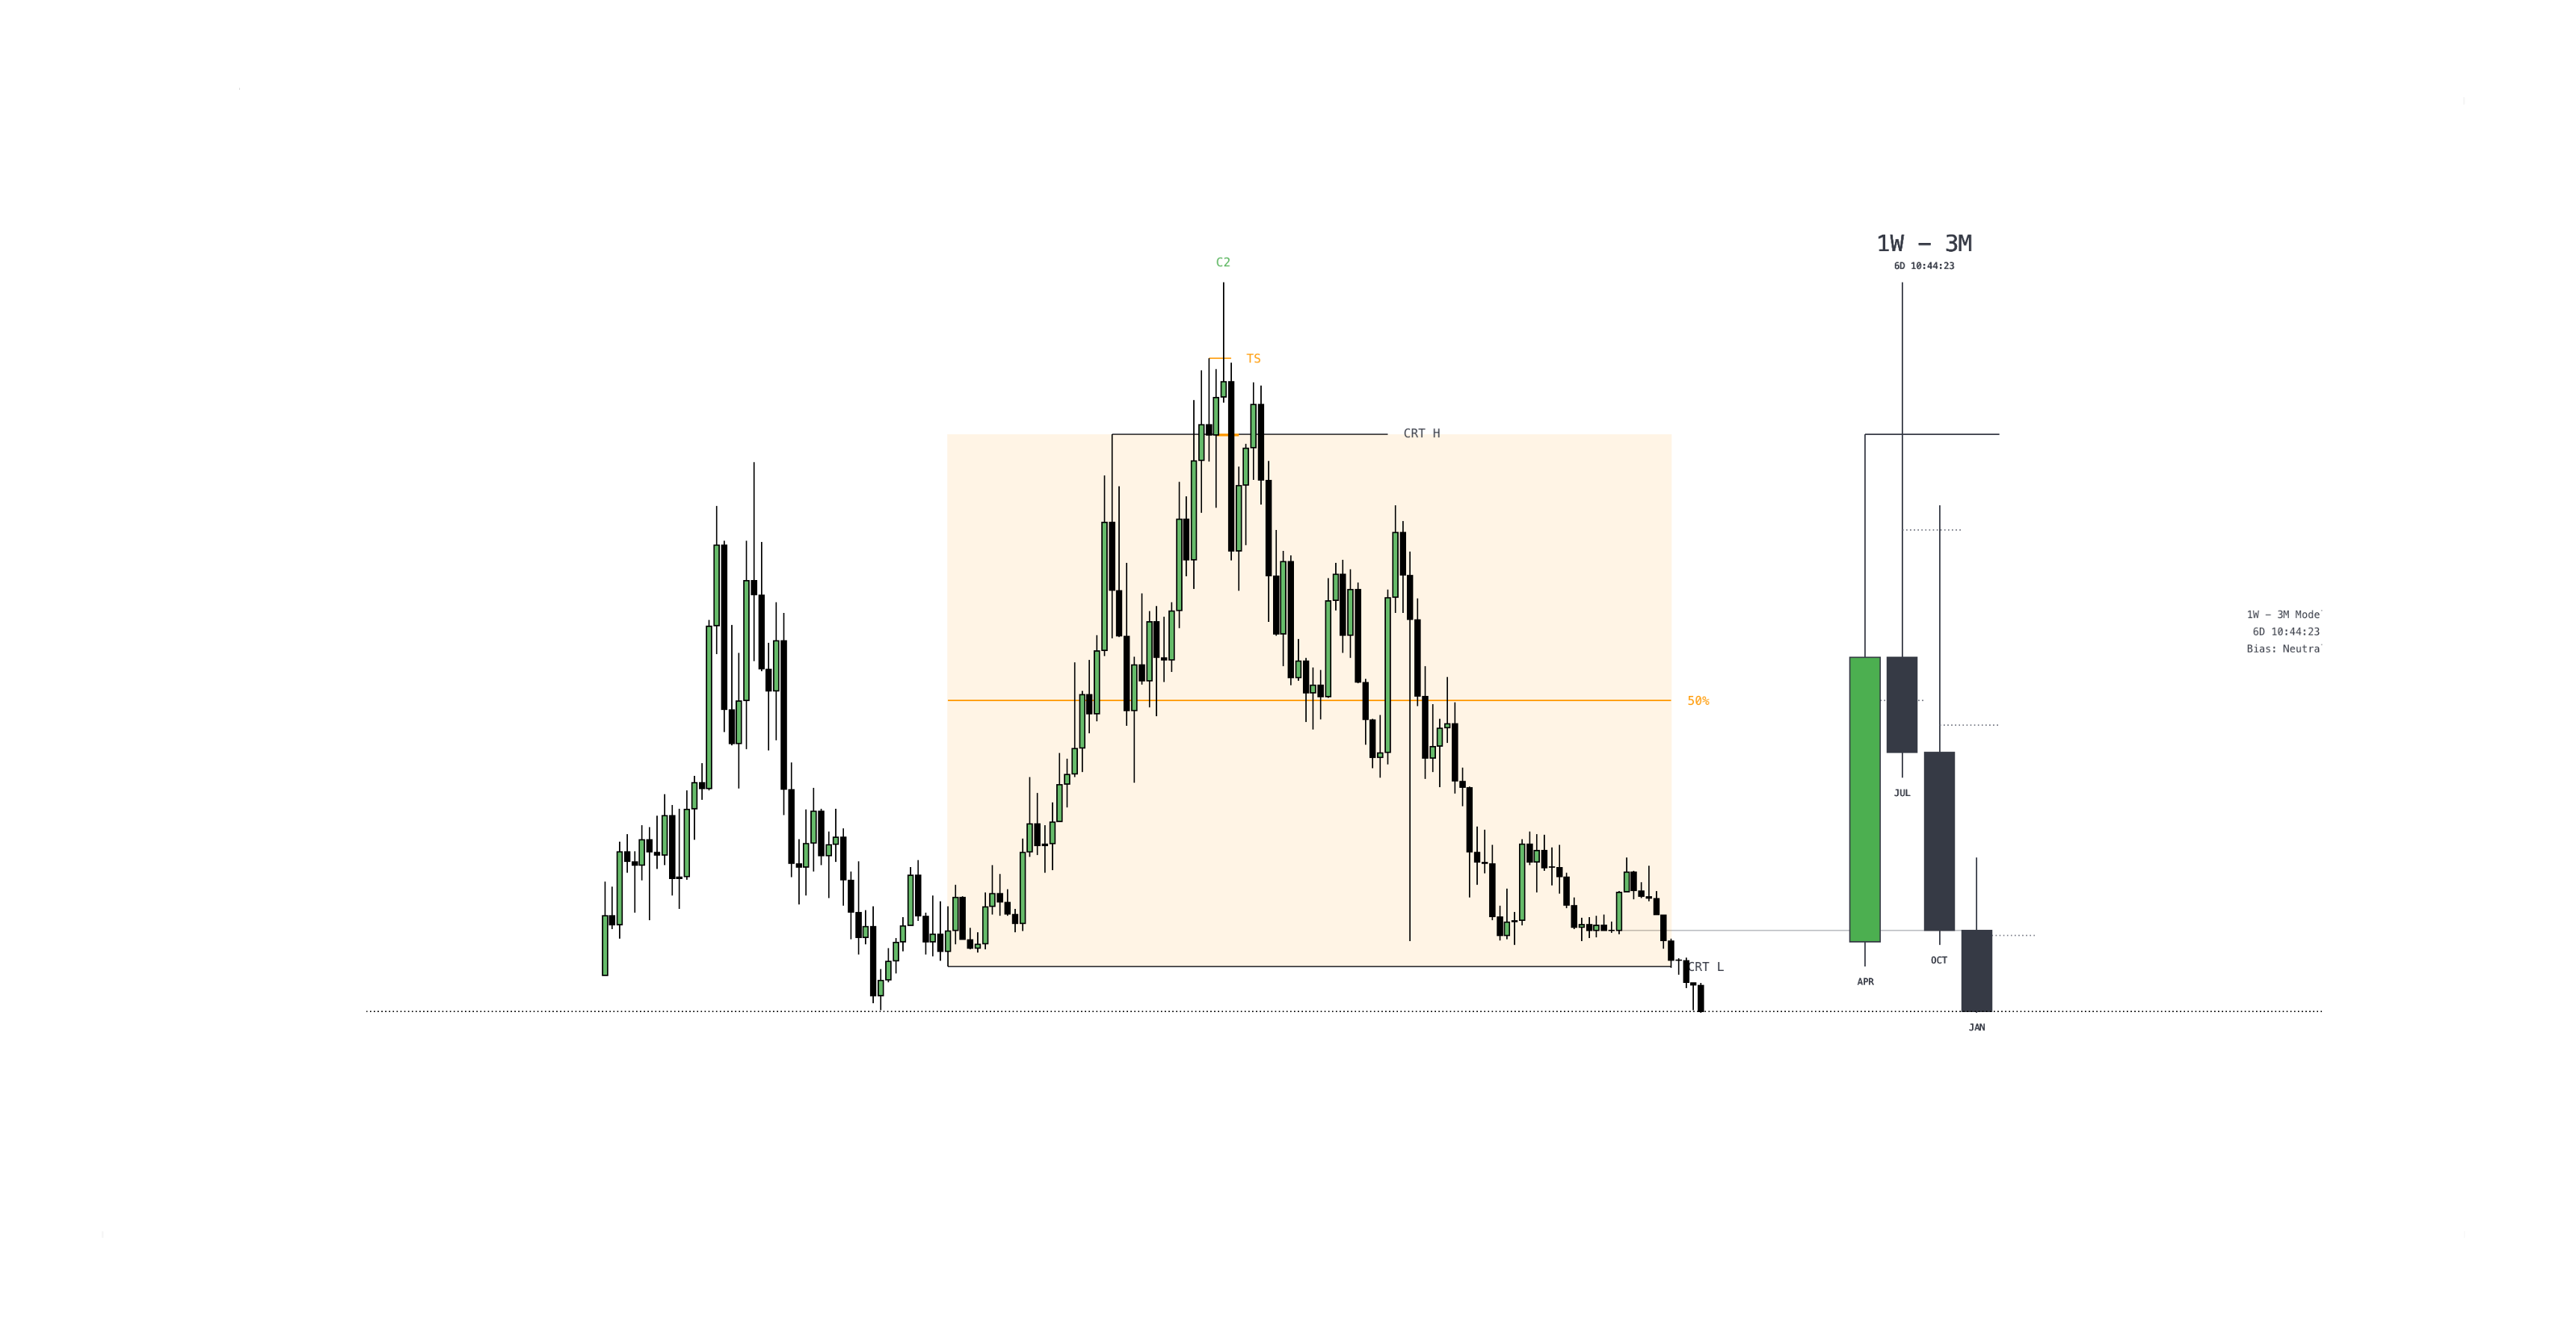
- Turtle Soup (TS): A clear sweep or "raid" of a significant liquidity pool (Previous Day High/Low, Session High/Low, or a major CRT-High/Low) must occur. This traps retail orders and generates the necessary liquidity for the institutional move.
- SMT Divergence: Confirmation from a correlated asset (e.g., EURUSD vs. GBPUSD or ES vs. NQ). If one asset sweeps the liquidity but the other fails to do so (divergence), it confirms institutional sponsorship and validates the reversal.
When a CRT manipulation phase (the wick) taps an HTF PD Array, performs a Turtle Soup sweep, and shows SMT, the probability of a successful distribution phase is at its peak.
5. Types of CRT Market Models
Types of CRT Market Models
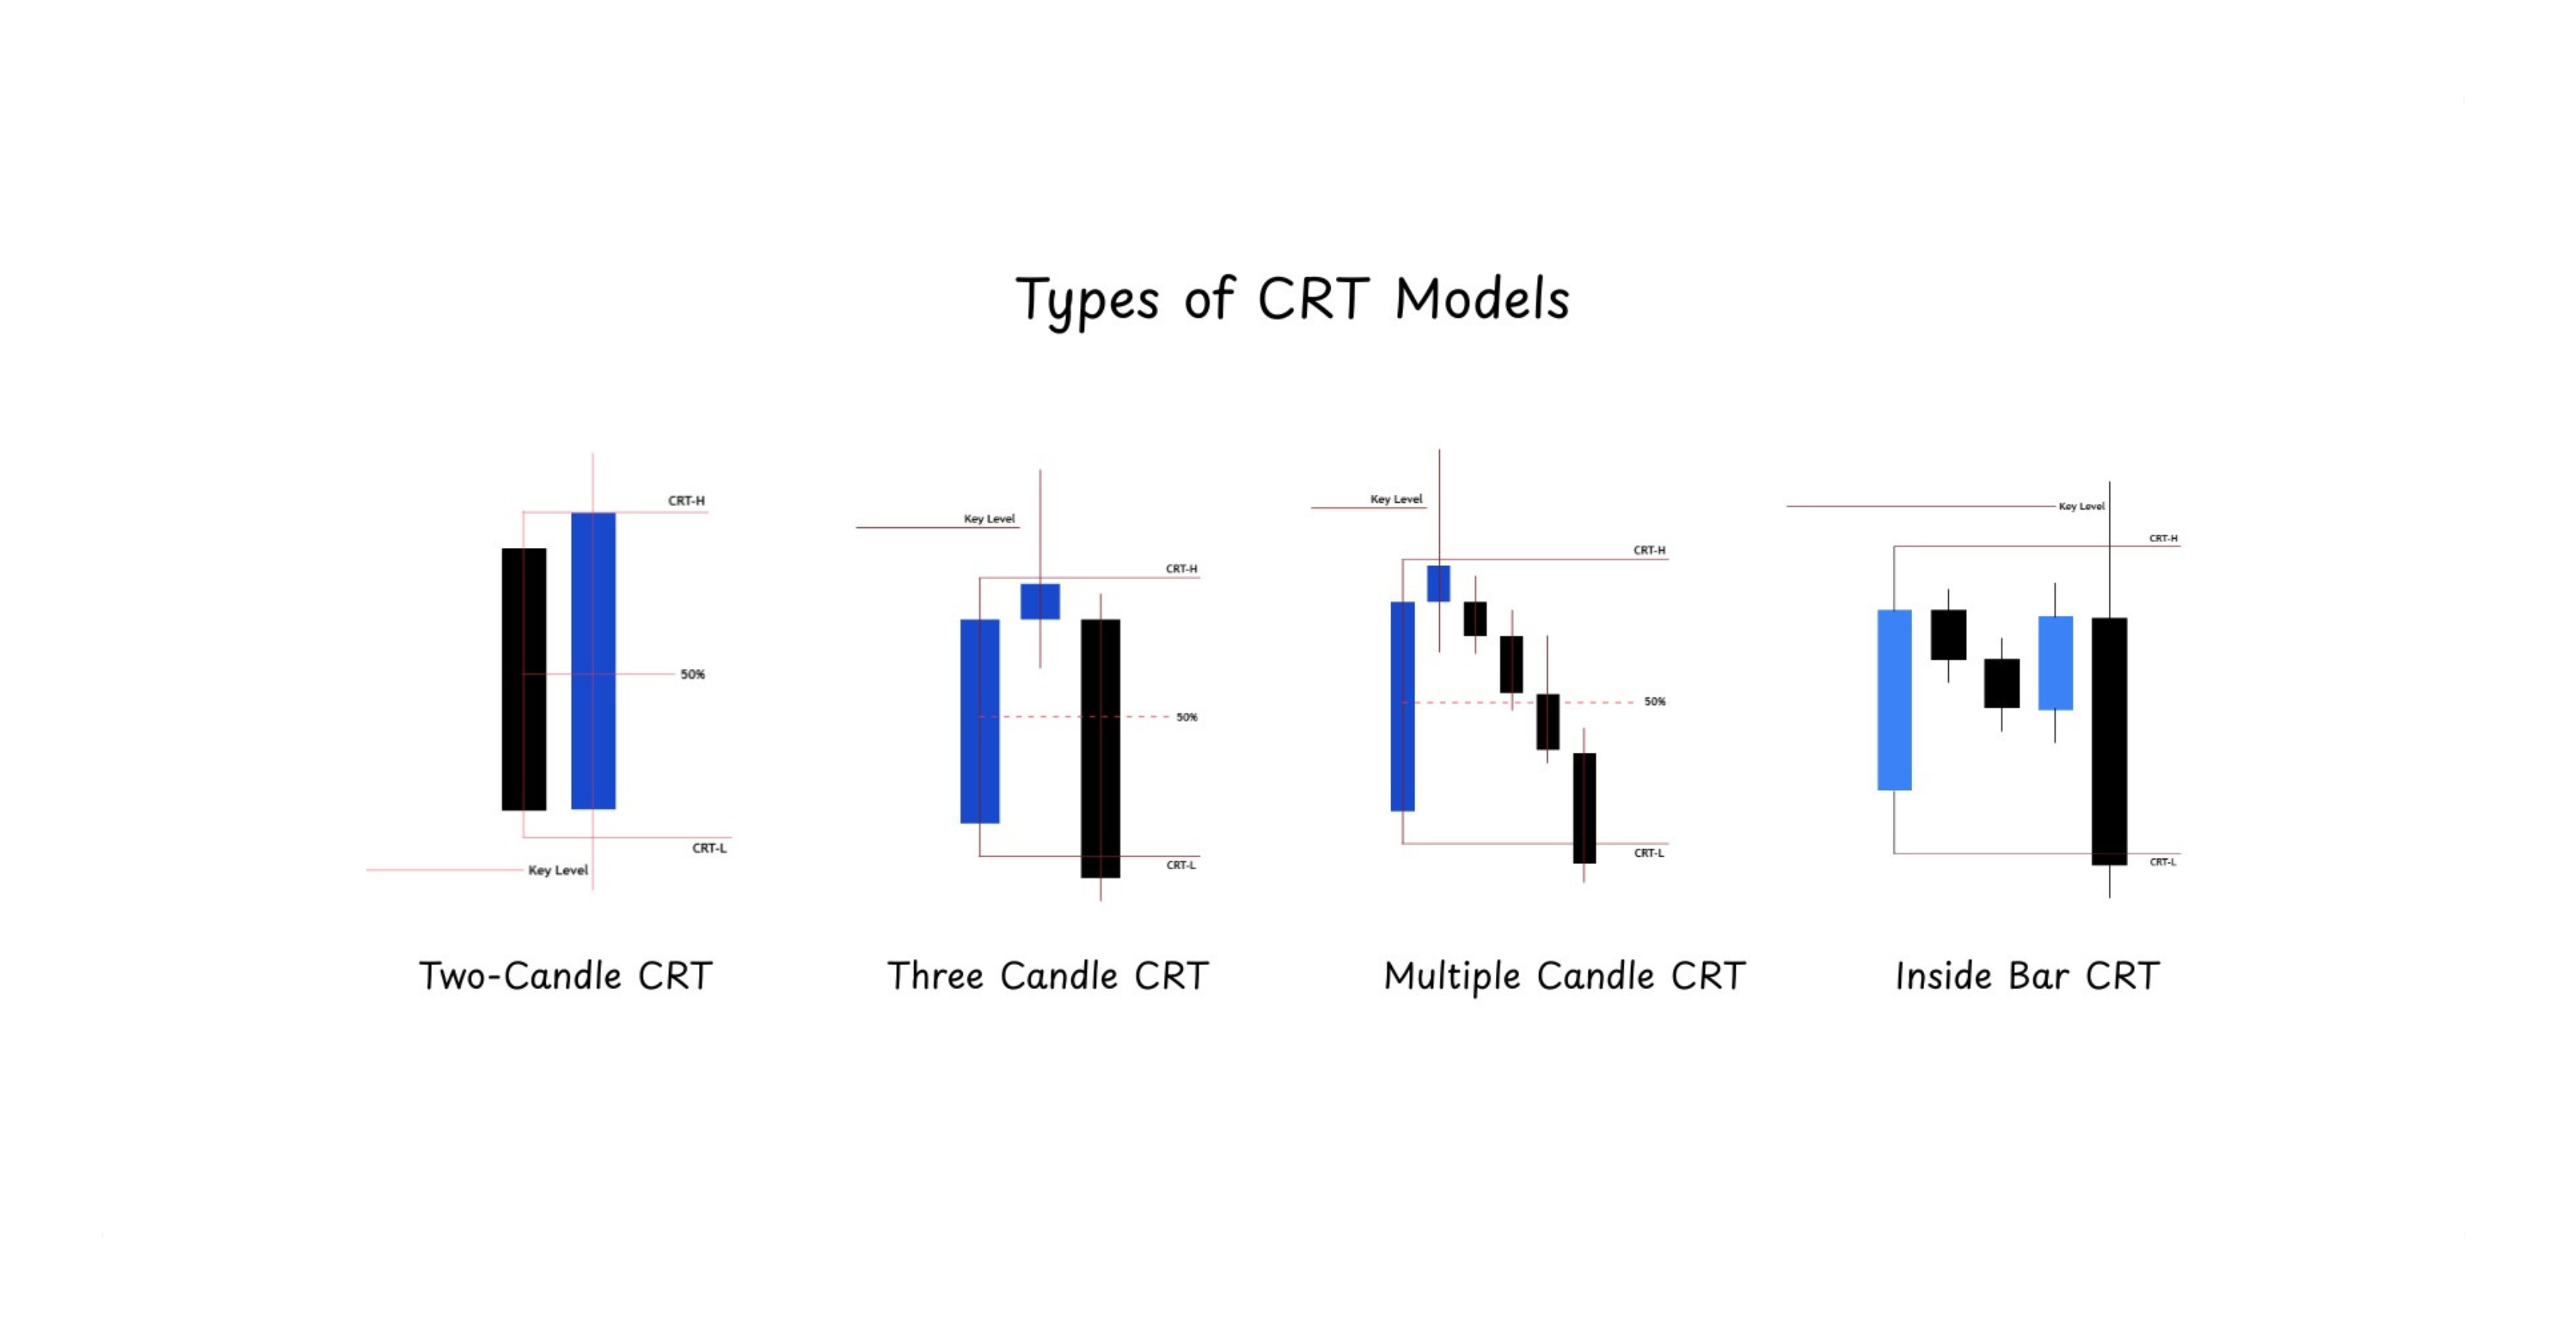
While the core AMD cycle remains the same, CRT setups can manifest in different architectural patterns. Understanding these "shapes" helps you identify the sweep more effectively:
- Two-Candle CRT: A high-momentum setup where the second candle immediately raids the first candle's range and reverses.
Two-Candle CRT
- Three-Candle CRT: The classic institutional reversal where Candle 1 sets the range, Candle 2 raids it, and Candle 3 confirms the move.
Three-Candle CRT
- Multiple Candle CRT: Occurs during extended consolidation where the manipulation phase spans several candles before distribution.
Multiple Candle CRT
- Inside Bar CRT: A specialized model where the raid happens within the range of a previous large candle, catching breakout traders off-guard.
6. The Execution: The Where-What-When Method
To simplify the CRT model for live trading, use the Where-What-When framework. This helps you filter out noise and focus only on high-probability setups.
The Where-What-When Method
WHERE do you want to get involved?
Before looking for a trade, you must identify a high-interest "anchor" zone. A premium CRT trade forms at:
- HTF PD Arrays: High-timeframe (1H, 4H, or Daily) Fair Value Gaps (FVG), Order Blocks, IFVG, or Breaker Blocks.
- Institutional Liquidity: Major levels such as Previous Day High/Low (PDH/PDL) or Previous Week High/Low (PWH/PWL).
- Key Opening Prices: Price reaction relative to the Midnight (00:00) or 8:30 AM NY Open.
WHAT do you want to see at your levels?
Once price reaches your "Where" zone, look for confirmation of institutional manipulation:
- CISD: A clear Change In State Of Delivery (CISD) on an LTF chart (1m/5m).
- Advanced Signals: Look for a Double Purge Sweep (clearing both CRT-High and Low) or CISD (Change in State of Delivery) confirmation.
WHEN do you prefer to get involved?
Timing is everything in CRT. High-probability windows are defined by specific hour clusters where institutional algorithms are most active:
1-Hour CRT Timeframes (Intra-day Precision):
- 02:00 – 04:00 NY (2-3-4 Cluster): Primary for London Open reversals.
- 07:00 – 09:00 NY (7-8-9 Cluster): Early AM New York momentum.
- 08:00 – 10:00 NY (8-9-10 Cluster): Standard NY session open and morning session top/bottom formation.
- 20:00 – 22:00 NY (8-9-10 PM Cluster): Late-day Asia session reversals.
4-Hour CRT Timeframes (Macro Cycle Alignment):
- 01:00 – 09:00 NY (1-5-9 AM Cluster): Capturing the main London/NY trend continuation.
- 13:00 – 21:00 NY (1-5-9 PM Cluster): Position building for the next day's Asia/London sessions.
- 02:00 – 10:00 NY (2-8-10 Cluster): Extended morning cycle for cross-session trading.
- 14:00 – 22:00 NY (2-6-10 Cluster): Afternoon/Evening manipulation for the next day's bias.
Avoid trading in "dead" zones or low-liquidity pre-market periods. Focus exclusively on these high-volatility windows where CRT setups are most likely to respect technical levels.
7. Phases of Price & Expansion
Label where you are in the cycle so your actions stay consistent:
- Reversal: The initial turn that shifts delivery.
- Expansion: The impulsive leg in the new direction.
- Retracement: A shallow pause/pullback during an expansion.
- Consolidation: Range digestion before the next impulsive move.
Rules for Expansion Candles
- Shallow Pullbacks: Expansions retrace lightly and move with intent. Don't fight the tape if pullbacks are non-existent.
- Half-Range Tendency: Bullish expansions typically operate in the upper half of the range; bearish expansions in the lower half.
- Context First: Always trade with the HTF bias. Don't trade isolated prints against the primary trend.
8. Advanced CRT Components
Once you master the basic AMD cycle, incorporate these precision tools:
Mean / Equilibrium (0.5)
The midpoint is your most objective filter for bias:
- Hold Upper Half: Bias higher. The upper half acts as support in bullish expansions.
- Hold Lower Half: Bias lower. The lower half acts as resistance in bearish expansions.
- Failure: If the respected half fails, flip your bias and look for the opposite side of the range.
Candle Wicks: The 50% Rule
Wicks carry the signal; bodies tell the story.
- The Midpoint Rule: Mark the wick's midpoint (0.5).
- Respect: If price holds the wick’s 0.5, it favors continuation against the wick’s direction (e.g., lower wick holds → price goes up).
- Disrespect: A close through the wick’s 0.5 often invalidates the signal and continues the original impulse.
Double Purge Sweeps
A high-volatility sweep where price breaks both the high and low of the previous candle before closing within the range. This signifies a massive liquidity clear-out.
9. Trading the Lifecycle: Candles 2 & 3
Wick size is your "fuel gauge"—it tells you how much expansion potential is left in the move.
Candle 2: The Reversal
- Small Wicks: Favor continued Expansion. Price has more "runway" to reach liquidity pools or standard deviation projections.
- Large Wicks: Favor Mean-Reversion. The range was "spent" building the wick. Expect price to revert toward the open or session extremes.
Candle 3: The Continuation
Candle 2 flips the bias; Candle 3 aims to capture the follow-through.
- When to trade: If Candle 2 has a small wick, you can trade it directly. If it has a large wick, wait for the Candle 2 close and trade Candle 3.
- Avoid Chasing: If Candle 2 already expanded aggressively, Candle 3 can become a "chase" into a retracement. Demand extra LTF confluence like protected swings or SMT.
10. Correlated Markets & SMT
Use related instruments (like ES vs NQ or EURUSD vs DXY) for confirmation. If your market shows a clean reversal but its correlation partner shows SMT divergence (failure to sweep a corresponding level), prioritize the cleaner setup. SMT helps you avoid "false" CISD signals and improves overall signal quality.
11. Why CRT is a Game-Changer
Most traders wait for the candle to close. CRT traders catch the formation of the wick. By understanding the AMD cycle, you are in alignment with how algorithms actually deliver price.
12. Key Rules for CRT Success
- Don’t Shotgun It: Trying to trade every instance will fail. Wait for high-confluence zones.
- Lead with Context: Set a clear HTF bias first, then sync your intermediate and lower timeframes to it.
- The "Judas Swing": A rapid move below the Open (bullish) or above the Open (bearish) is often the manipulation phase of the CRT model.
- Respect Invalidation: If the 0.5 Mean or a wick's 0.5 is disrespected, accept the invalidation and wait for the next setup.
Mastering Candle Range Theory allows you to trade with surgical precision, often catching the high or low of the day with minimal drawdown.