
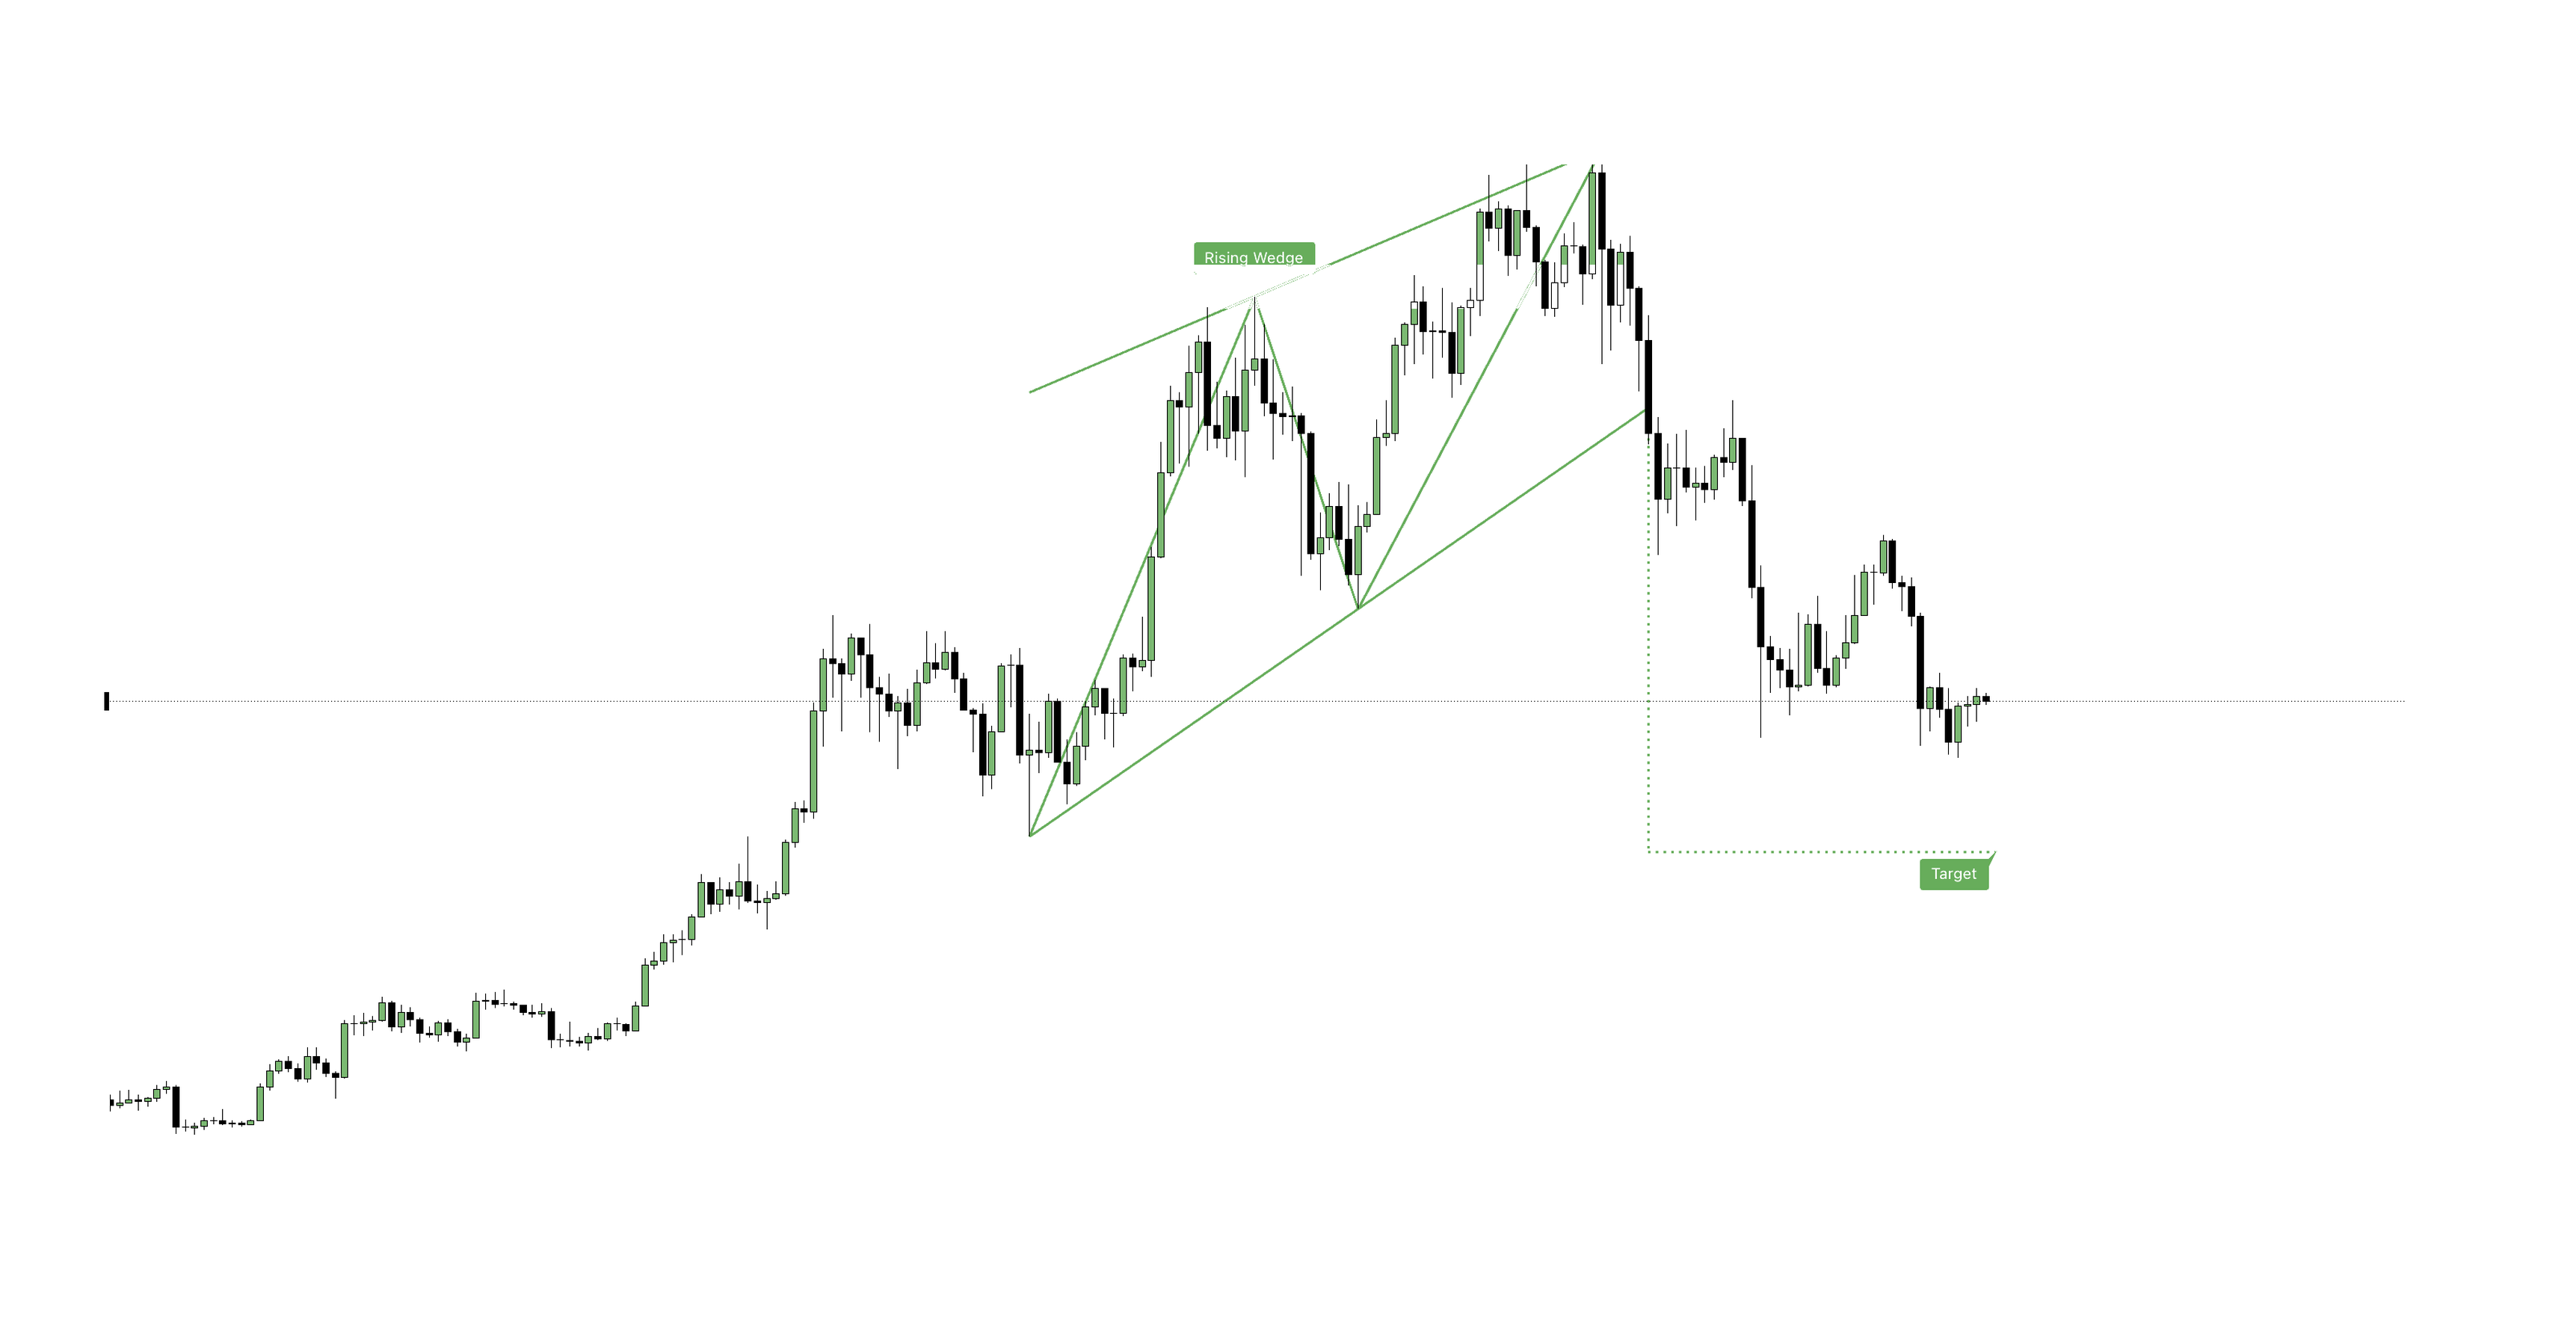
Price does not move in straight lines—it compresses, expands, retraces, and repeats. The geometric shapes price leaves behind are not random noise; they represent the real-time footprint of supply and demand struggling for control.
This comprehensive guide breaks down chart patterns through an institutional framework rather than treating them as isolated shapes. Recognizing a shape is only 10% of trading success; understanding the underlying context, invalidation criteria, and risk management accounts for the remaining 90%.
1. Why Chart Patterns Persist in Modern Markets
Every chart pattern tells a structural story about market positioning:
- Triangles: Signal volatility compression as buyers and sellers narrow their disagreement until liquidity breaks.
- Head & Shoulders: Illustrates institutional distribution where buying demand makes one final, exhausted push before sellers assume control.
- Harmonic Patterns: Highlight mathematical exhaustion zones defined by precise Fibonacci ratio relationships.
Patterns persist because institutional orderflow, retail stop placement, and algorithmic breakout mechanics repeat systematically across all timeframes. Institutions build and unwind positions around structural liquidity pivots; recognizing the pattern means understanding the institutional behavior beneath the price action.
2. Anatomy of a Valid Chart Pattern: The Due-Diligence Checklist
Before executing any pattern-based trade, evaluate the setup against this 7-point due-diligence checklist:
- Context & Structure: Align the pattern with higher-timeframe (HTF) trends or key dealing ranges. Isolated patterns lack statistical edge.
- Formation Quality: Verify clean swing pivots rather than forcing non-existent shapes onto messy price action.
- Volume Behavior: Look for volume contraction during pattern formation and aggressive volume expansion on the breakout.
- Time Symmetry: Ensure the consolidation phase is proportional in duration to the preceding move.
- Breakout Acceptance: Require a full candle body close beyond structural boundaries, not just a wick sweep.
- Defined Invalidation Level: Identify the precise price point that disproves the thesis before entering the position.
- Measured Objectives: Calculate projected targets based on pattern geometry to establish favorable risk-to-reward ratios.
If a trade setup fails to meet all seven criteria, it remains a random shape rather than a tradable edge.
3. The Major Pattern Families
Technical patterns fall into distinct categories, each operating under specific structural logic and failure modes.
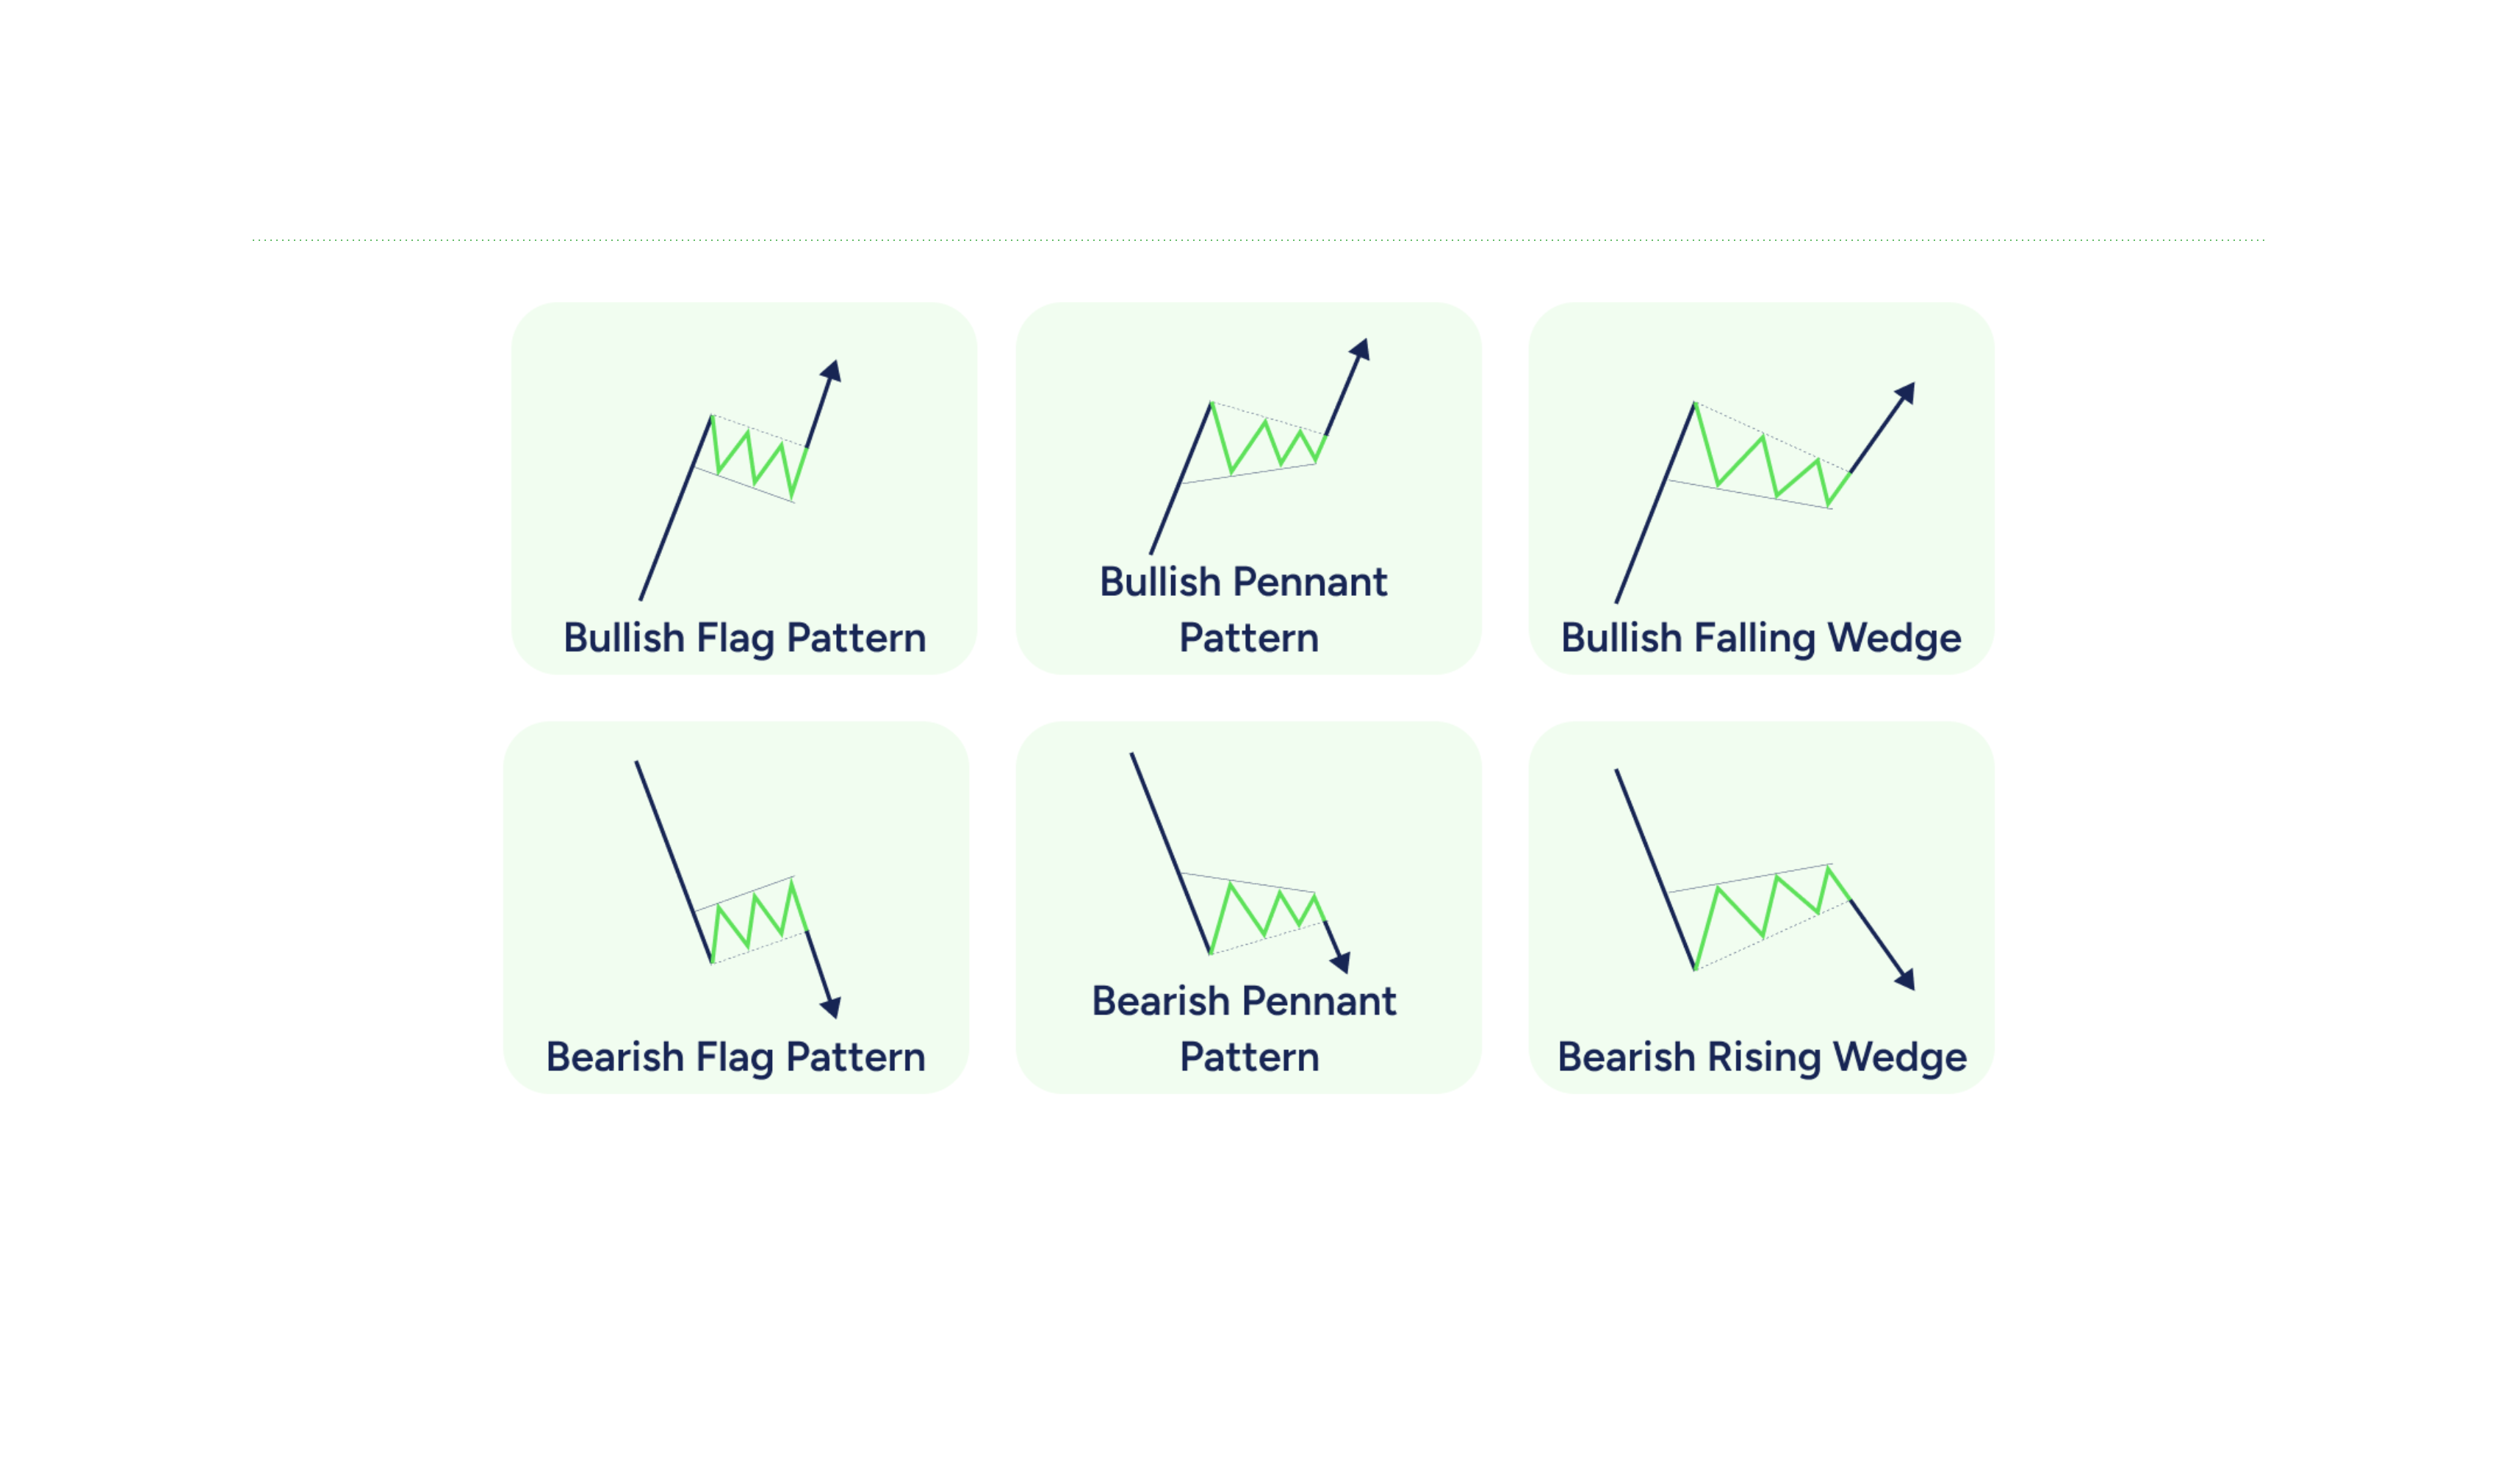
A. Classical Continuation Patterns
Continuation setups develop mid-trend, representing temporary market consolidation before price resumes the prevailing direction.
- Flags & Pennants: Tight consolidations following sharp impulse moves.
- Rectangles: Horizontal trading ranges reflecting balance between buyers and sellers.
- Ascending & Descending Triangles: Directional compression patterns pressing against flat horizontal levels.
- Continuation Wedges: Slanted consolidations resolving in favor of the primary trend.
Classical Continuation Patterns
B. Classical Reversal Patterns
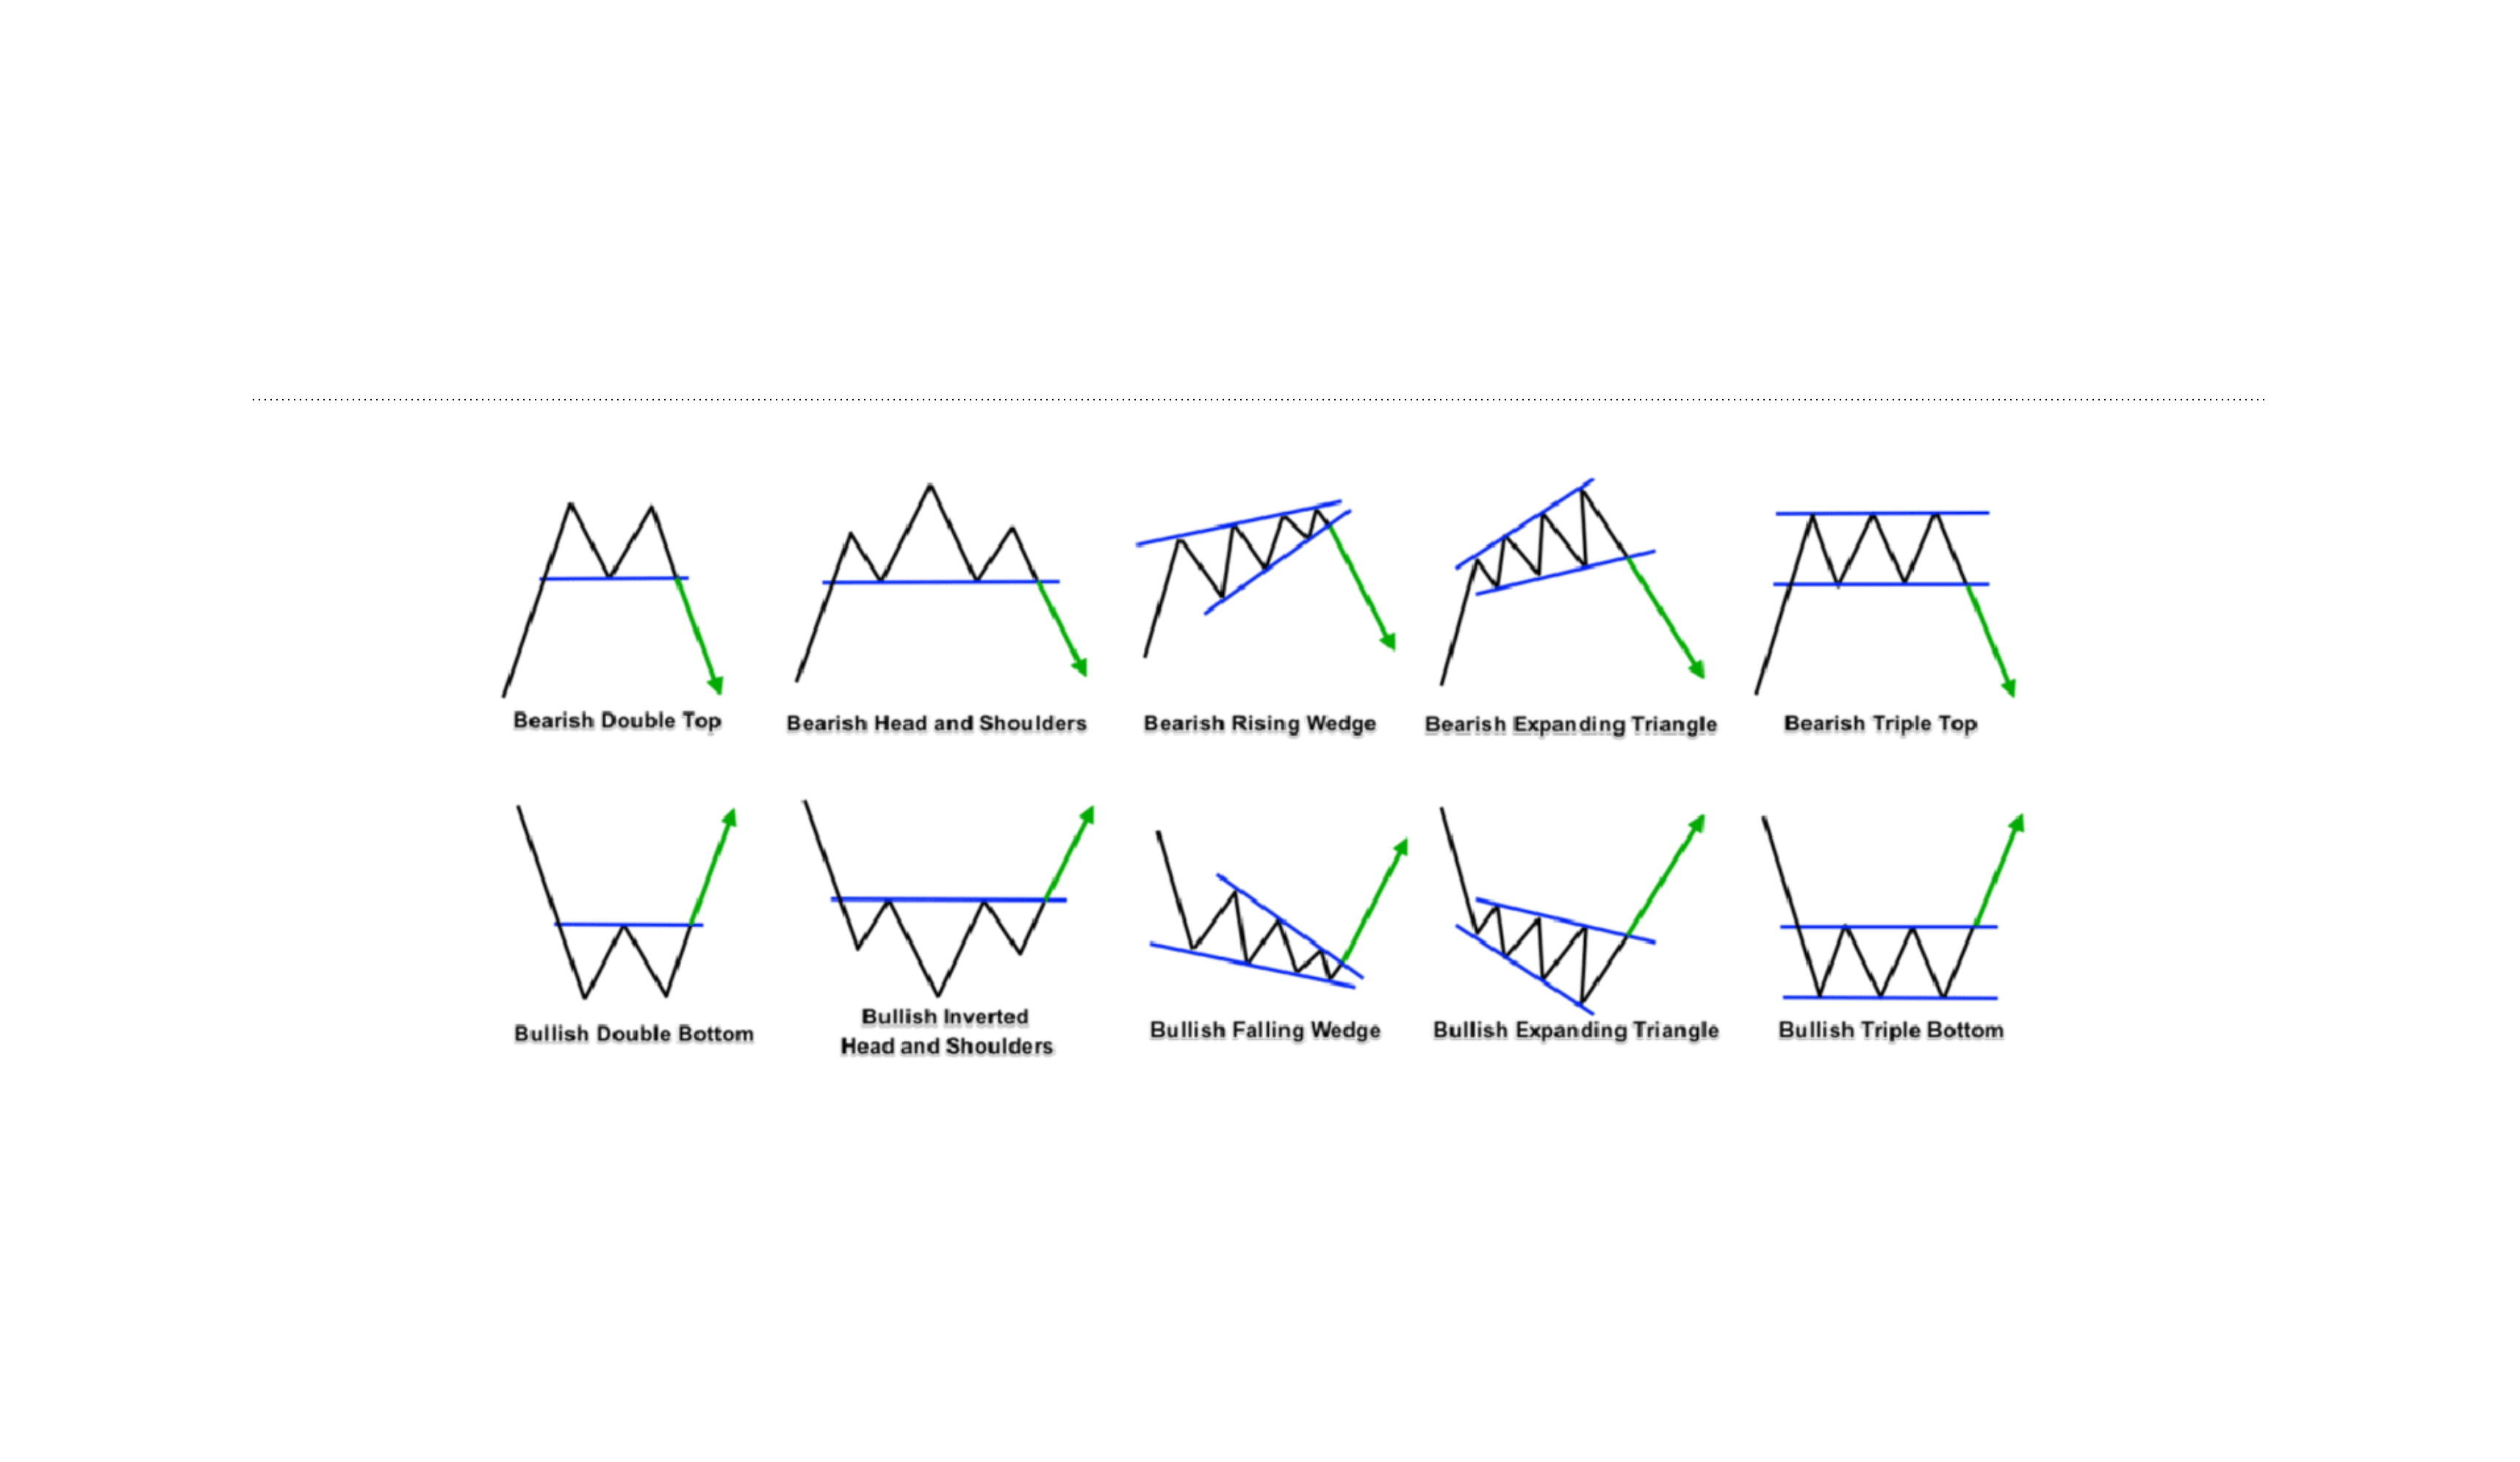
Reversal patterns mark a shift in market control following extended trends.
- Head & Shoulders / Inverse Head & Shoulders: Three-pivot structures featuring a prominent central peak or trough.
- Double Tops & Double Bottoms: Rejections of major price extremes.
- Triple Tops & Triple Bottoms: Extended rejections demonstrating strong structural support or resistance.
- Rounding Tops & Saucer Bottoms: Gradual sentiment shifts over extended timeframes.
- Cup & Handle: Rounded accumulation bases followed by tight consolidation handles.
- Diamond Formations: Expanding-to-contracting volatility structures signaling major trend shifts.
Classical Reversal Patterns
C. Harmonic Patterns
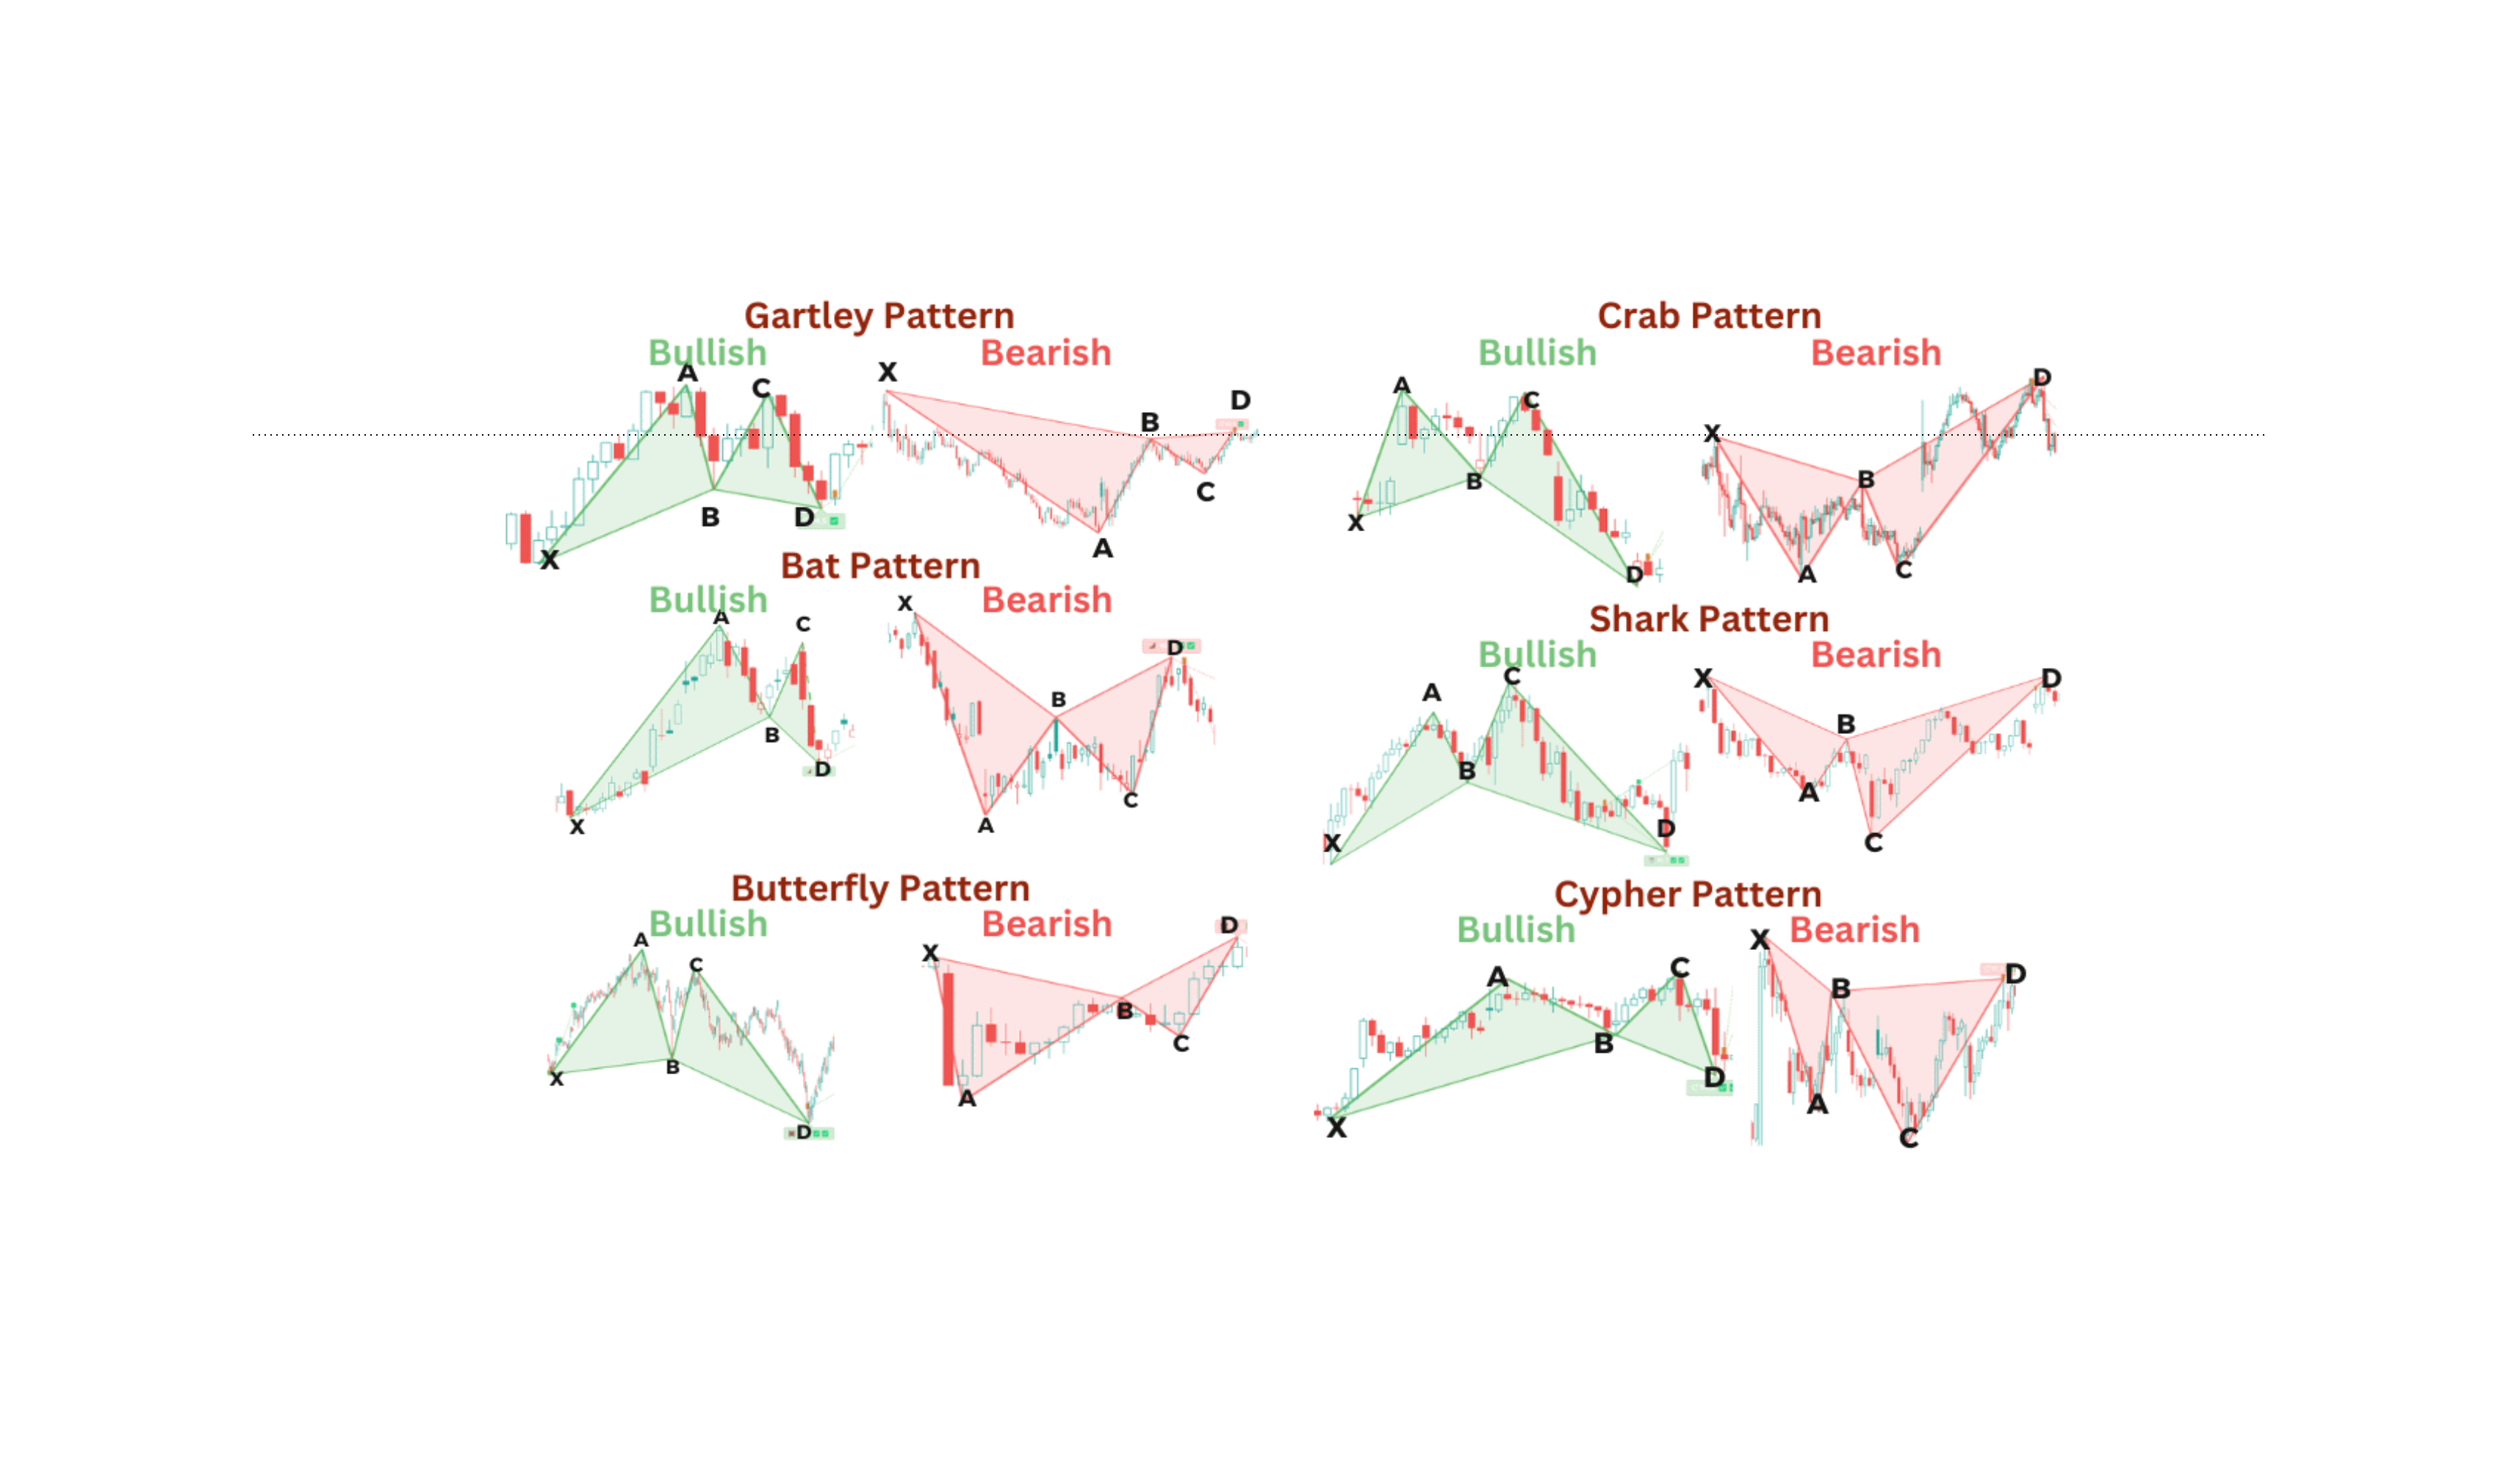
Harmonics utilize Fibonacci ratio relationships across swing legs (XA, AB, BC, CD) to project precise Potential Reversal Zones (PRZ).
- Gartley & Bat Patterns: Primary harmonic structures targeting 78.6% and 88.6% retracements.
- Butterfly & Crab Patterns: Extension patterns reaching 127.2% and 161.8% Fibonacci projections.
- Shark & Cypher Patterns: Advanced harmonic structures built on unconventional ratio alignments.
- ABCD & Three-Drive Formations: Symmetrical impulse-reversal sequences.
Harmonic patterns demand strict mathematical alignment; loose ratio approximations invalidate the setup.
Harmonic Patterns
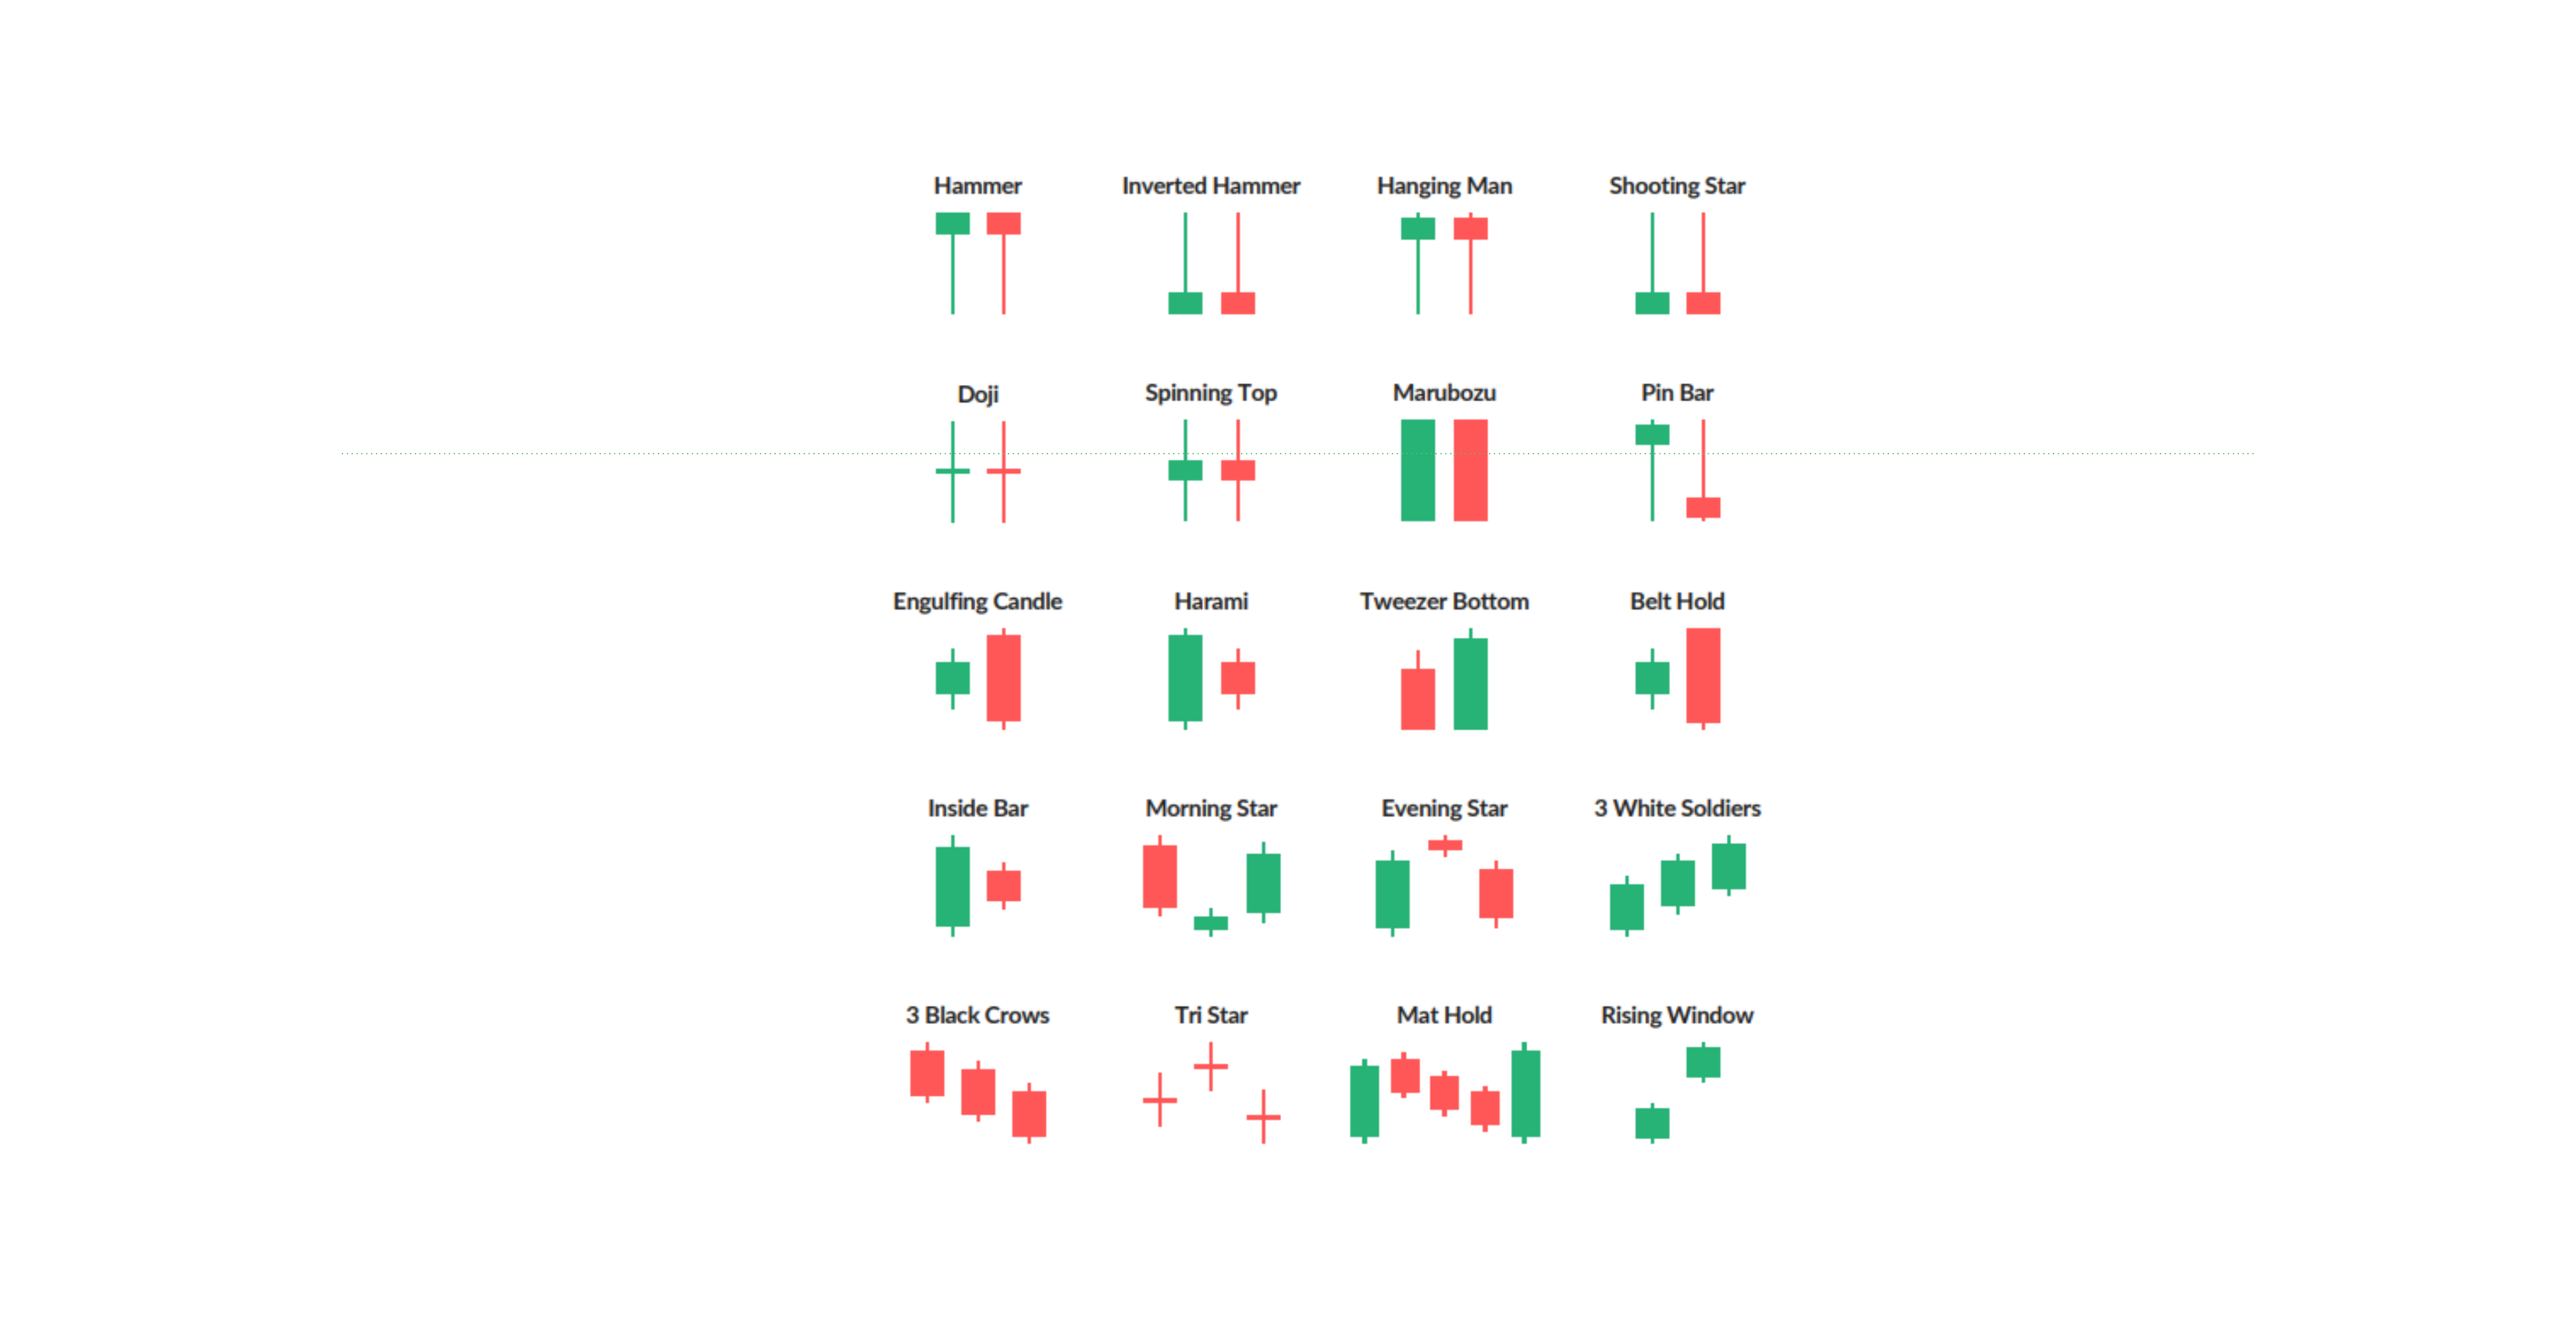
D. Candlestick Patterns
Short-term, few-bar formations that capture immediate supply and demand dynamics at key levels:
- Engulfing Patterns: Strong directional shifts overwhelming prior candle ranges.
- Dojis & Spinning Tops: Neutral candles indicating indecision or momentum loss.
- Hammers & Shooting Stars: Single-bar rejection wicks at key structural boundaries.
- Morning & Evening Stars: Three-bar reversal sequences signaling trend exhaustion.
- Dark Cloud Cover & Piercing Lines: Counter-trend momentum shifts across key levels.
Candlesticks serve as execution triggers when aligned with macro market structure rather than standalone indicators.
Candlestick Patterns
E. Wyckoff Structural Schematics
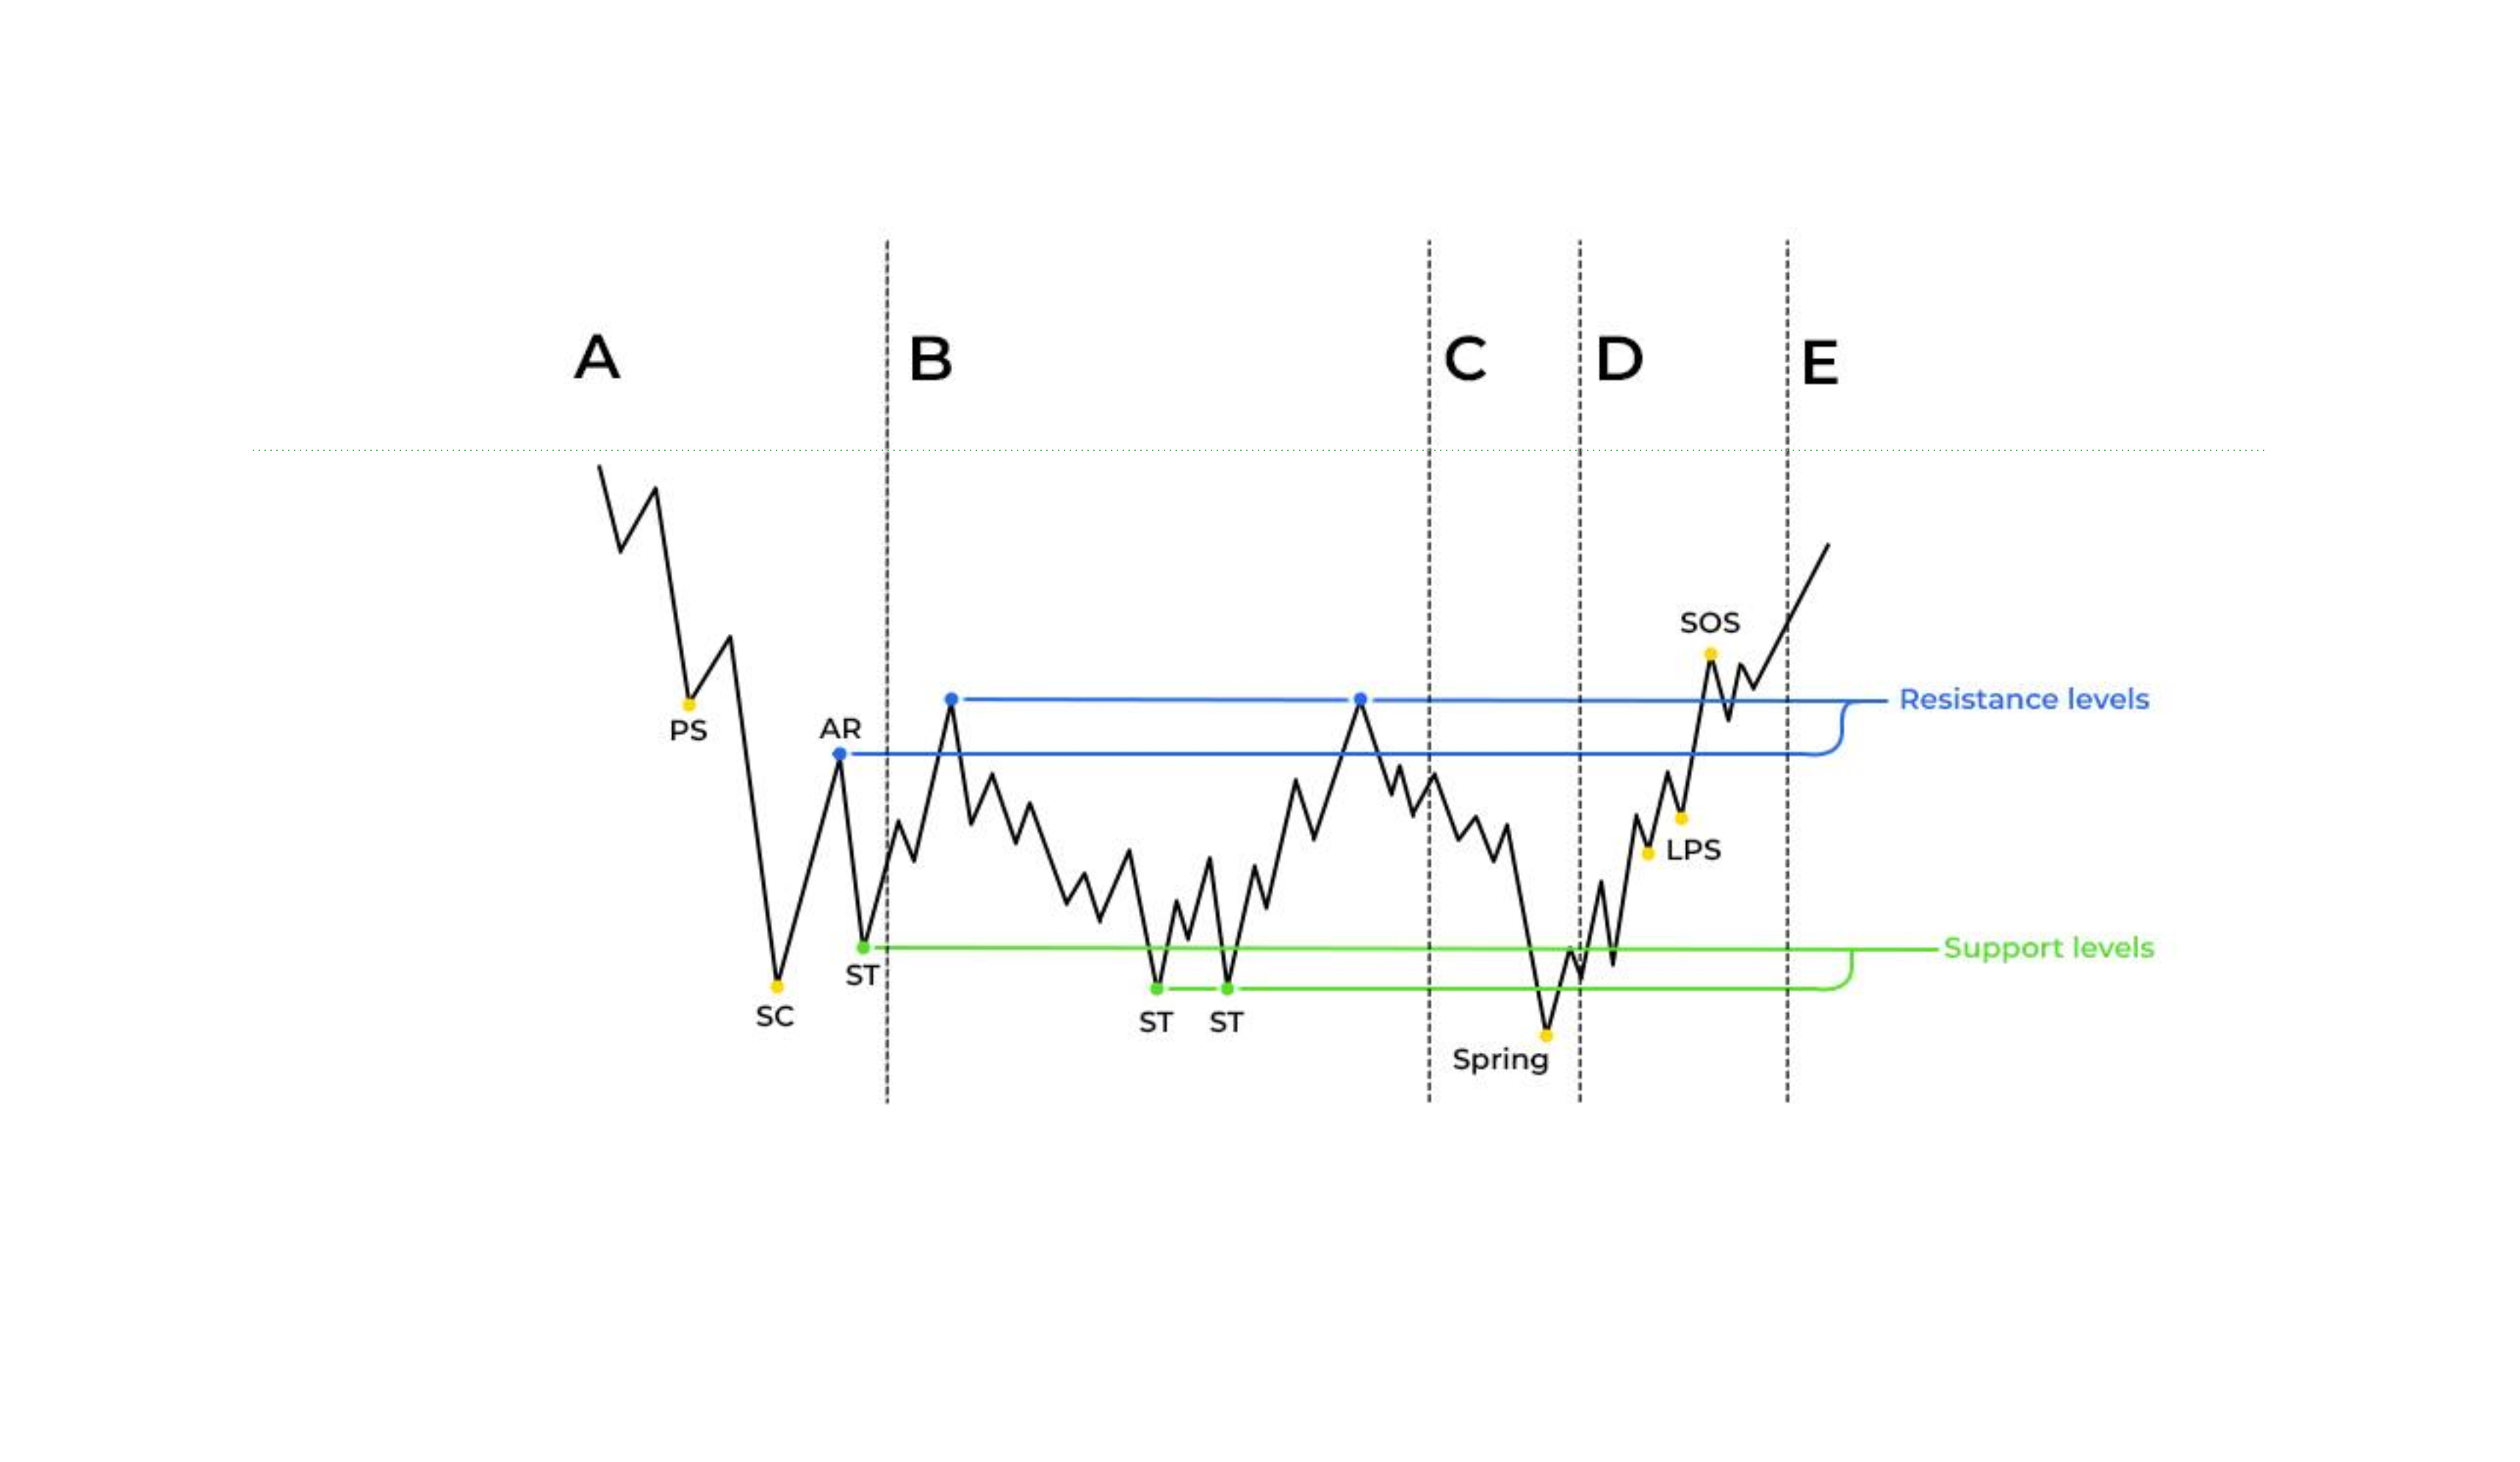
Wyckoff schematics detail the lifecycle of institutional market campaigns:
- Accumulation Schematics: Smart money position building characterized by Selling Climax (SC), Automatic Rally (AR), Secondary Test (ST), Spring, and Sign of Strength (SOS).
- Distribution Schematics: Institutional unwinding featuring Buying Climax (BC), Upthrust (UT), Upthrust After Distribution (UTAD), and Sign of Weakness (SOW).
- Re-accumulation & Re-distribution Ranges: Mid-trend positioning cycles.
Wyckoff Structural Patterns
F. Smart Money Concepts (SMC) & ICT Patterns
Modern orderflow reading reframes classical patterns around institutional liquidity pools:
- Order Blocks & Breaker Blocks: Institutional footprint zones driving aggressive price expansion.
- Fair Value Gaps (FVG): Imbalance voids created by one-sided market orders.
- Liquidity Sweeps & Stop Runs: Deliberate price spikes tapping stops positioned outside key swing points.
- Change of Character (CHoCH) & Break of Structure (BOS): Shifts in market delivery state.
- Optimal Trade Entry (OTE): High-confluence Fibonacci retracement zones (62% - 79%).
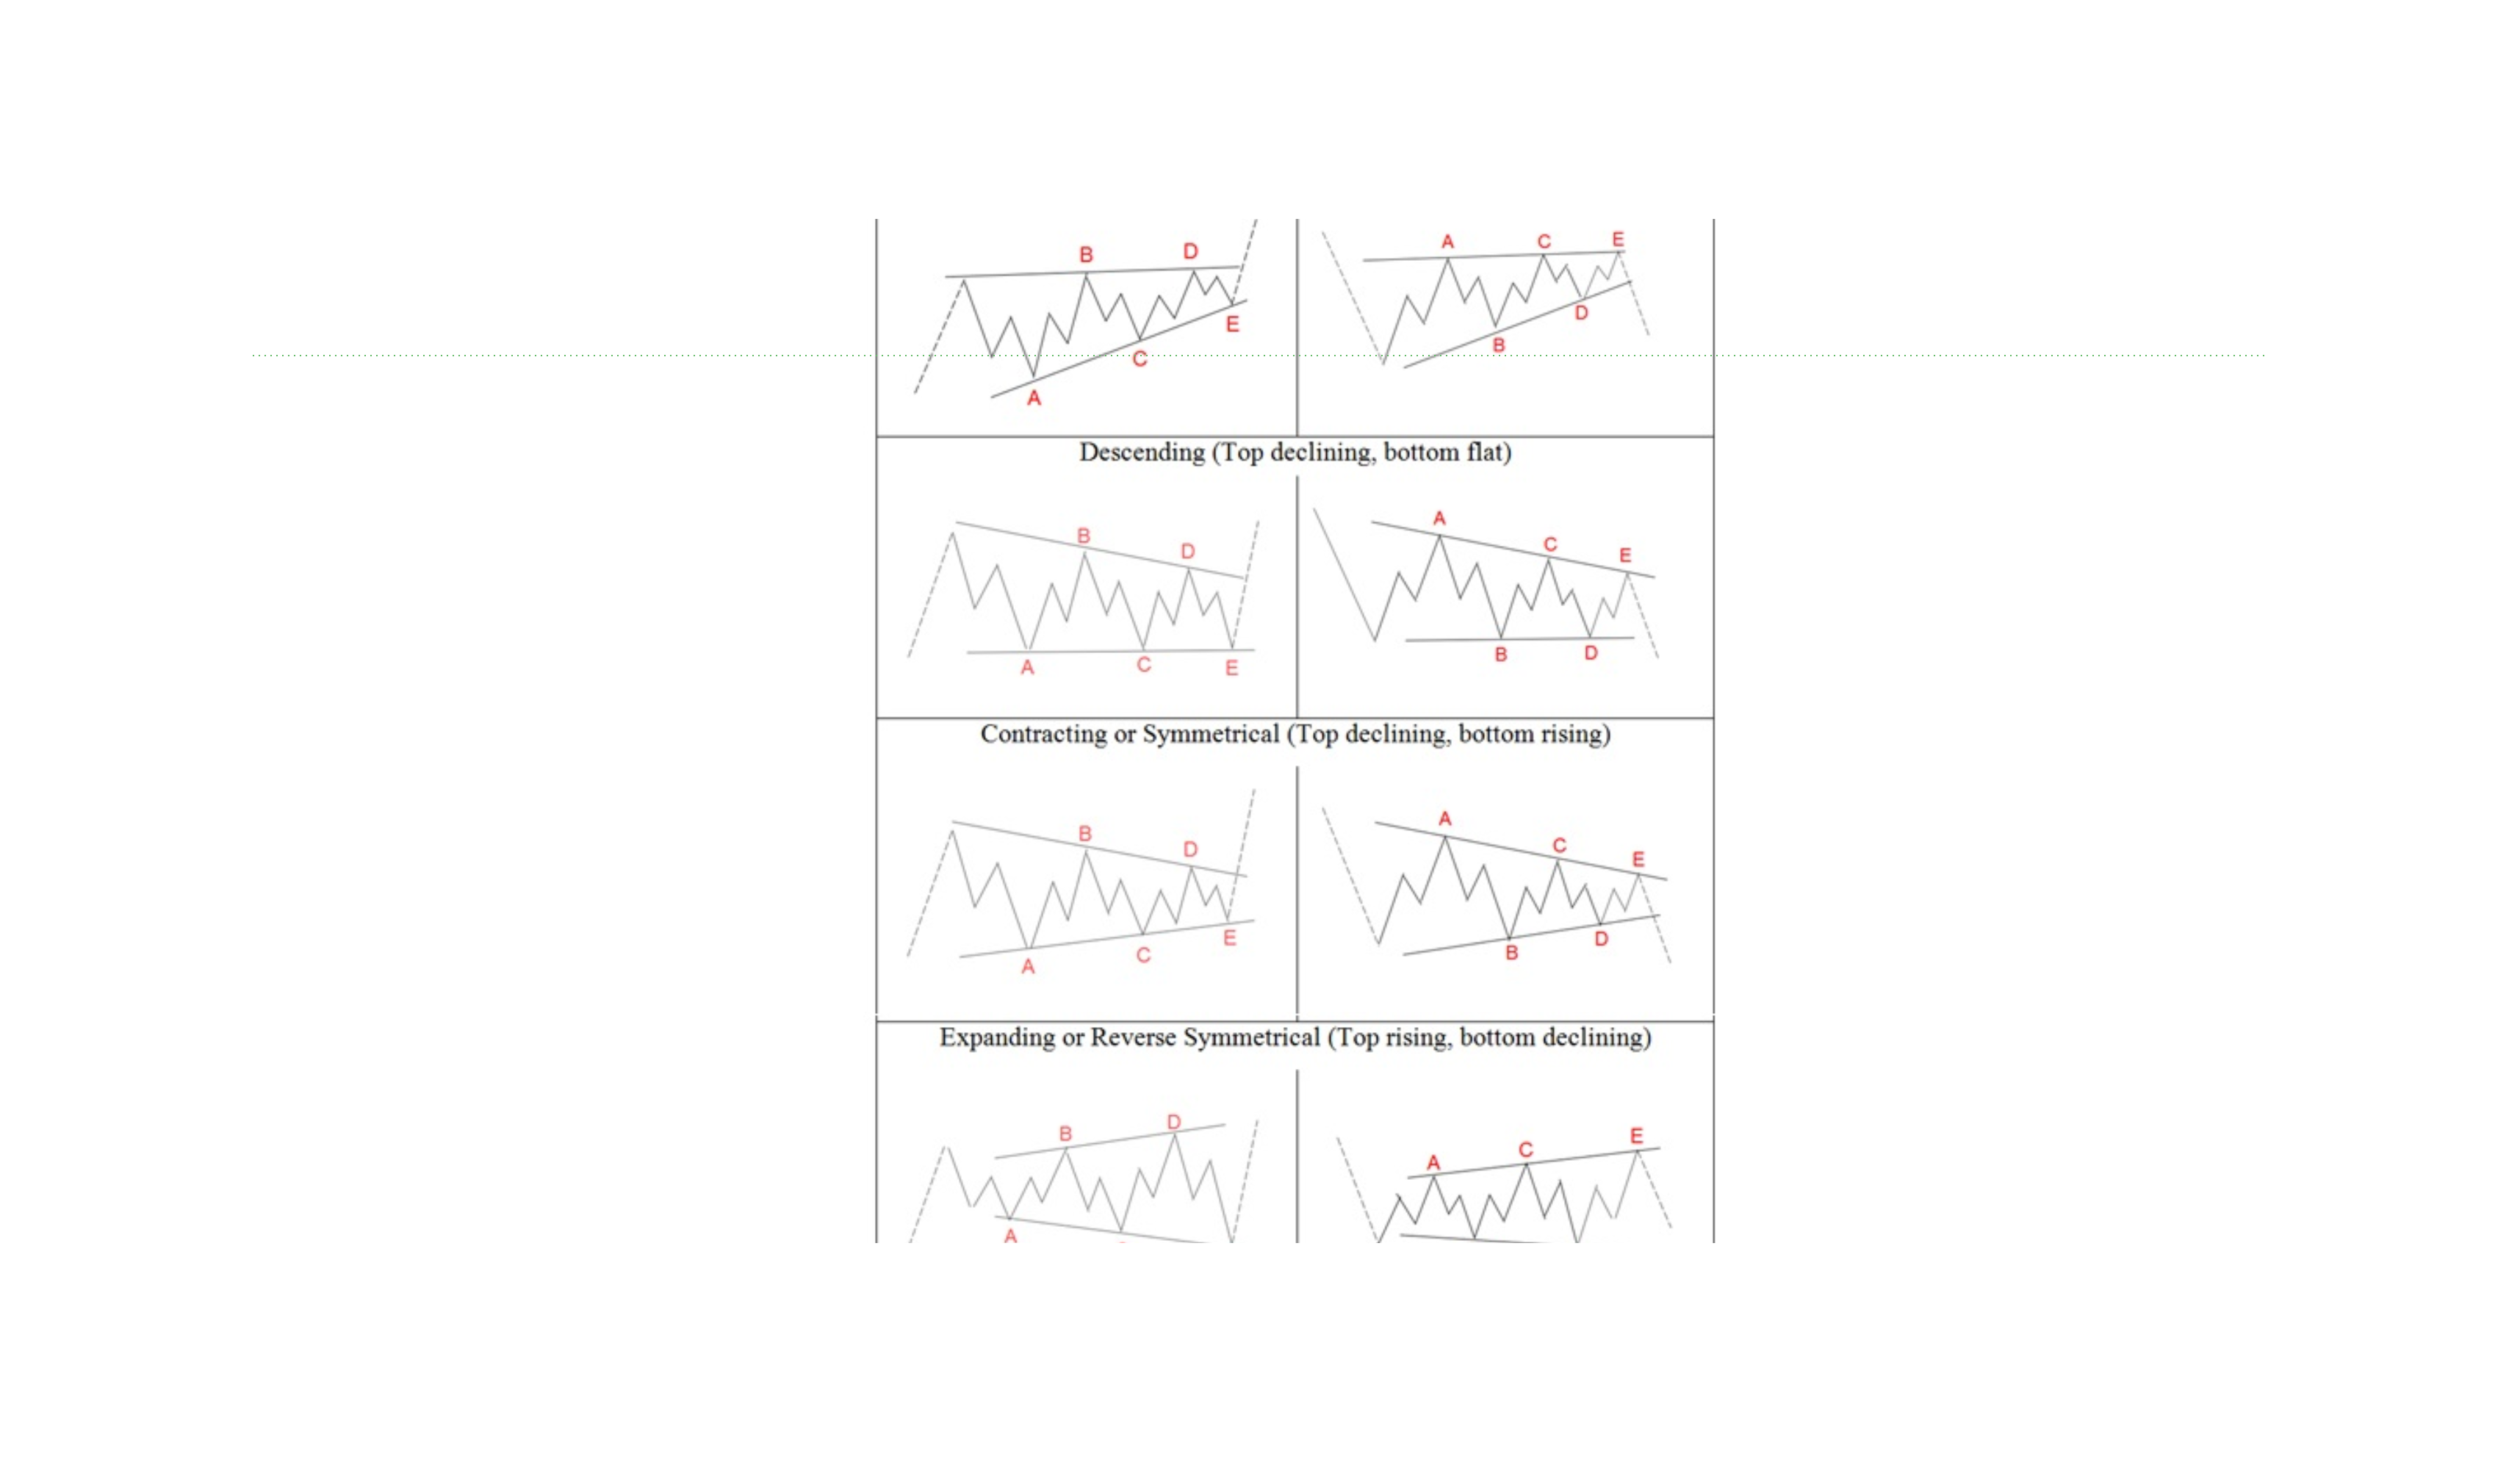
G. Elliott Wave Patterns
Fractal wave structures mapping market sentiment cycles:
- Impulse Waves: 5-wave motive sequences moving in the primary direction.
- Corrective Waves: 3-wave (ABC) counter-trend structures (Zigzag, Flat, Triangle).
- Diagonal Triangles: Contracted motive waves forming at trend beginnings (Leading) or endings (Ending).
Elliott Wave Patterns
4. Core Chart Patterns Traded by Professional Desks
While dozens of patterns exist, institutional desks focus on a core group of high-probability setups:
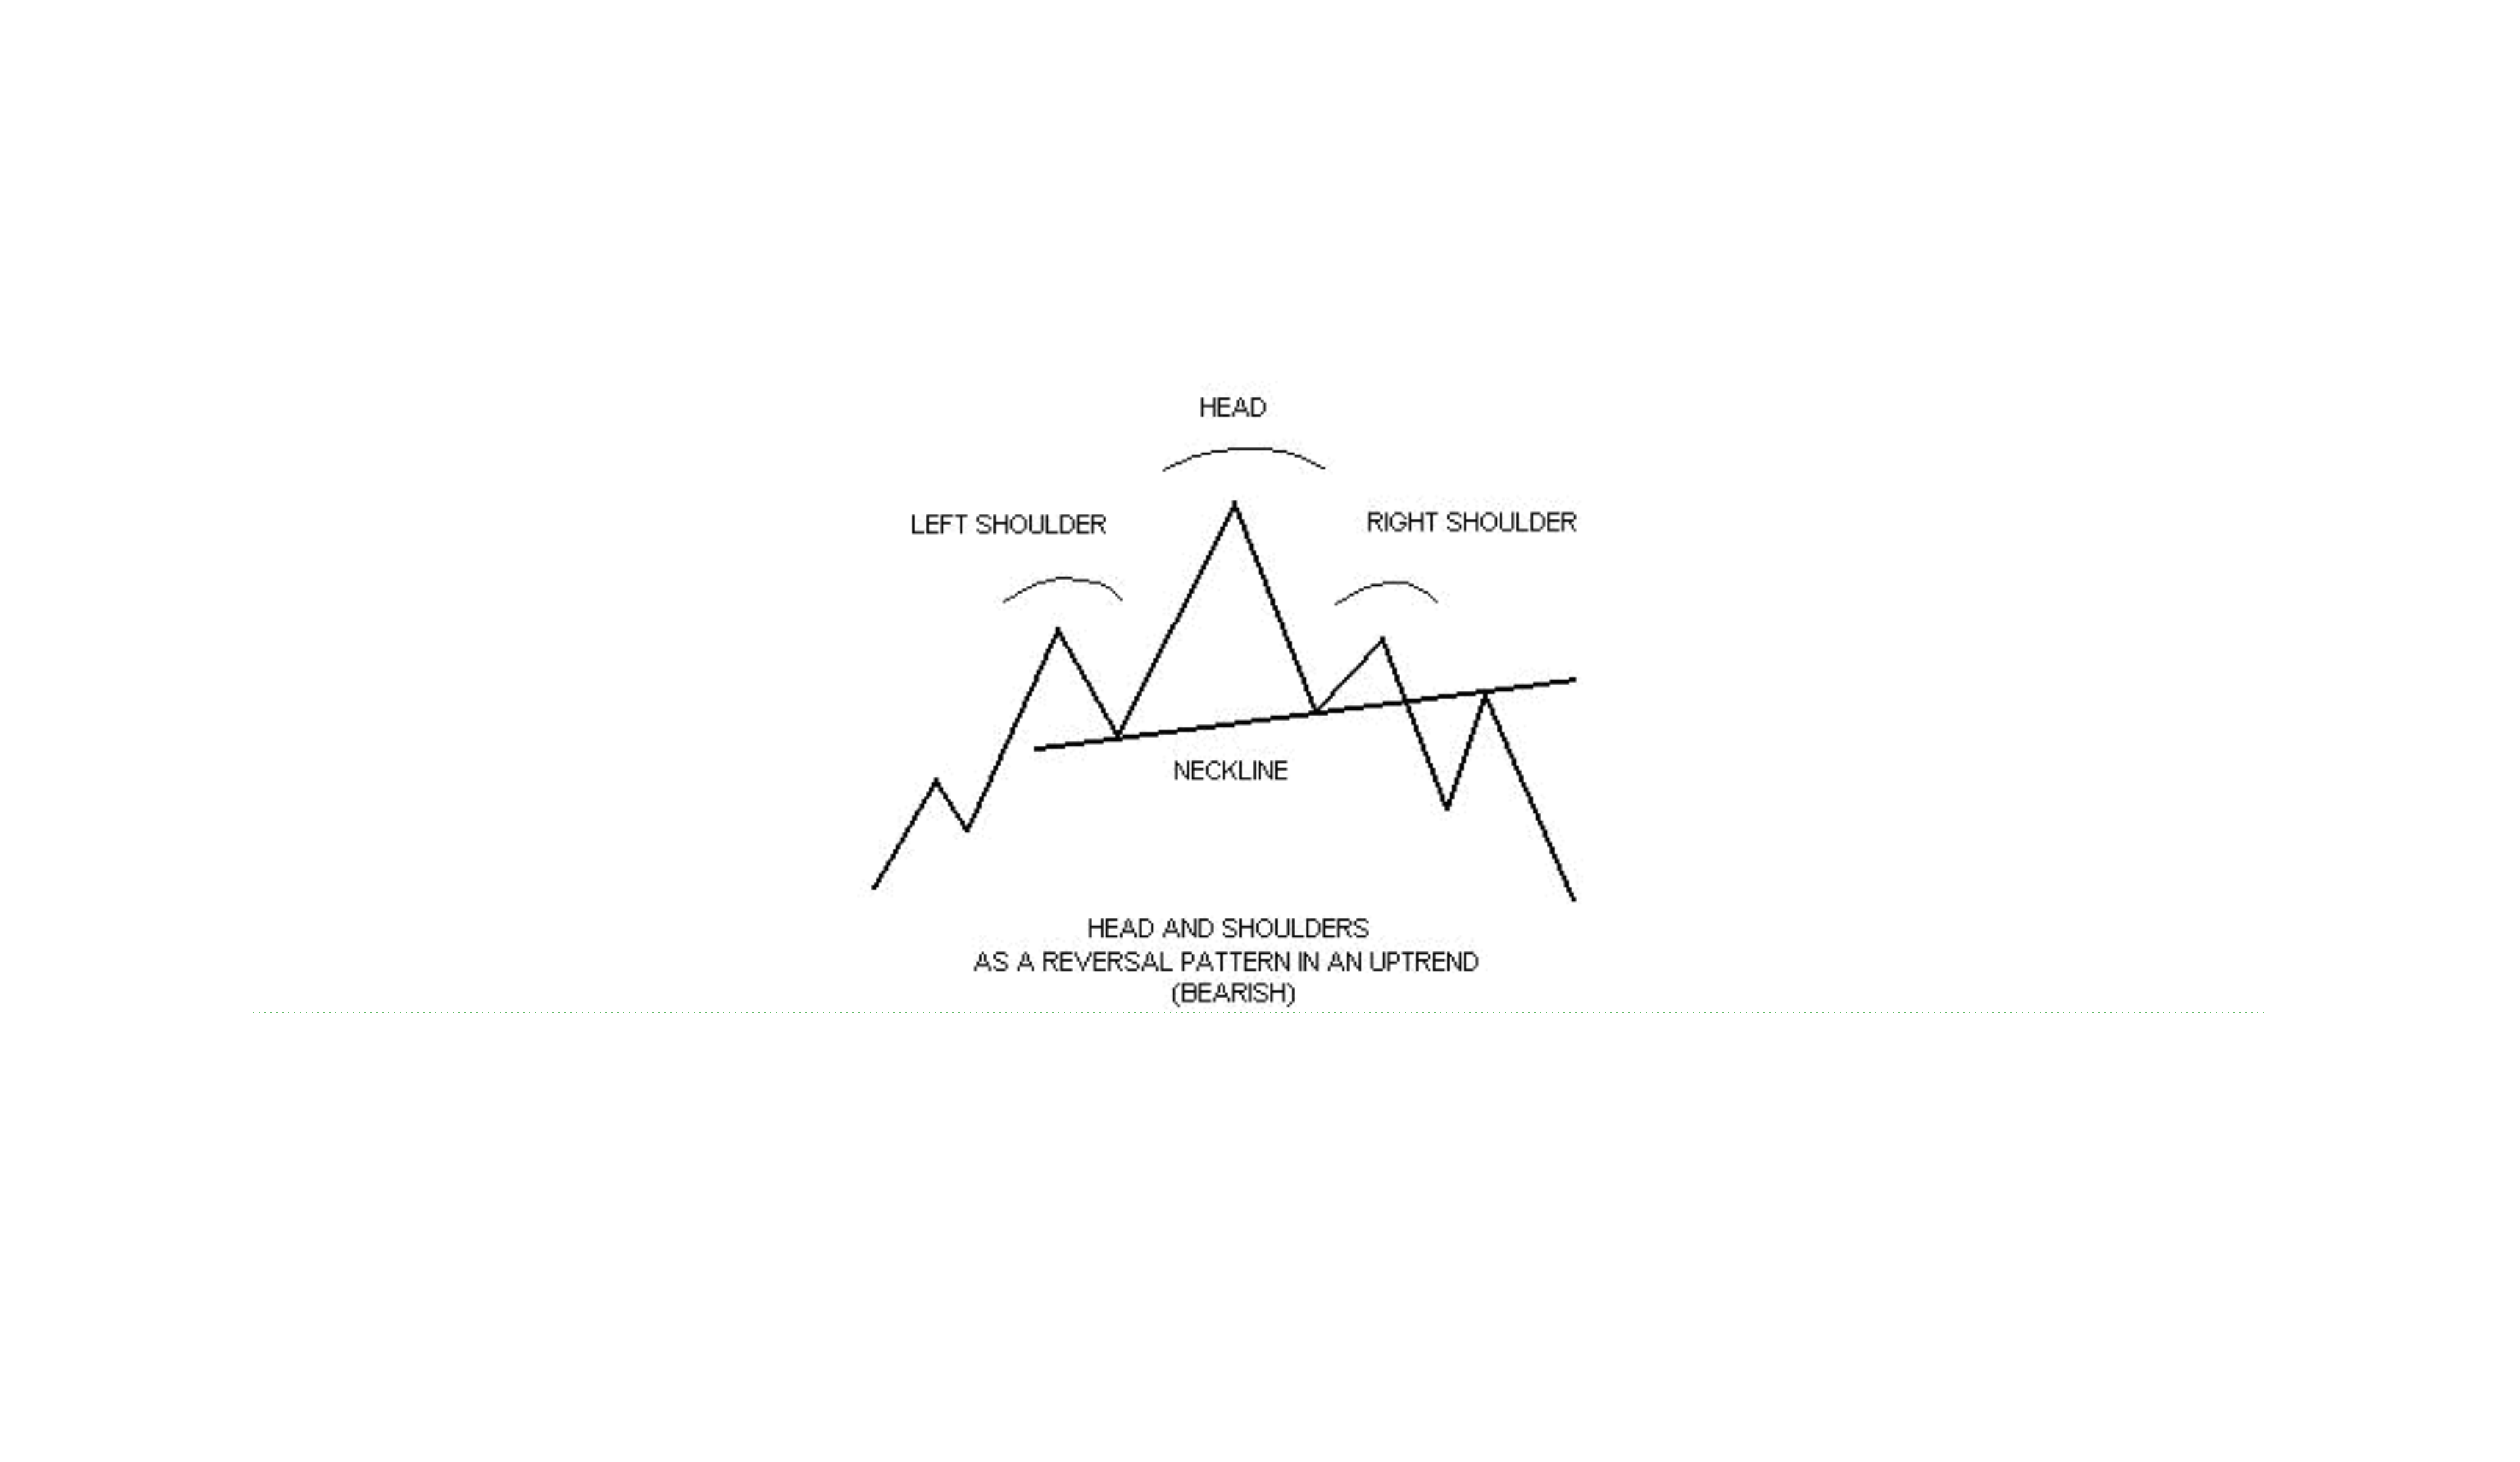
Head & Shoulders (and Inverse)
- Structure: Three distinct peaks/troughs with a central extreme and defining neckline.
- Logic: Exhaustion of dominant buying or selling pressure.
Head and Shoulders Pattern Setup
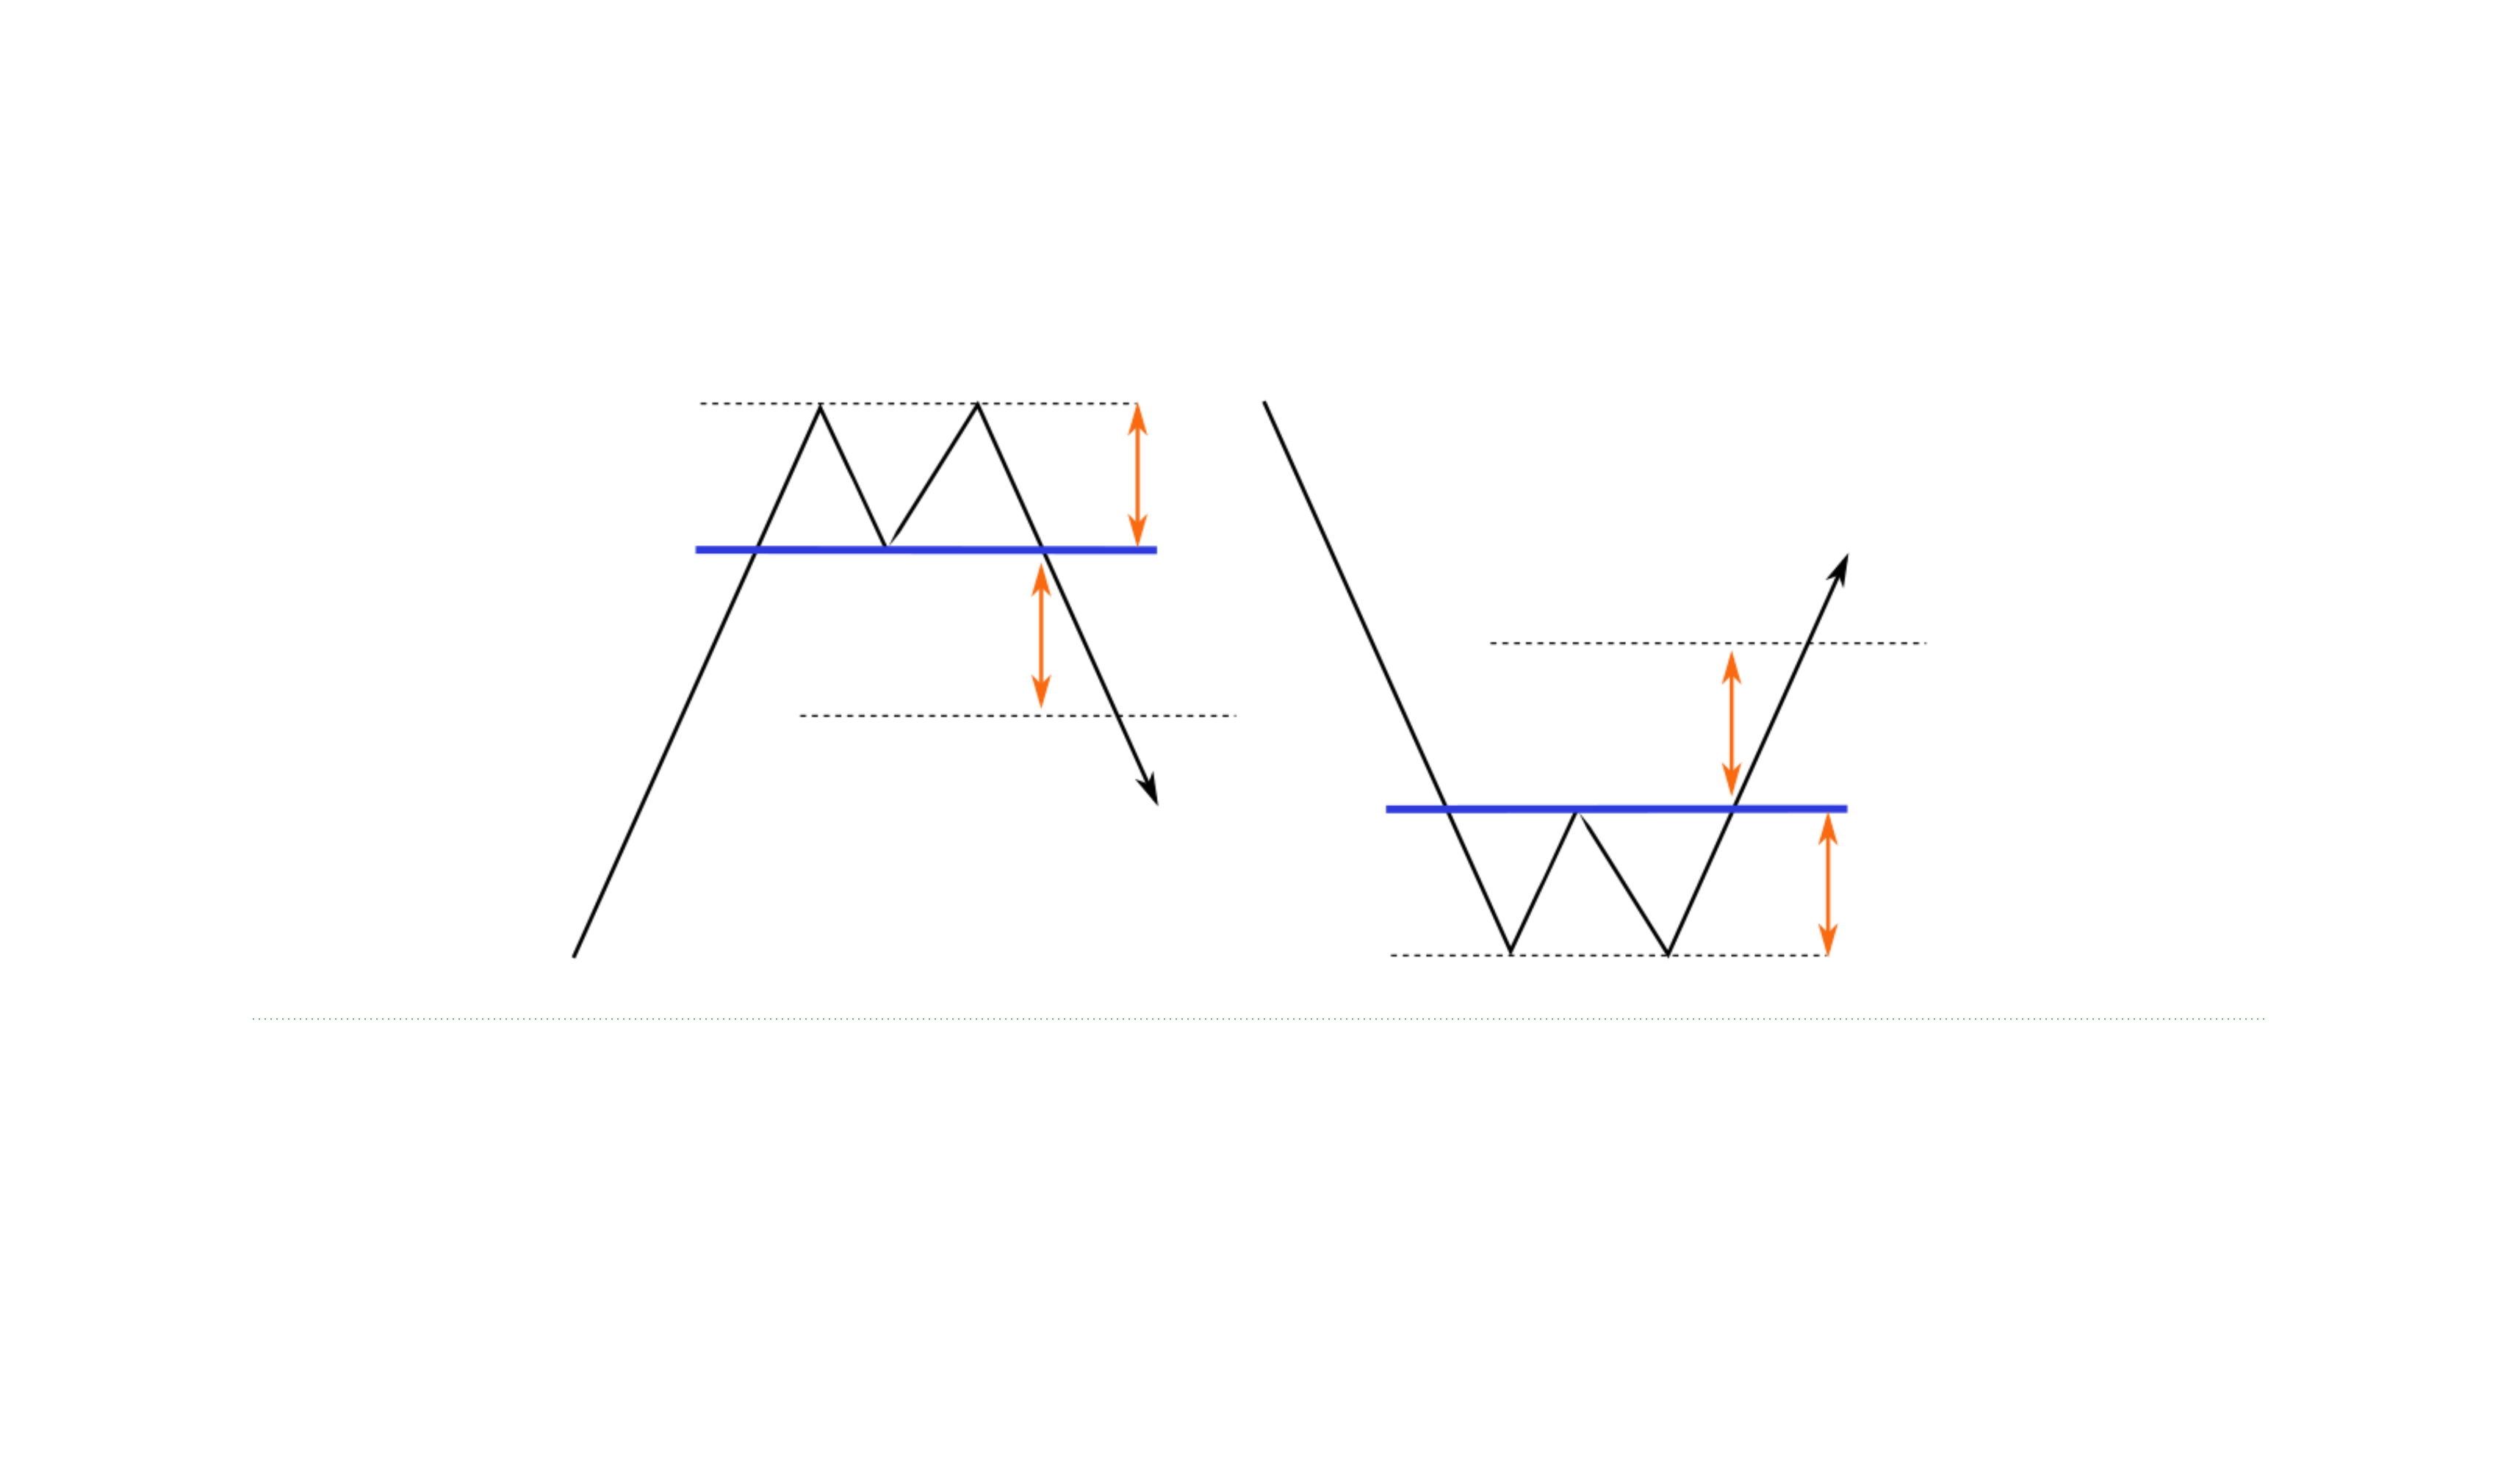
Double Top & Double Bottom
- Structure: Two consecutive rejections from the same price boundary.
- Logic: Clear structural resistance or support defense.
Double Top and Double Bottom Setup
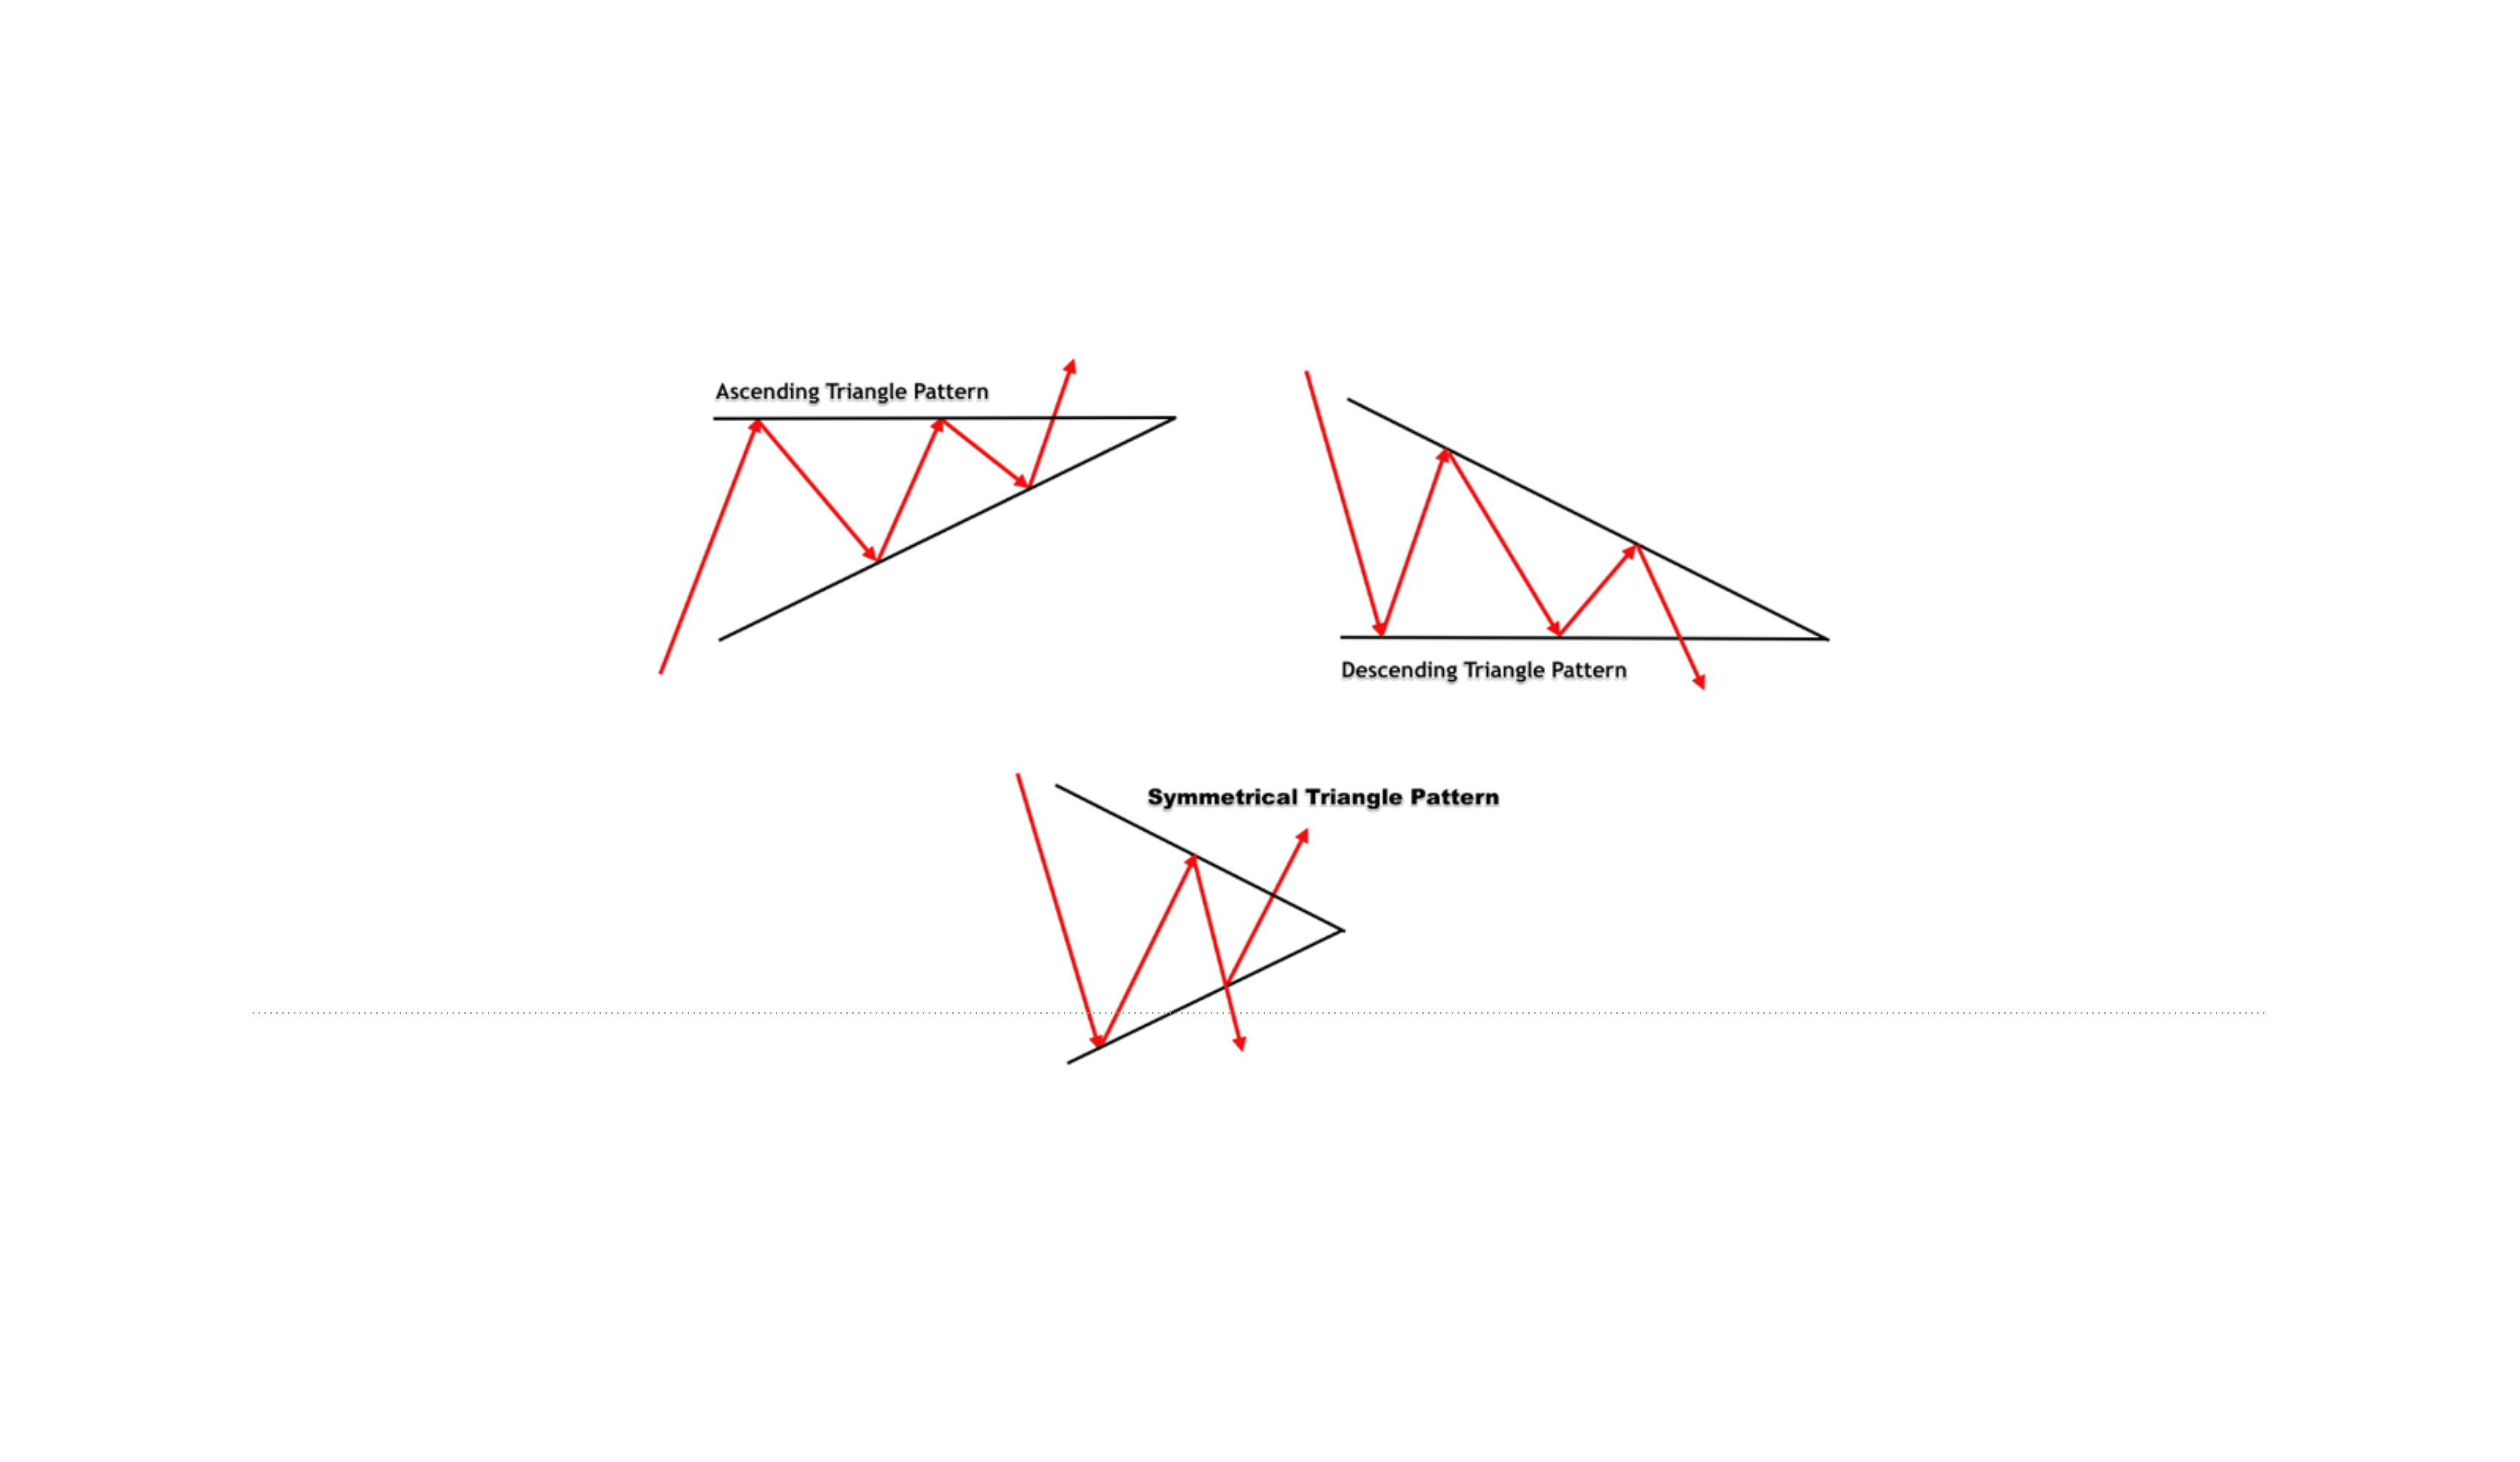
Triangles (Ascending, Descending, Symmetrical)
- Structure: Converging trendlines signaling volatility contraction prior to expansion.
- Logic: Imminent directional breakout driven by liquidity accumulation.
Triangle Chart Pattern Compression
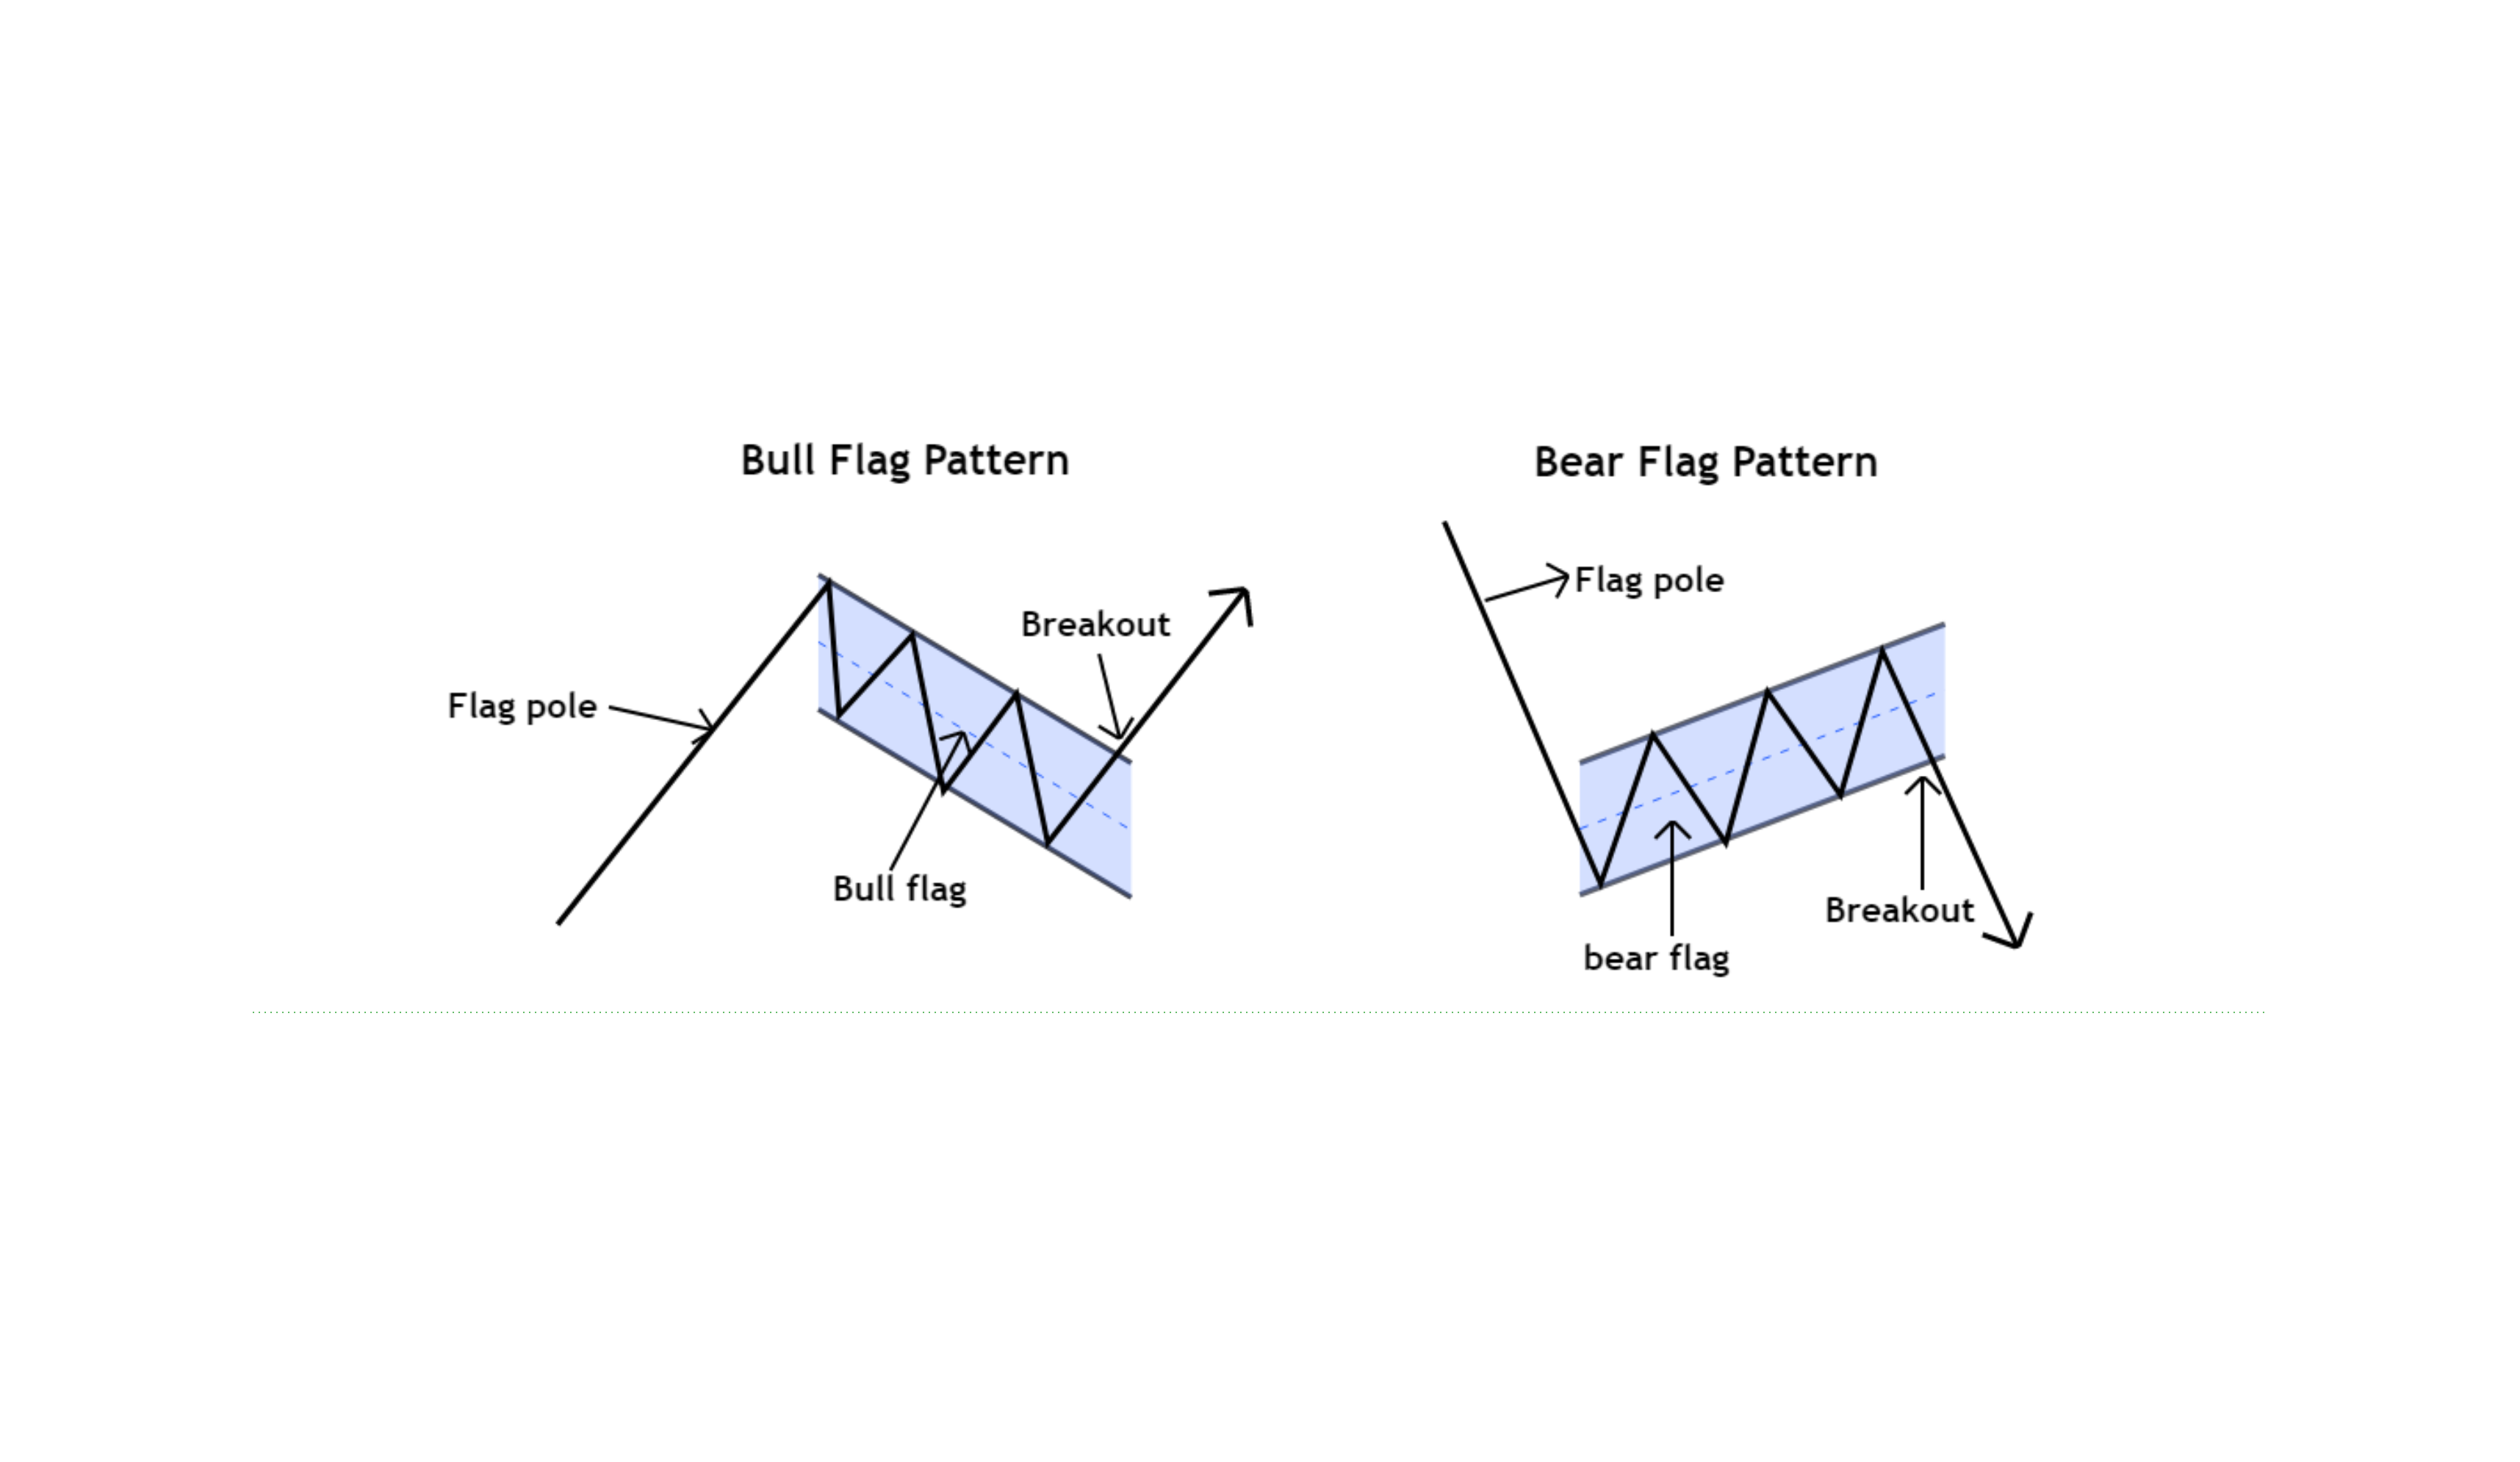
Bull & Bear Flags
- Structure: Counter-trend consolidation channel following a strong directional pole.
- Logic: High-probability continuation setup with contracting consolidation volume.
Bull Flag and Bear Flag Setup
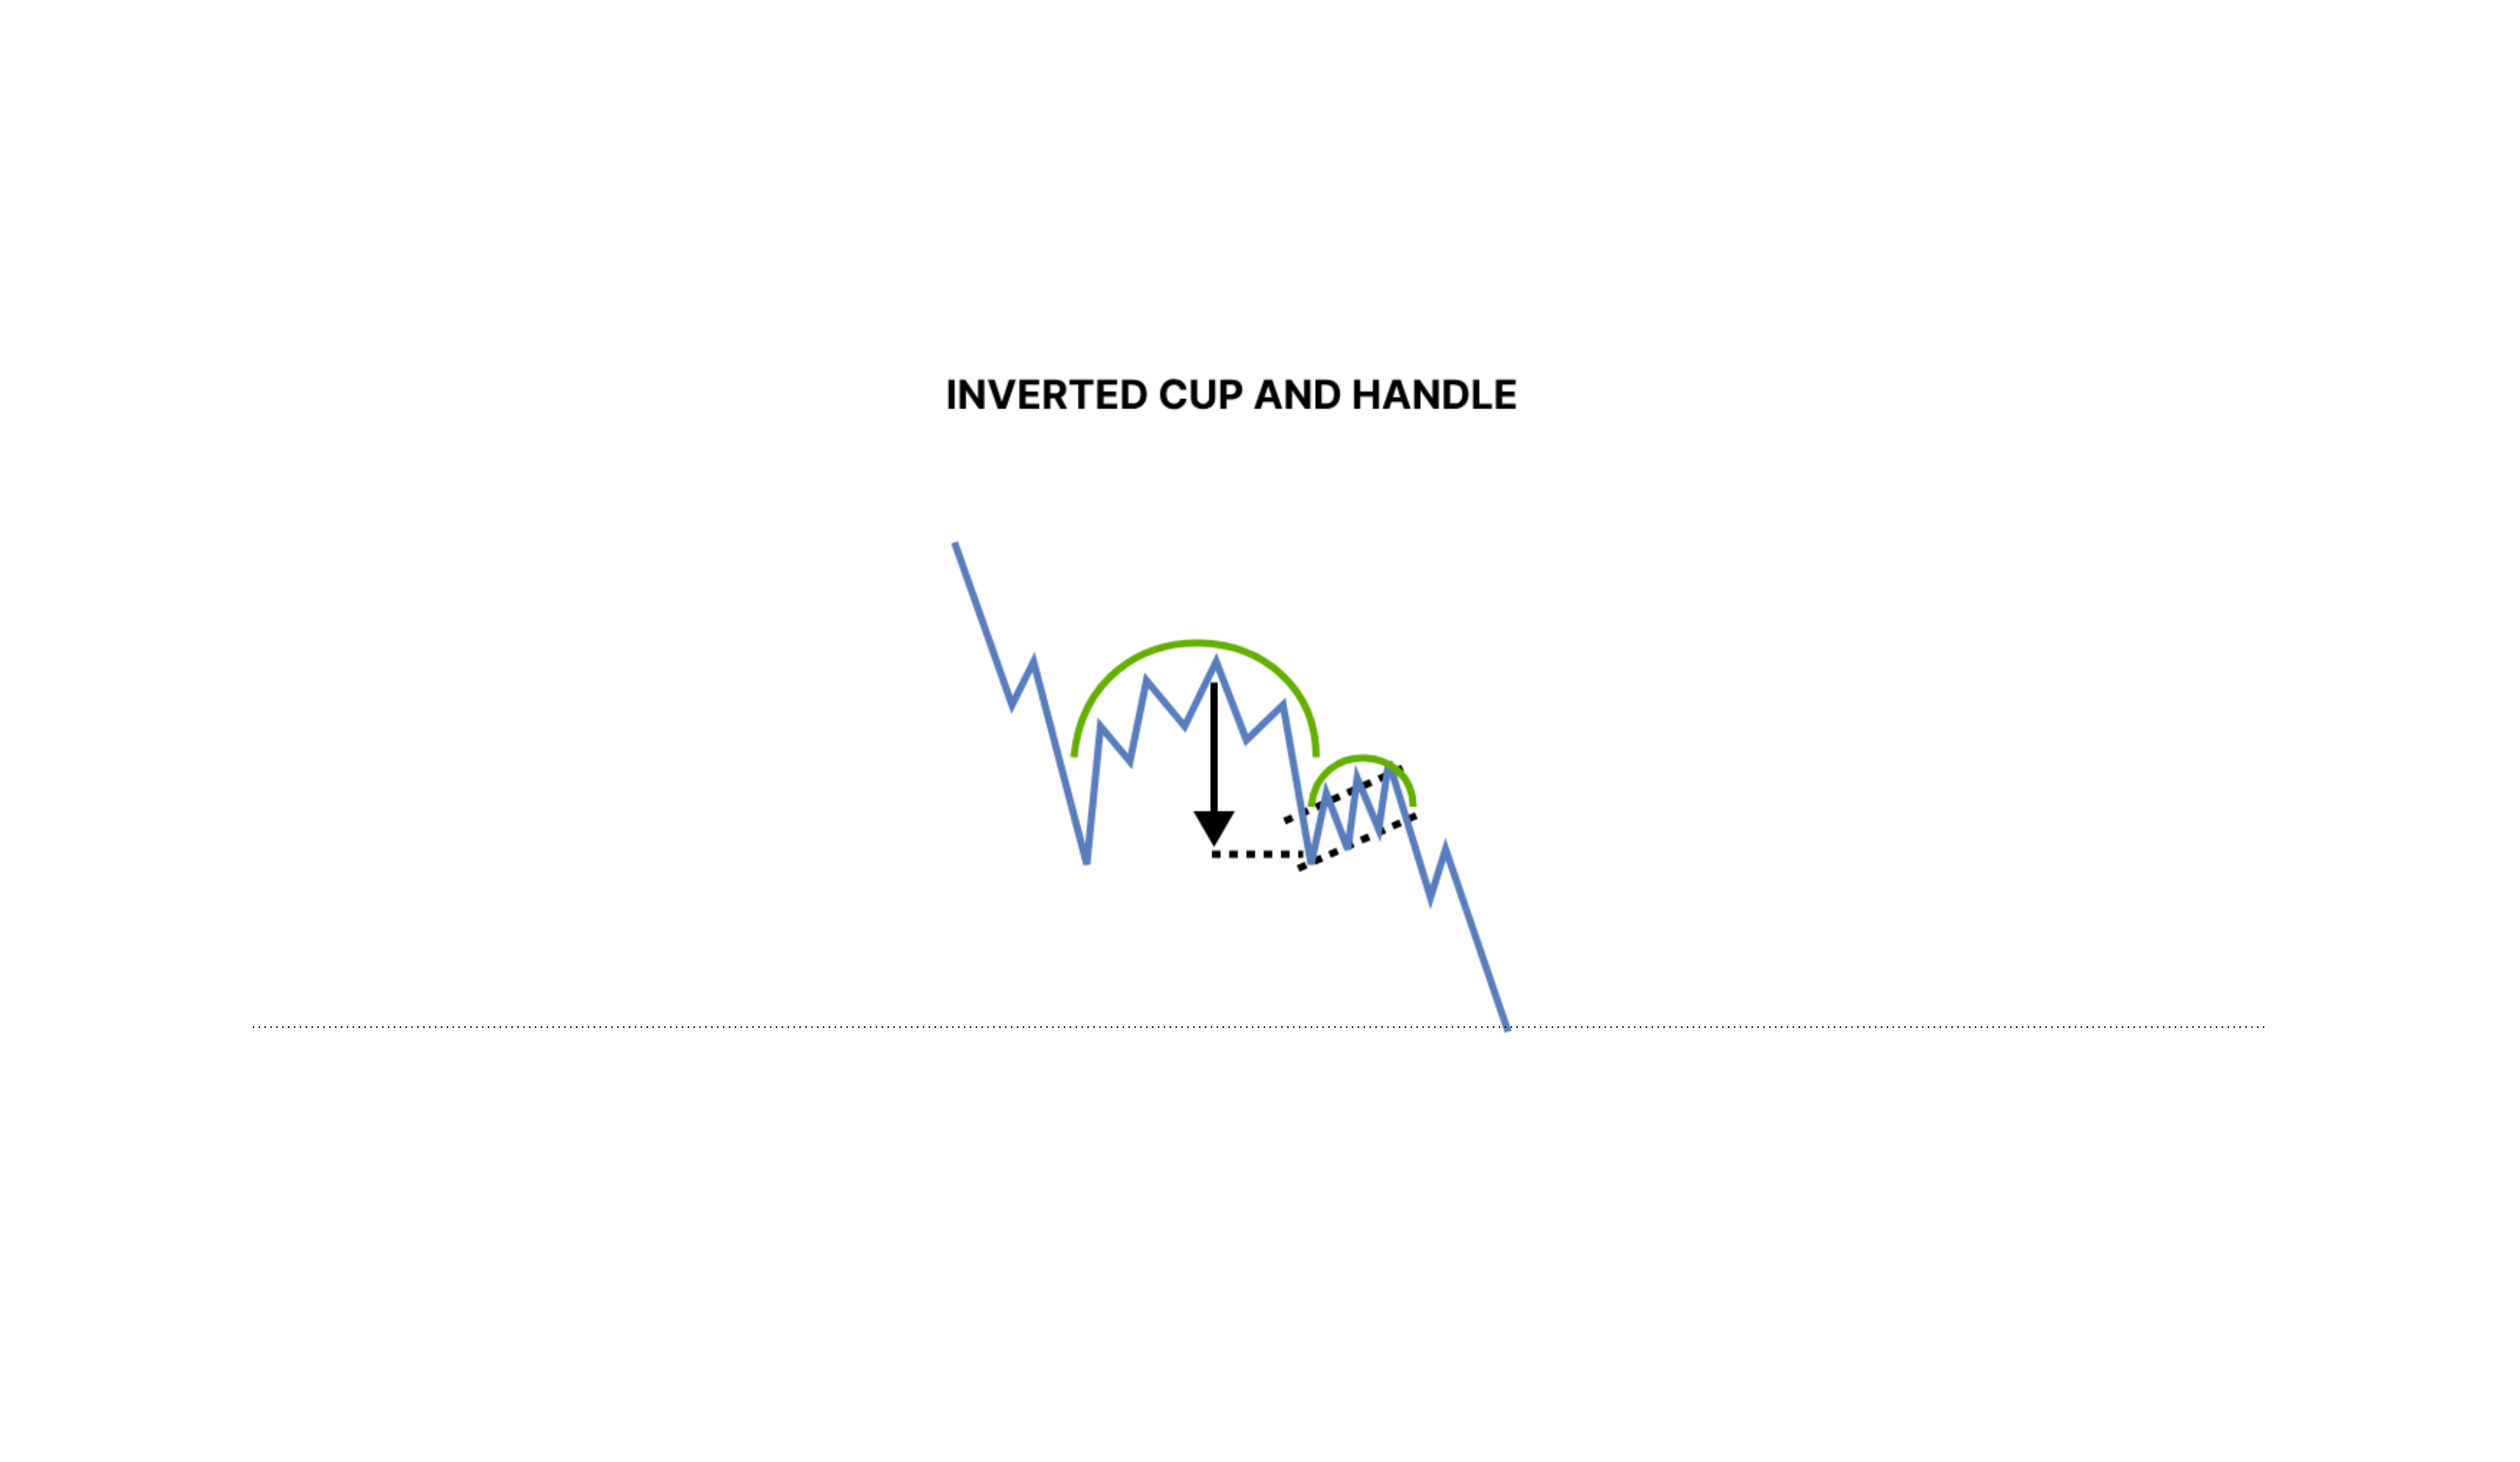
Cup & Handle
- Structure: Rounded bottom base followed by a shallow pullback handle.
- Logic: Systematic accumulation establishing support before breakout expansion.
Cup and Handle Pattern
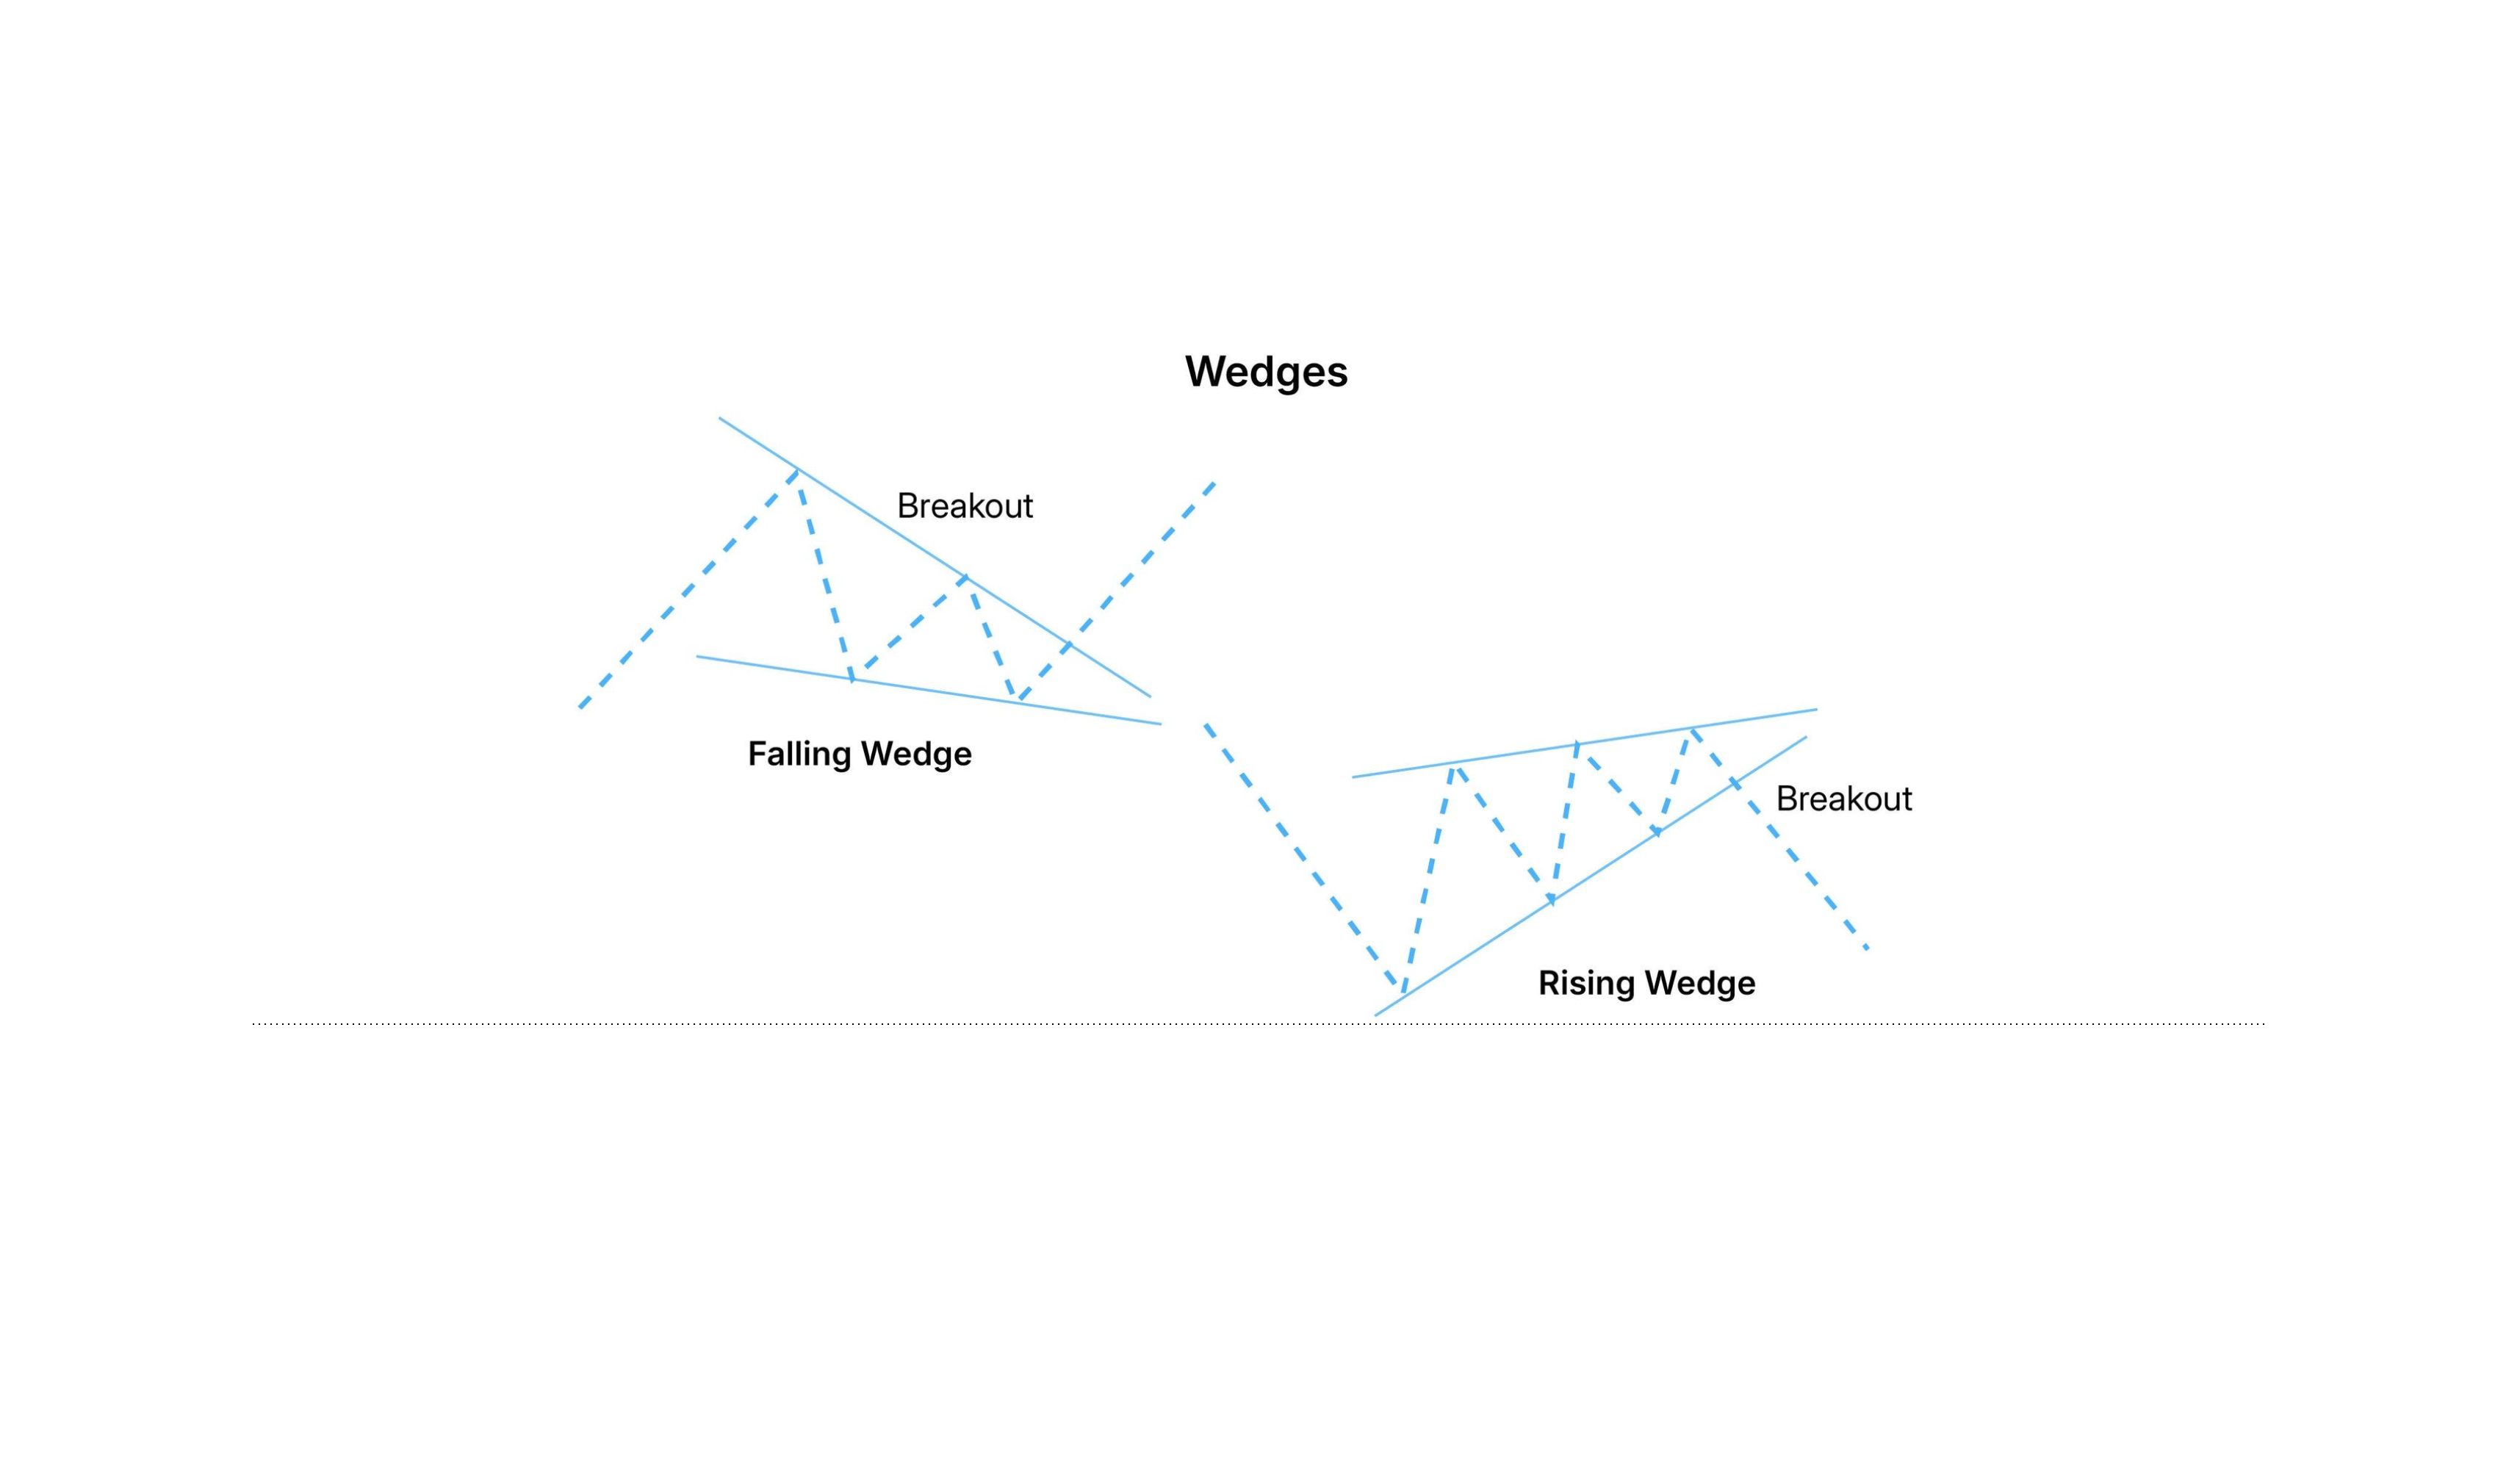
Wedges (Rising & Falling)
- Structure: Slanted converging boundaries moving against or with the macro trend.
- Logic: Momentum divergence resolving in explosive counter-wedge moves.
Rising and Falling Wedge Pattern
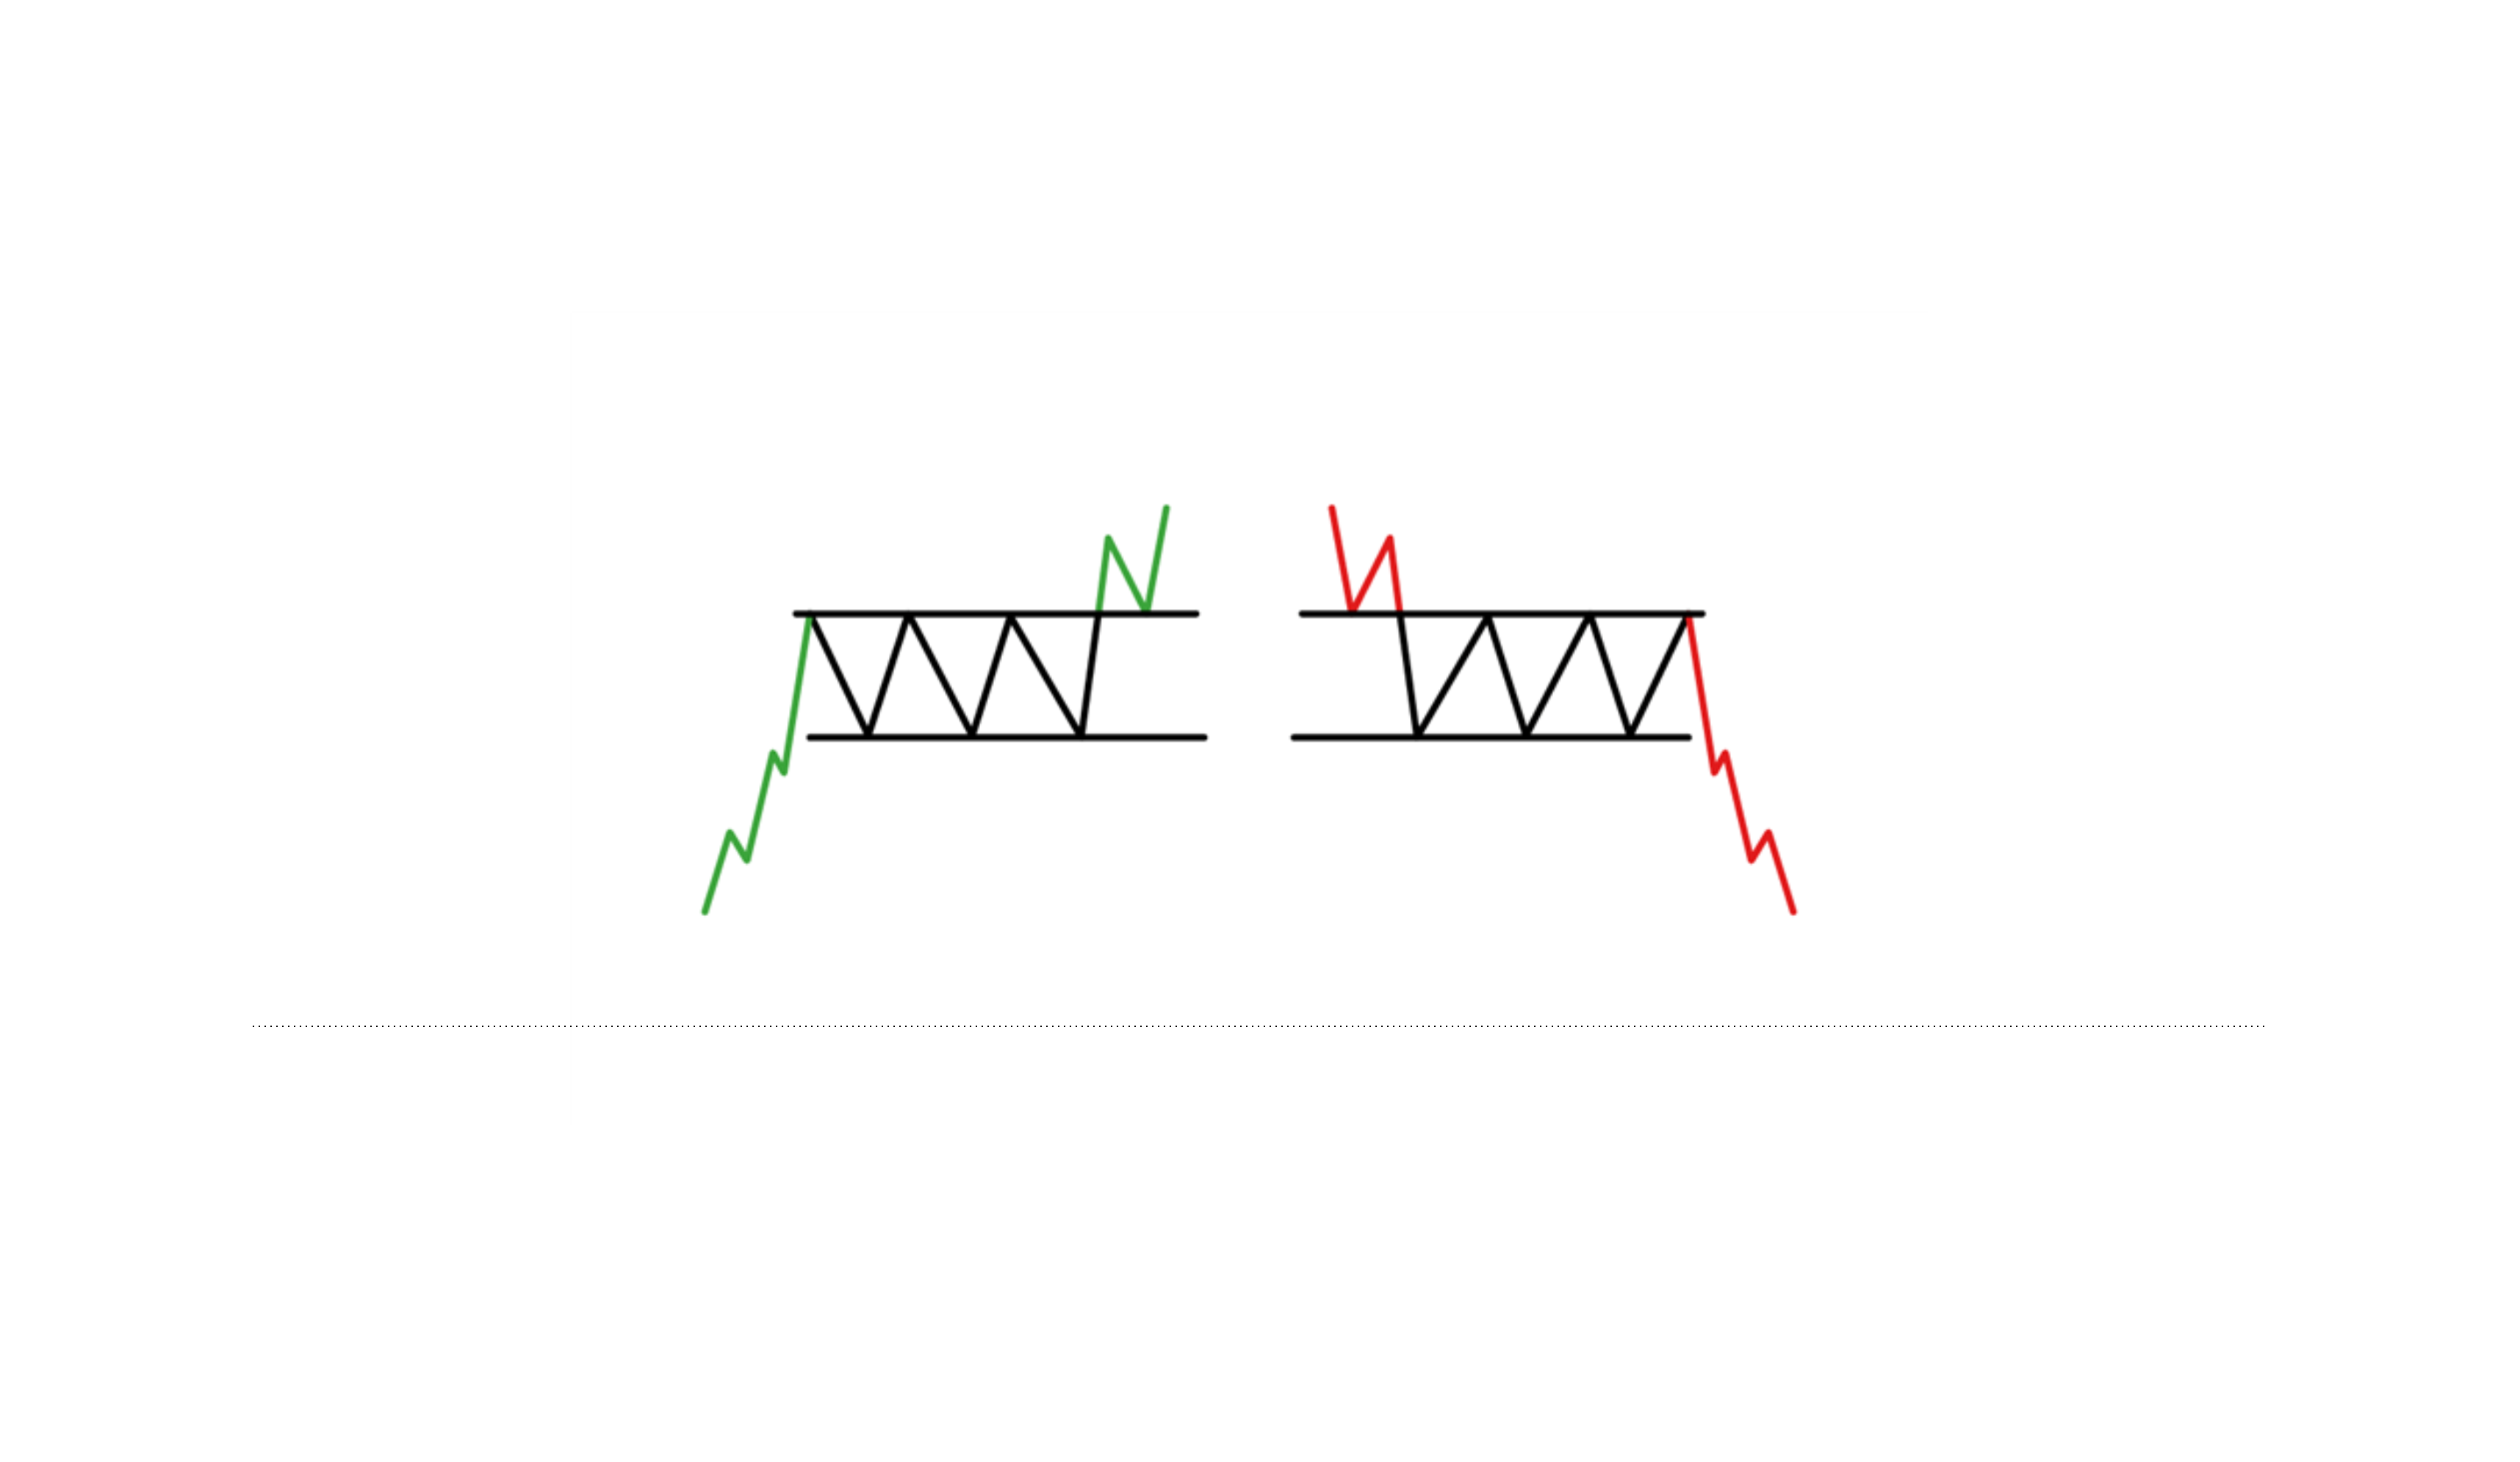
Rectangles & Trading Ranges
- Structure: Parallel support and resistance channels.
- Logic: Baseline auction market balance defining clear boundary trades and breakout triggers.
Rectangle and Trading Range Consolidation
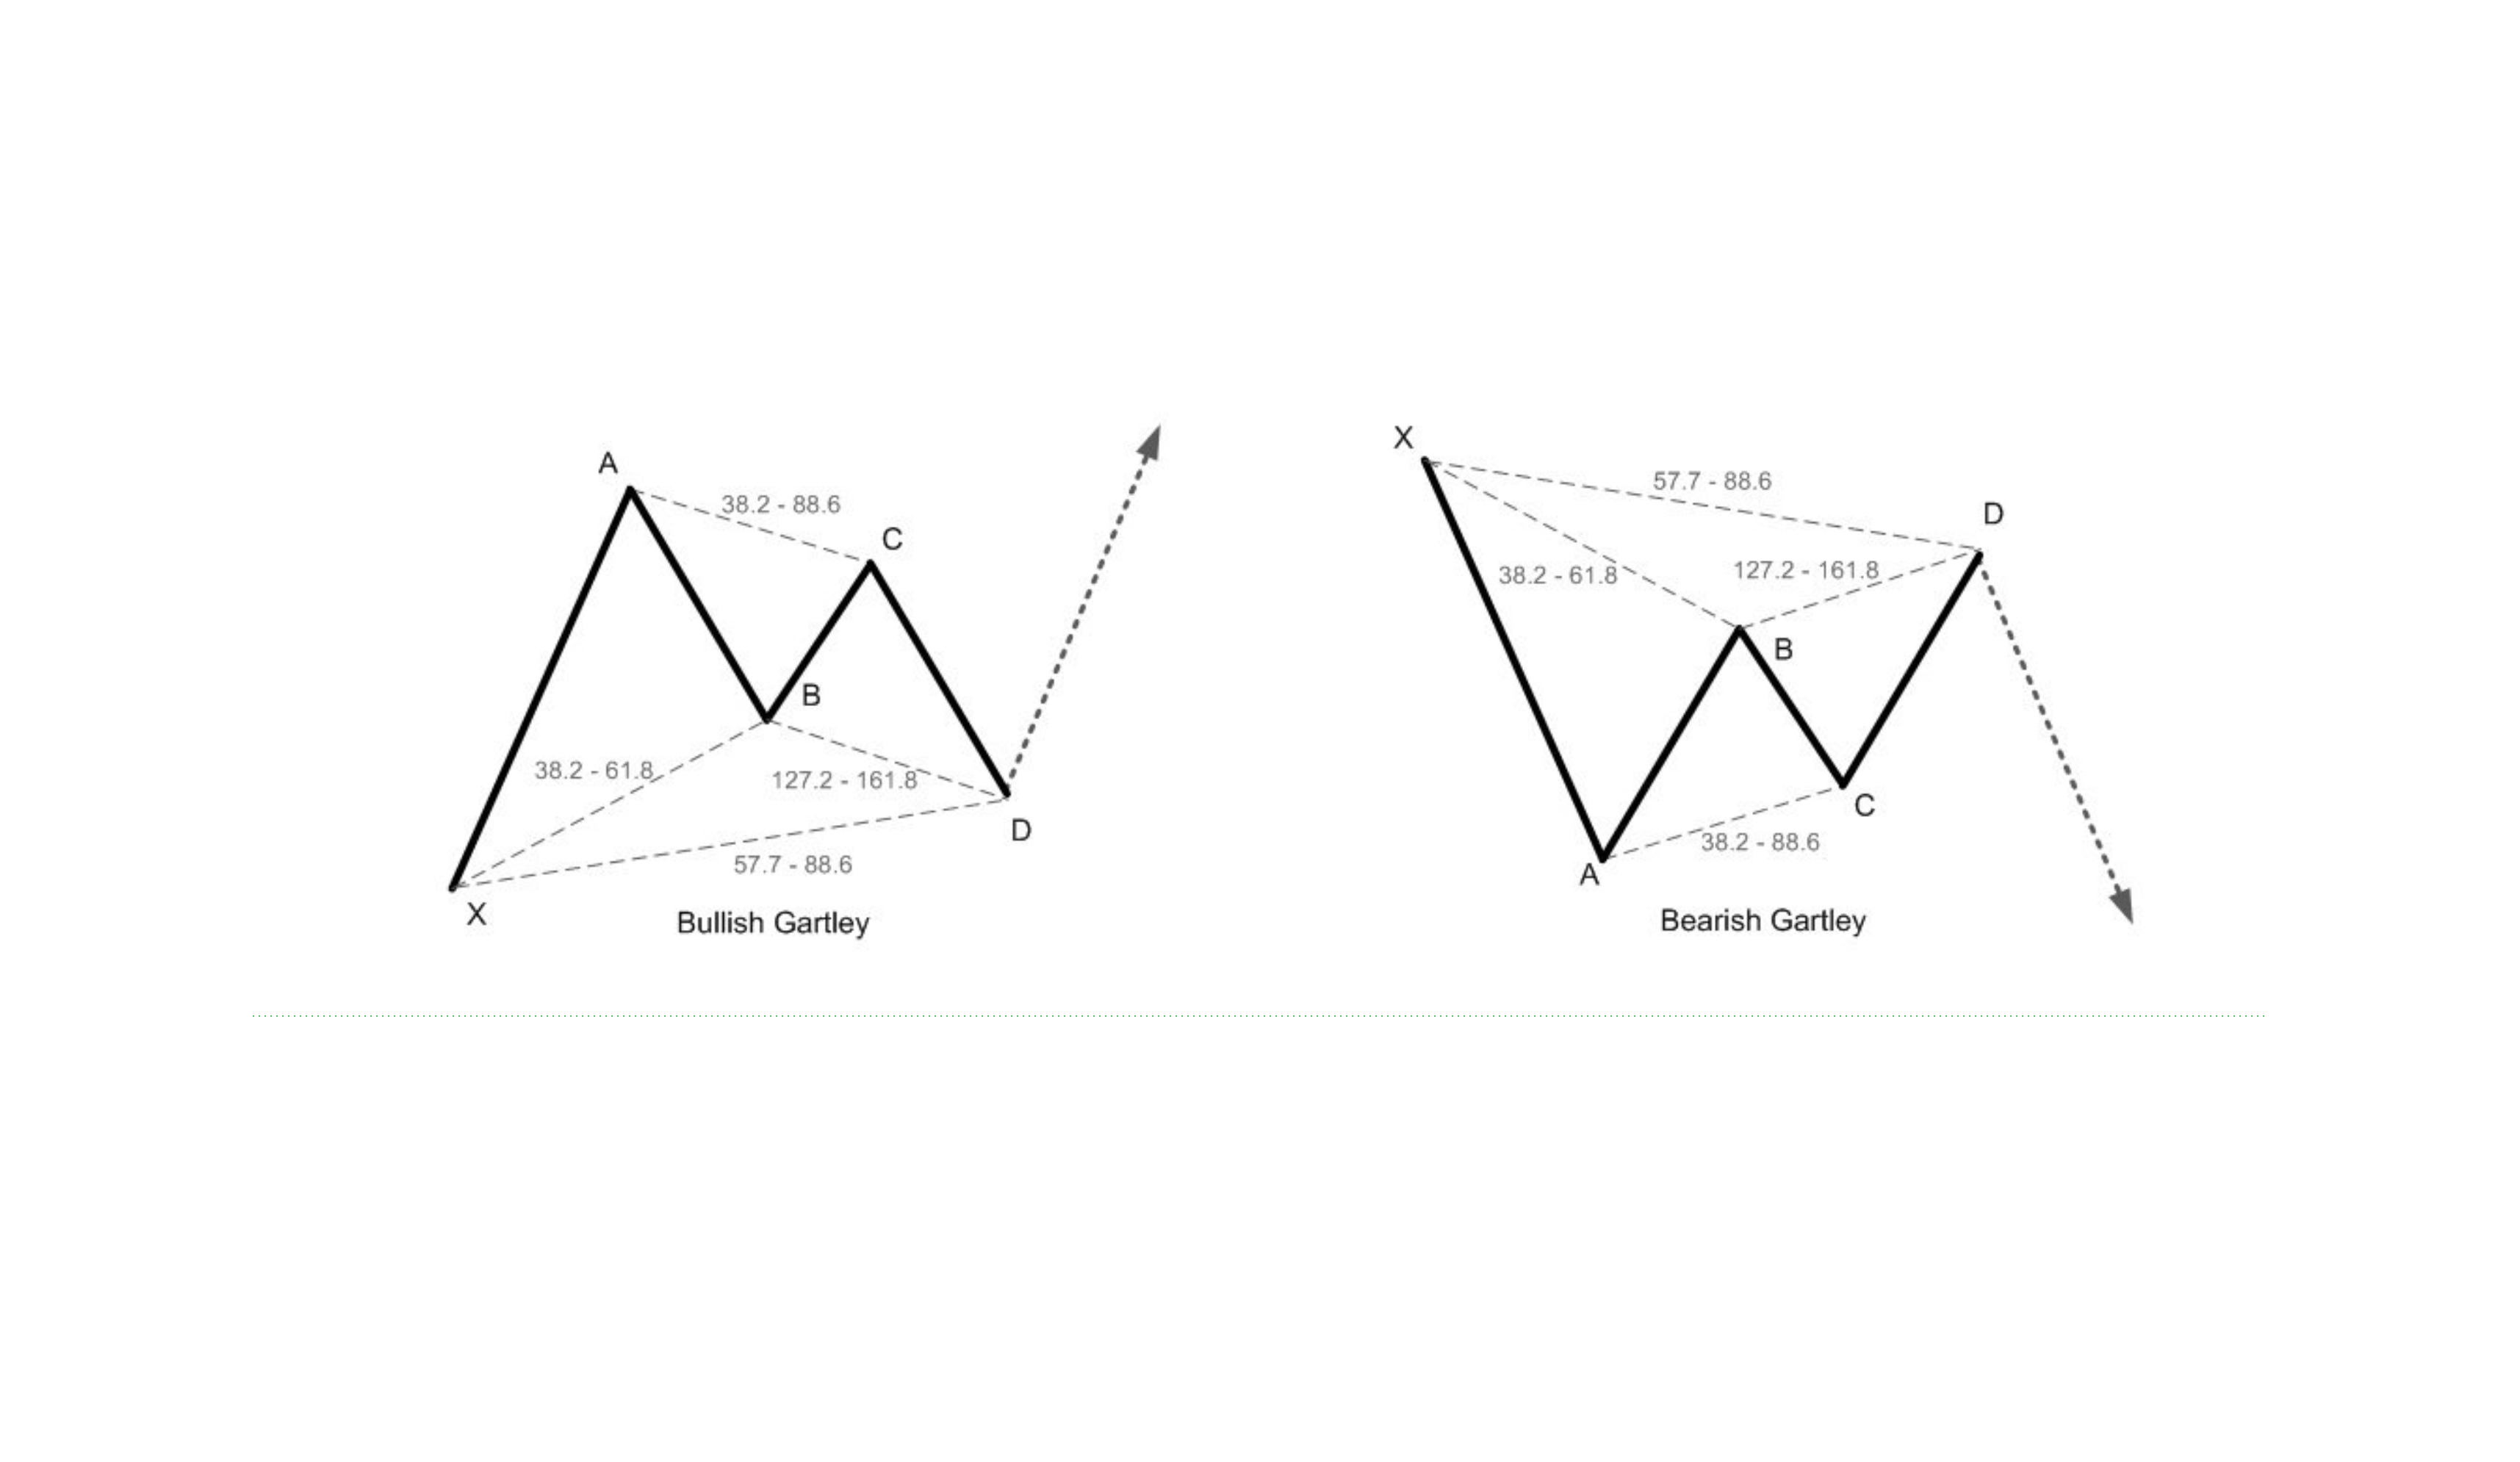
Gartley & Bat (Harmonics)
- Structure: Precise Fibonacci ratio swing leg relationships.
- Logic: Reversals off mathematically defined Potential Reversal Zones (PRZ).
Harmonic Gartley and Bat Patterns
5. Building an Institutional Execution Framework
To turn pattern recognition into a repeatable trading process, follow this 6-step framework:
- Establish Top-Down Directional Bias: Identify macro structure on higher timeframes (Daily/4H). Never trade lower-timeframe patterns against macro momentum without high confluence.
- Apply Strict Pattern Verification: Enforce rigorous structural criteria. Reject flawed or ambiguous patterns.
- Require Multi-Factor Confluence: Stack independent confirmations (e.g., Classical pattern completing at an SMC Order Block within a Harmonic PRZ).
- Define Explicit Execution Triggers: Require confirmation events (candle body close, lower-timeframe CHoCH, or volume confirmation) before entering.
- Pre-Calculate Risk & Position Sizing: Determine exact invalidation levels, targets, and position size prior to entry.
- Execute Post-Trade Performance Reviews: Track pattern performance by asset and timeframe to quantify your statistical edge over time.
6. Common Pattern Trading Pitfalls to Avoid
- Forcing Patterns: Seeing shapes that do not meet strict structural criteria due to confirmation bias.
- Ignoring Volume Dynamics: Trading breakouts without observing volume expansion or contraction signatures.
- Trading Against HTF Trend: Engaging counter-trend patterns without structural confluence.
- Moving Invalidation Levels: Adjusting stop-loss orders emotionally when trades move against your position.
- Overcomplicating Analysis: Attempting to overlay all pattern families simultaneously instead of mastering a focused set.
Key Takeaways
Chart patterns represent the visual footprint of institutional supply and demand dynamics. Success comes not from memorizing pattern names, but from building a disciplined execution framework around structural context, strict invalidation, and risk management.
Master the underlying framework, not just the geometric shapes.