
Unlock the secrets of market geometry and discover how Fibonacci analysis can transform your trading performance. From measuring dynamic support and resistance during market pullbacks to projecting profit targets during strong expansion phases, Fibonacci tools give traders a quantitative, repeatable framework for risk management and entry timing. While basic retracement levels are widely known, mastering advanced applications—such as the Golden Pocket, ICT Optimal Trade Entry (OTE), and confluence clusters—provides a major edge in modern markets.
1. What is Fibonacci?
At its core, Fibonacci analysis is rooted in a mathematical sequence discovered by Italian mathematician Leonardo Fibonacci in his 1202 treatise Liber Abaci. The sequence begins with 0 and 1, where each subsequent number is the sum of the preceding two:
0, 1, 1, 2, 3, 5, 8, 13, 21, 34, 55, 89, 144...
As the sequence progresses, dividing any number by its immediate successor yields approximately 0.618, while dividing a number by its preceding counterpart yields 1.618. Known as the Golden Ratio (Phi), this constant governs natural structures, galaxy spirals, architecture, and behavioral patterns in financial asset pricing.
The Golden Ratio and Market Significance
In financial markets, human psychology and institutional order flow create recurring wave patterns that naturally align with Golden Ratio proportions. When an asset experiences a impulsive price move, pullbacks frequently find buyers or sellers at mathematical ratios derived from the sequence.
Golden Ratio and Market Ratios
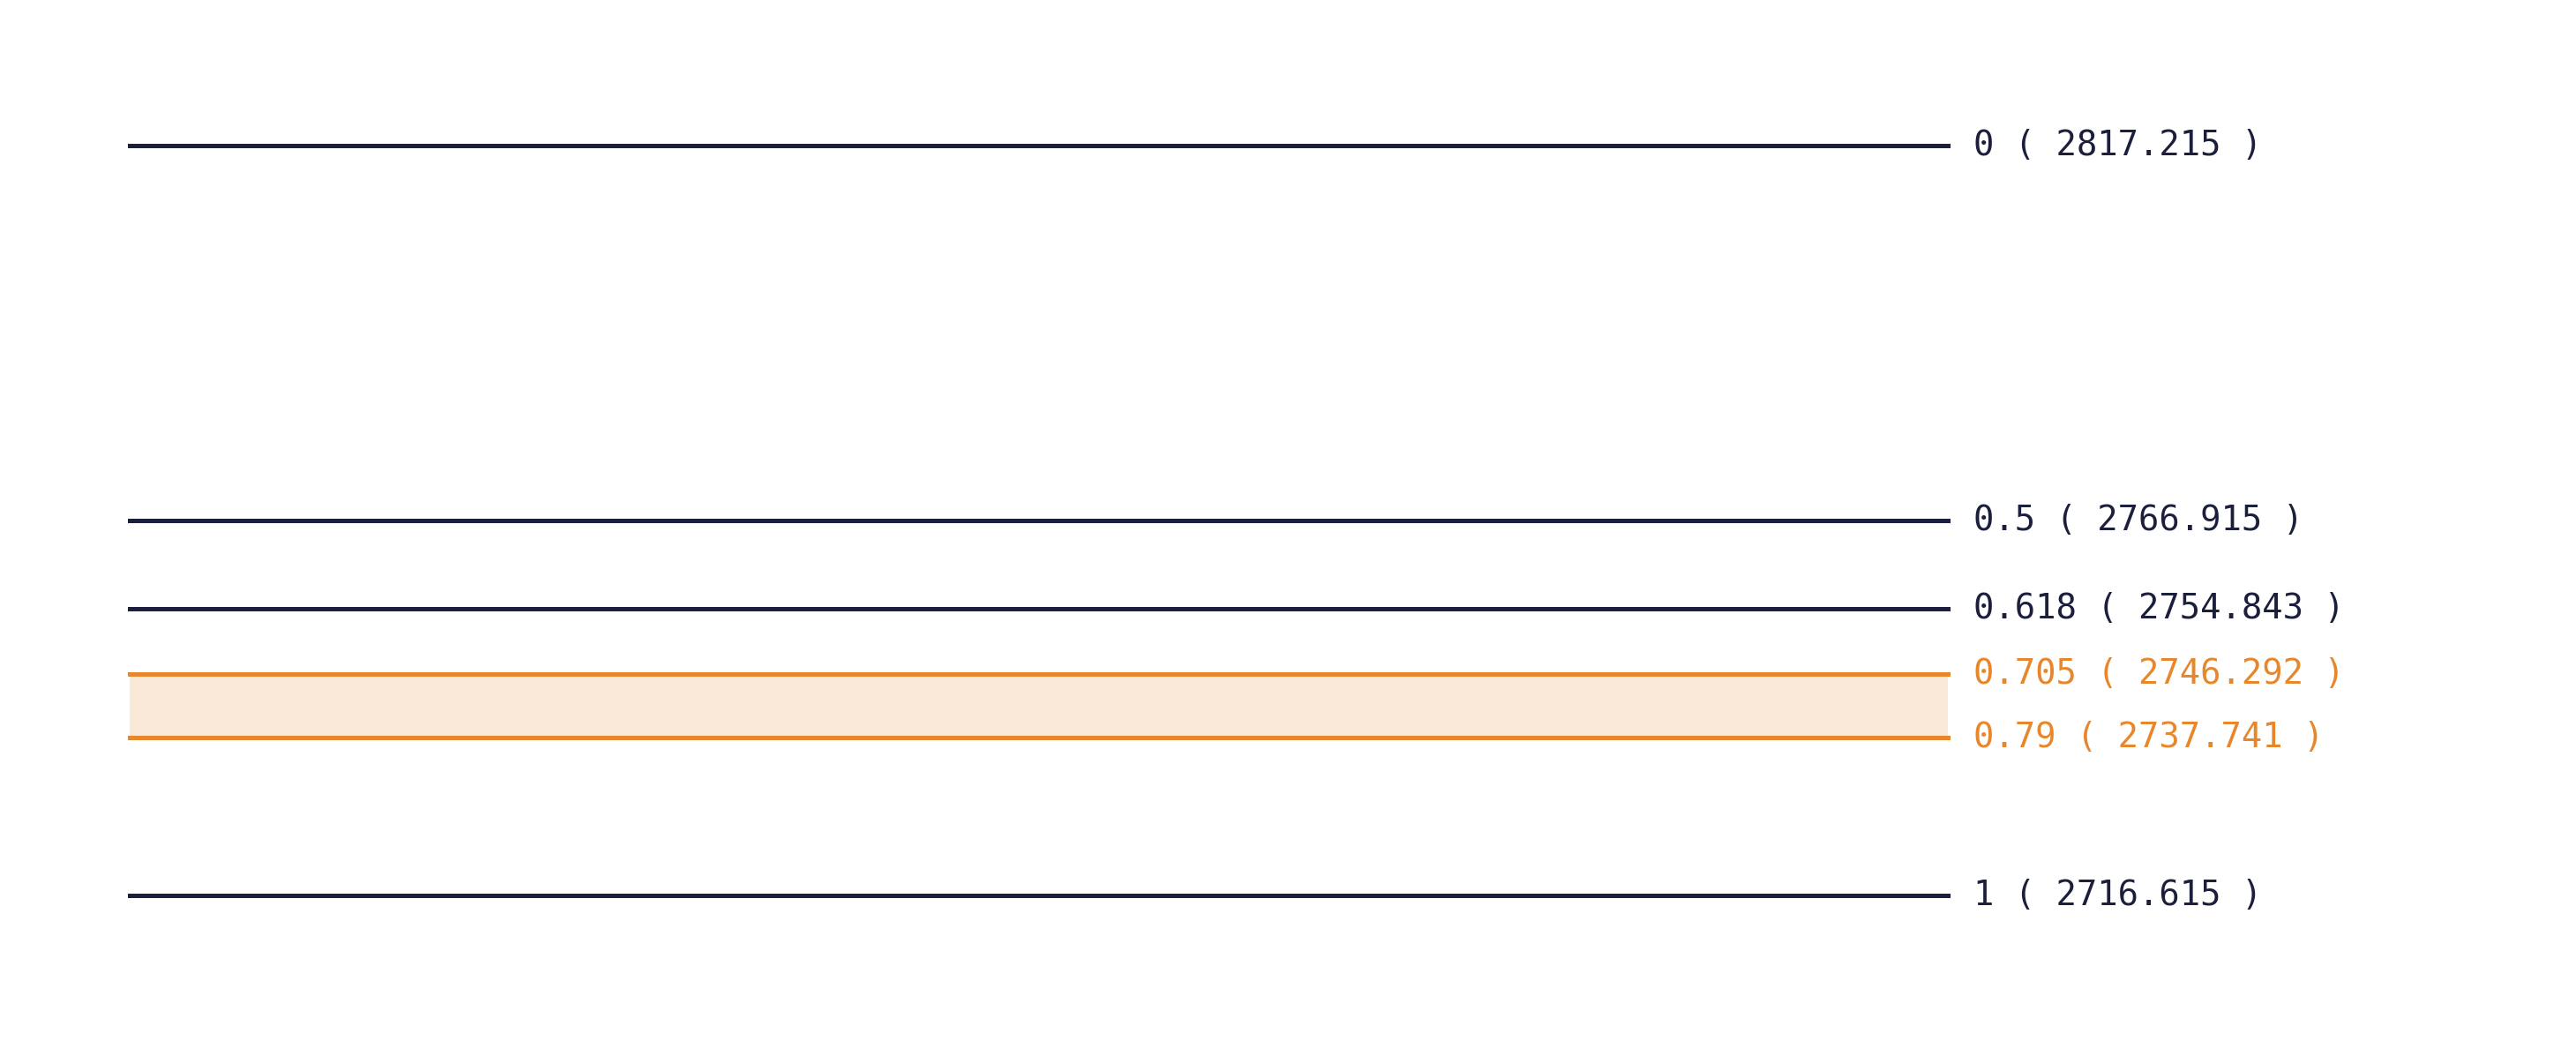
Key Fibonacci trading levels include:
- 0.236 (23.6%): Shallow pullback level during rapid, high-momentum trends.
- 0.382 (38.2%): Moderate retracement level offering initial structural support.
- 0.500 (50.0%): Halfway benchmark (derived from Dow Theory and market equilibrium, widely used alongside Fibonacci).
- 0.618 (61.8%): The primary Golden Ratio level representing deep value.
- 0.786 (78.6%): Deep retracement level preceding trend invalidation or explosive mean-reversion.
2. How Fibonacci Became a Trading Tool
Traders noticed early on that market corrections consistently react at specific Fibonacci ratios relative to the prior impulse move. This observation led to the development of powerful charting tools:
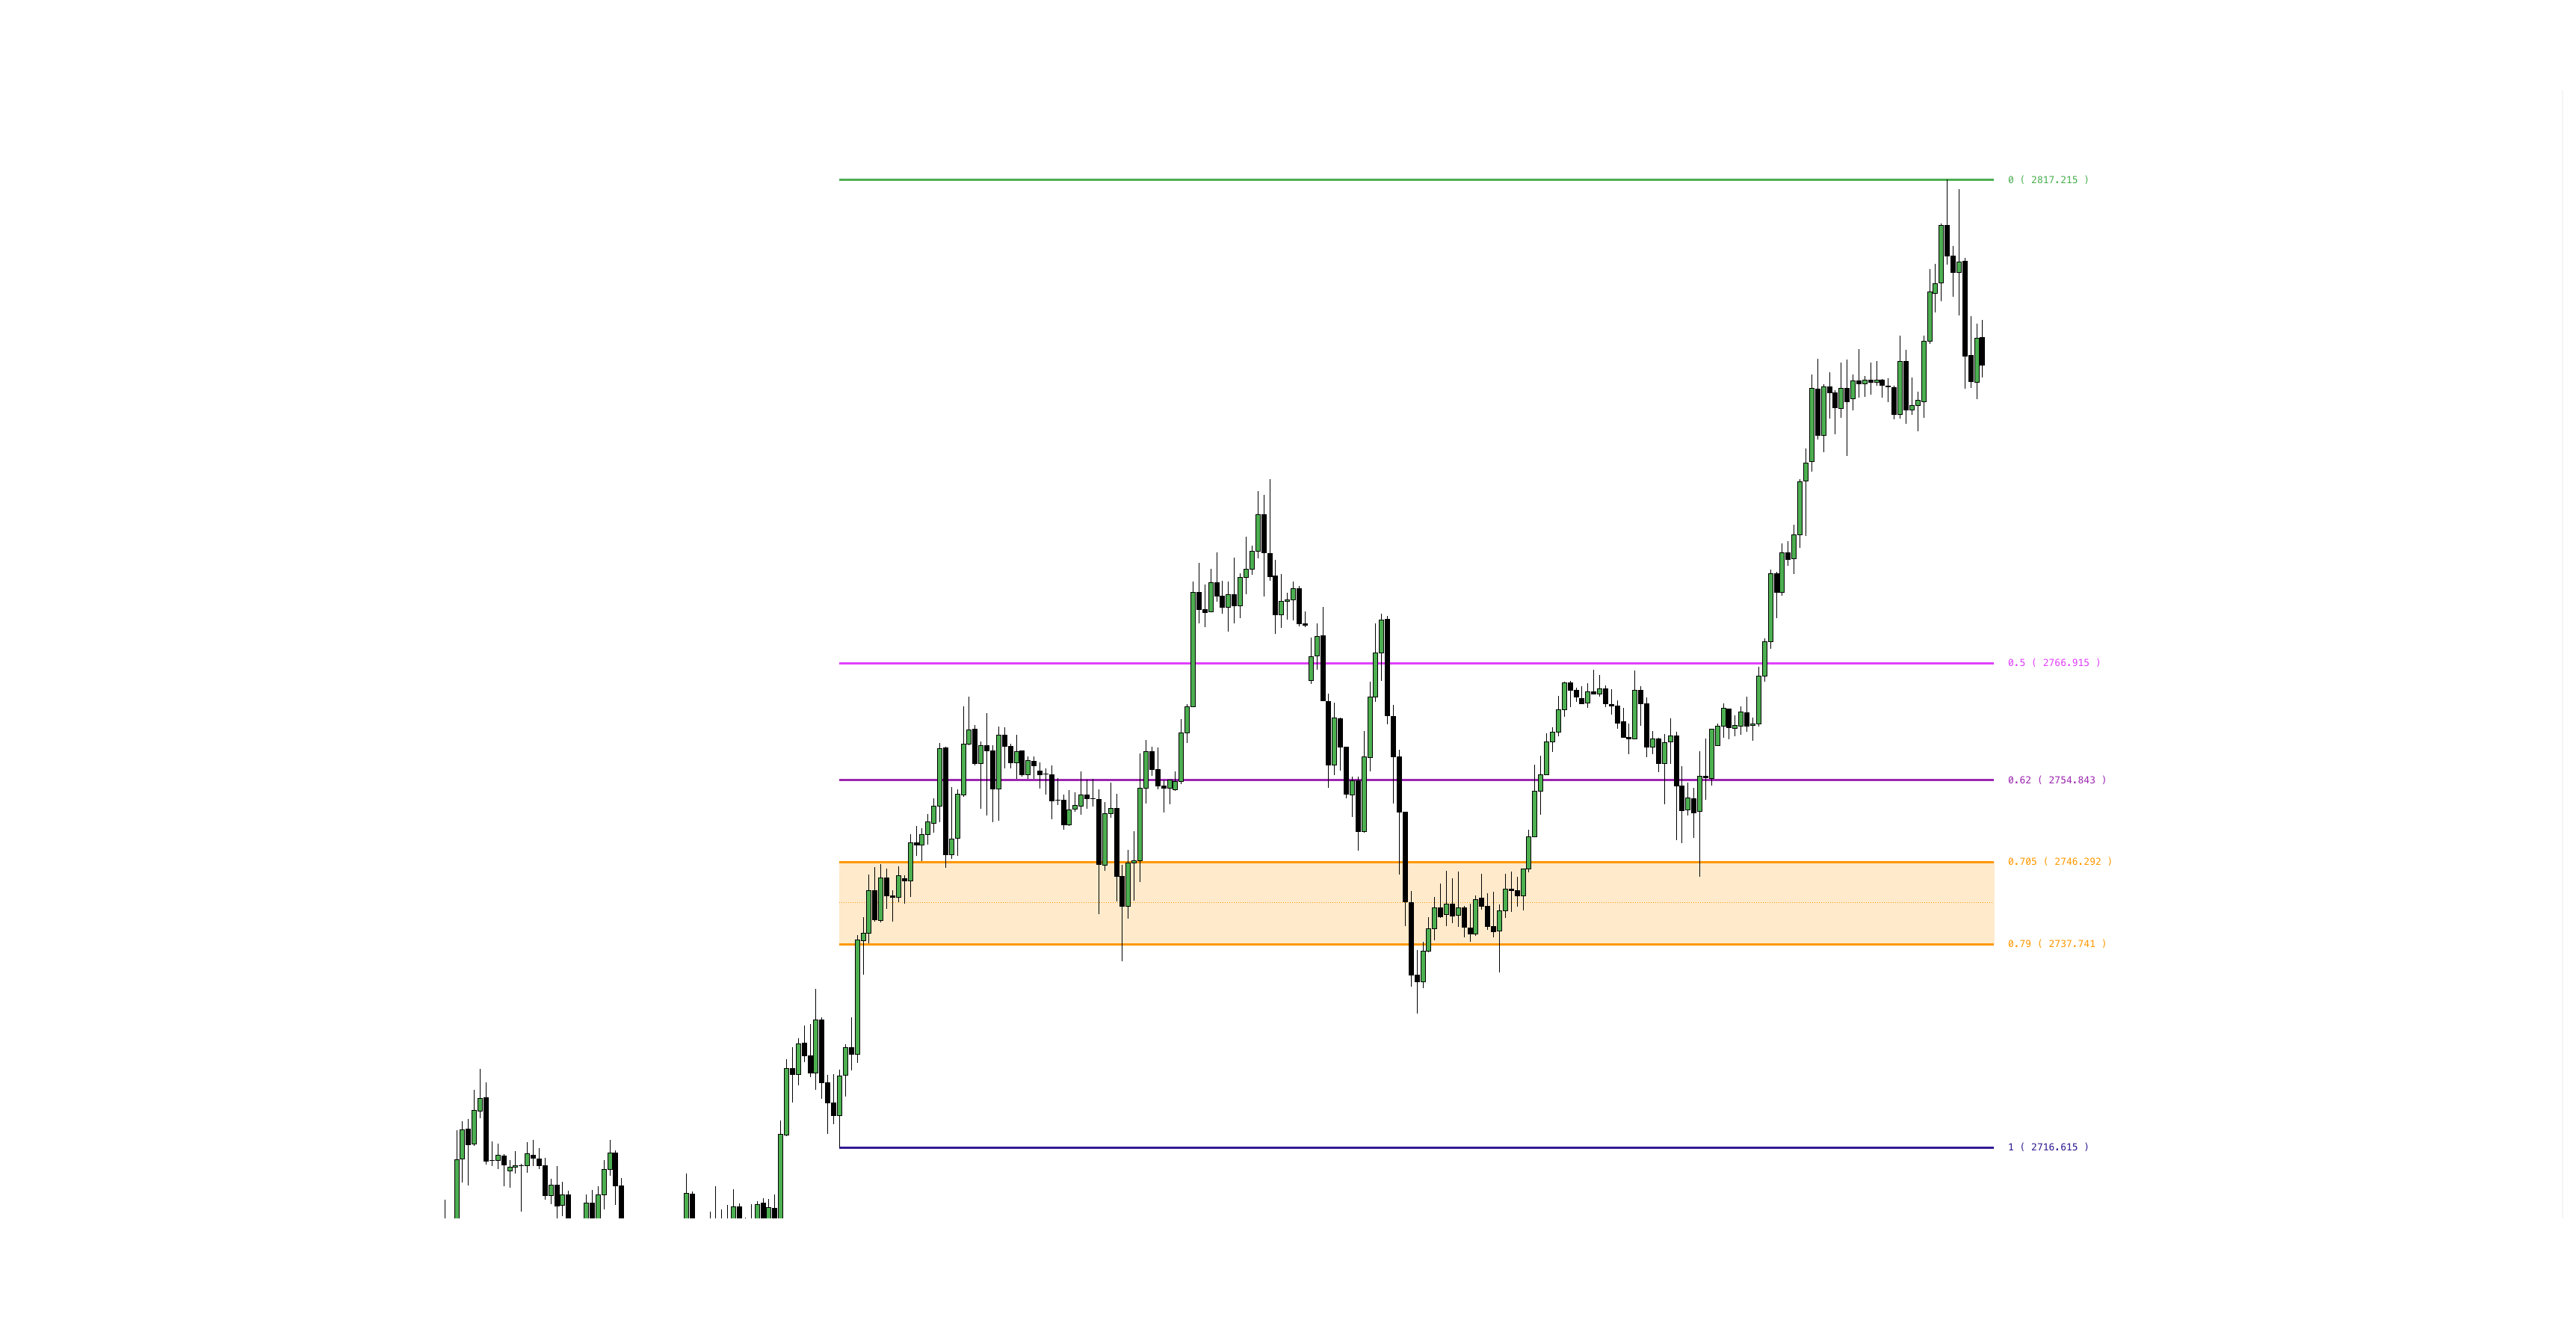
Fibonacci Retracement
Used to identify potential reversal zones and structural support/resistance during market pullbacks.
Fibonacci Retracement
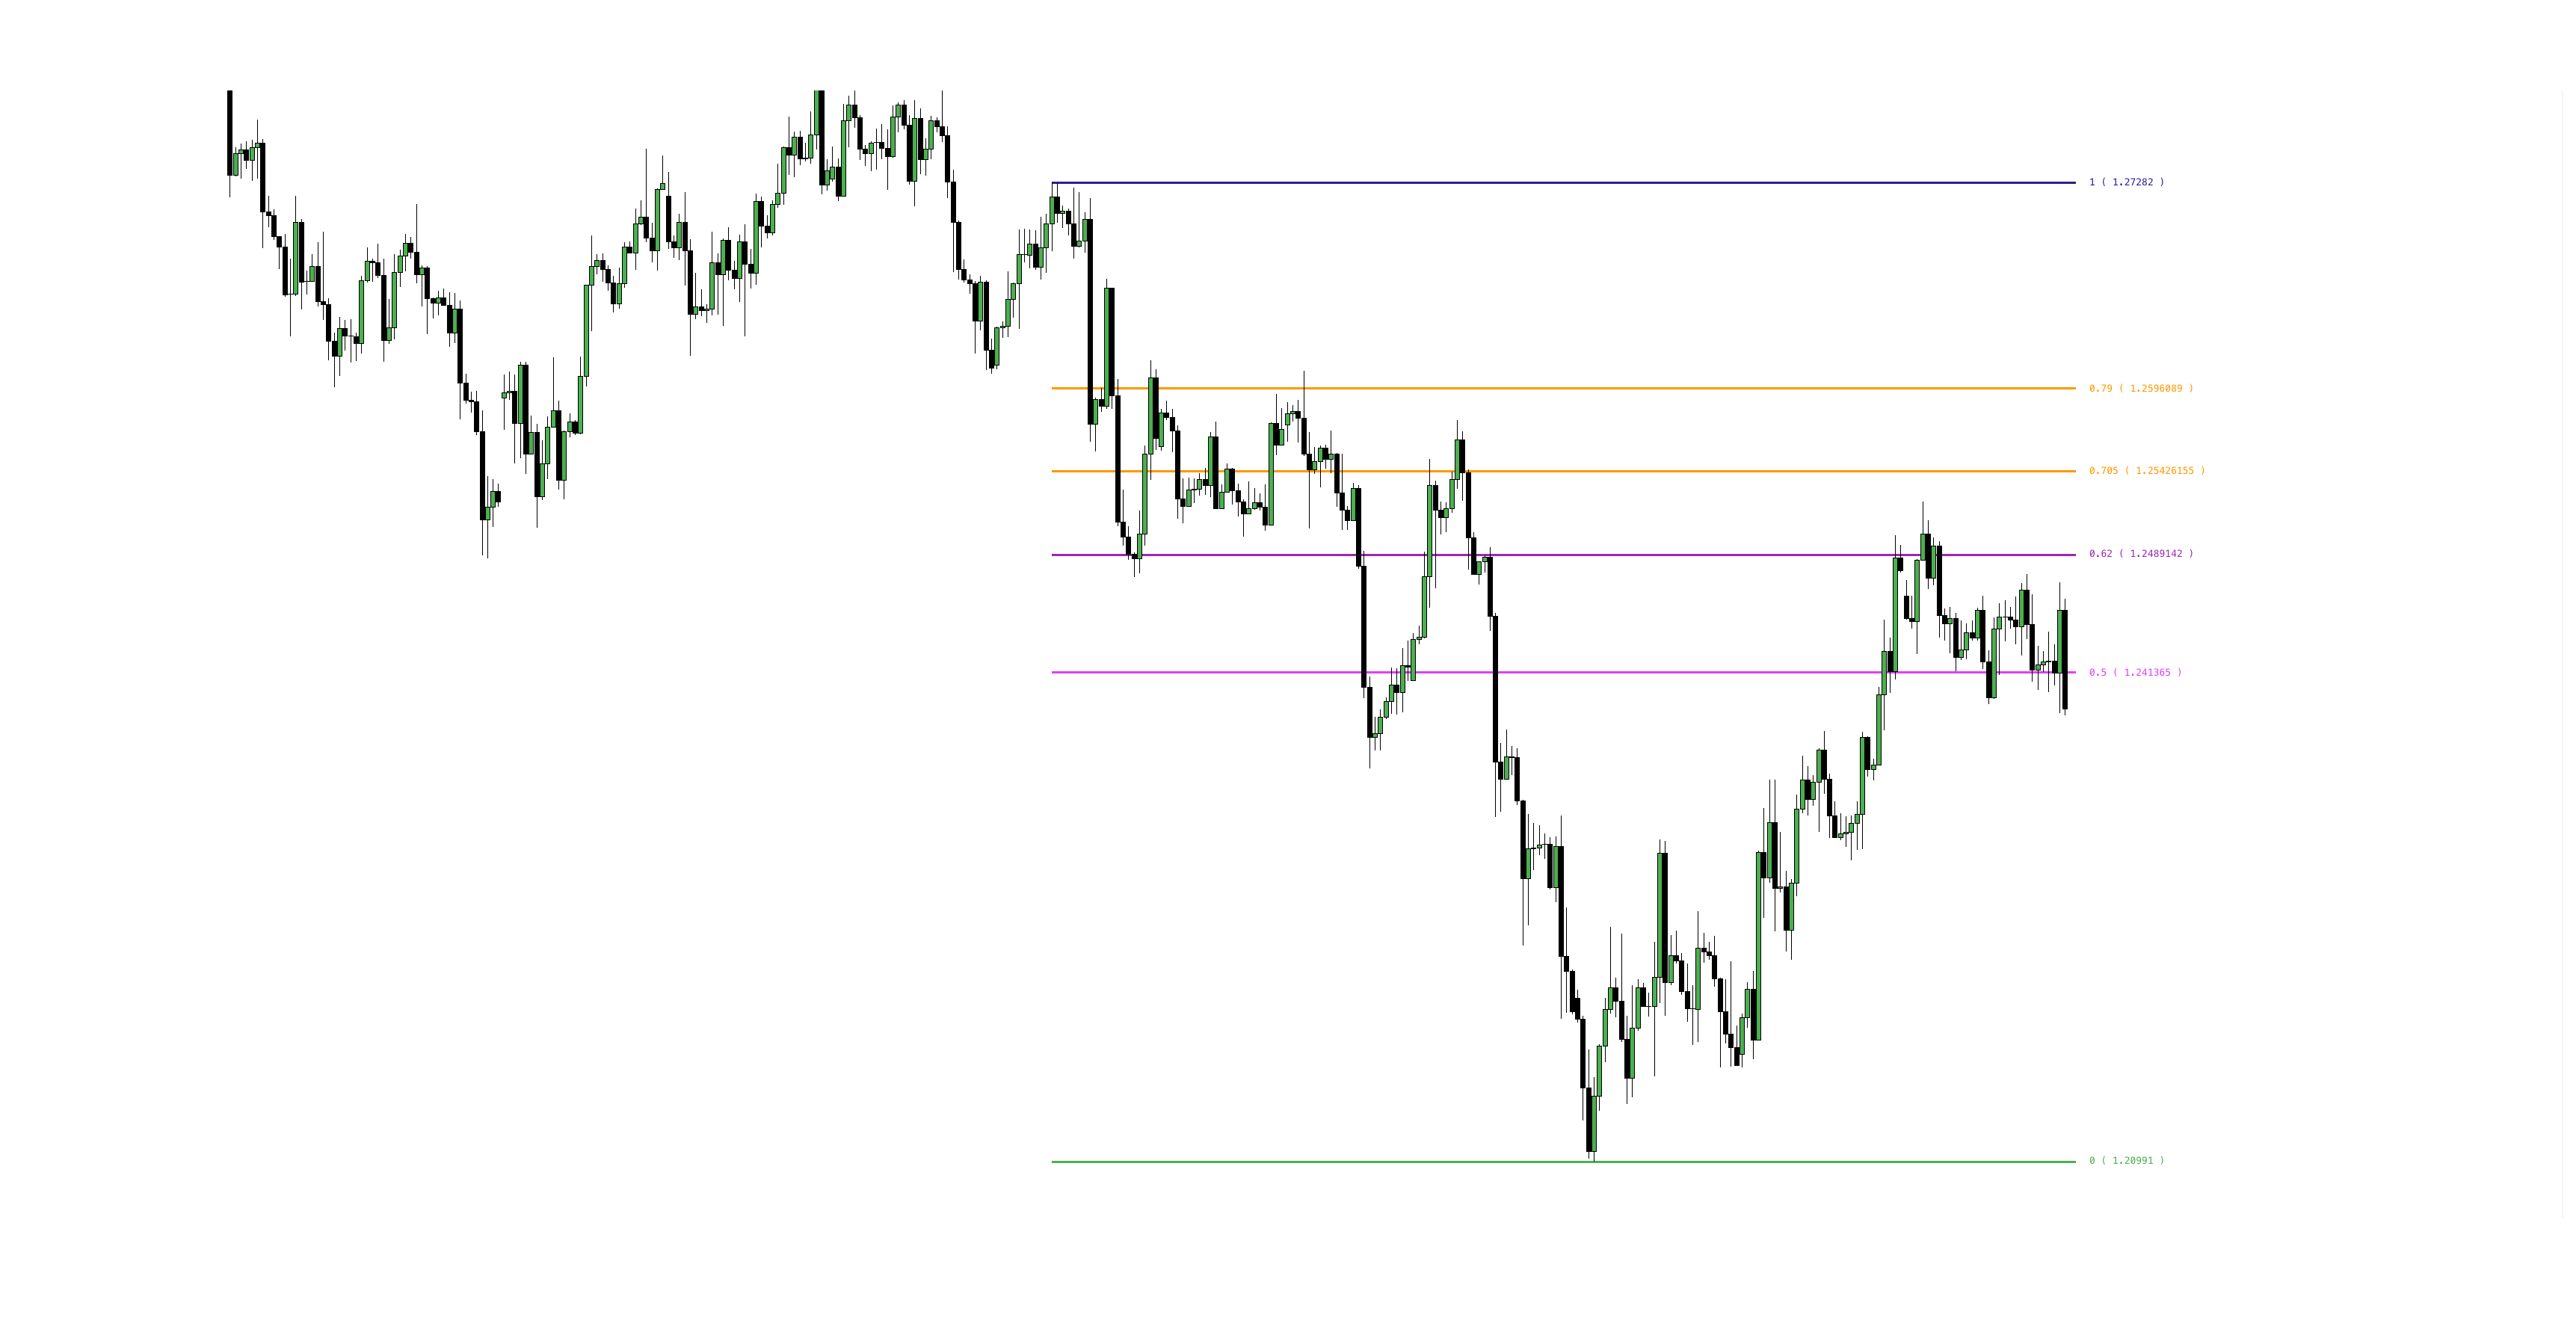
Fibonacci Extension
Used to project profit-taking levels and price targets beyond previous swing highs or lows during trend continuations.
Fibonacci Extension
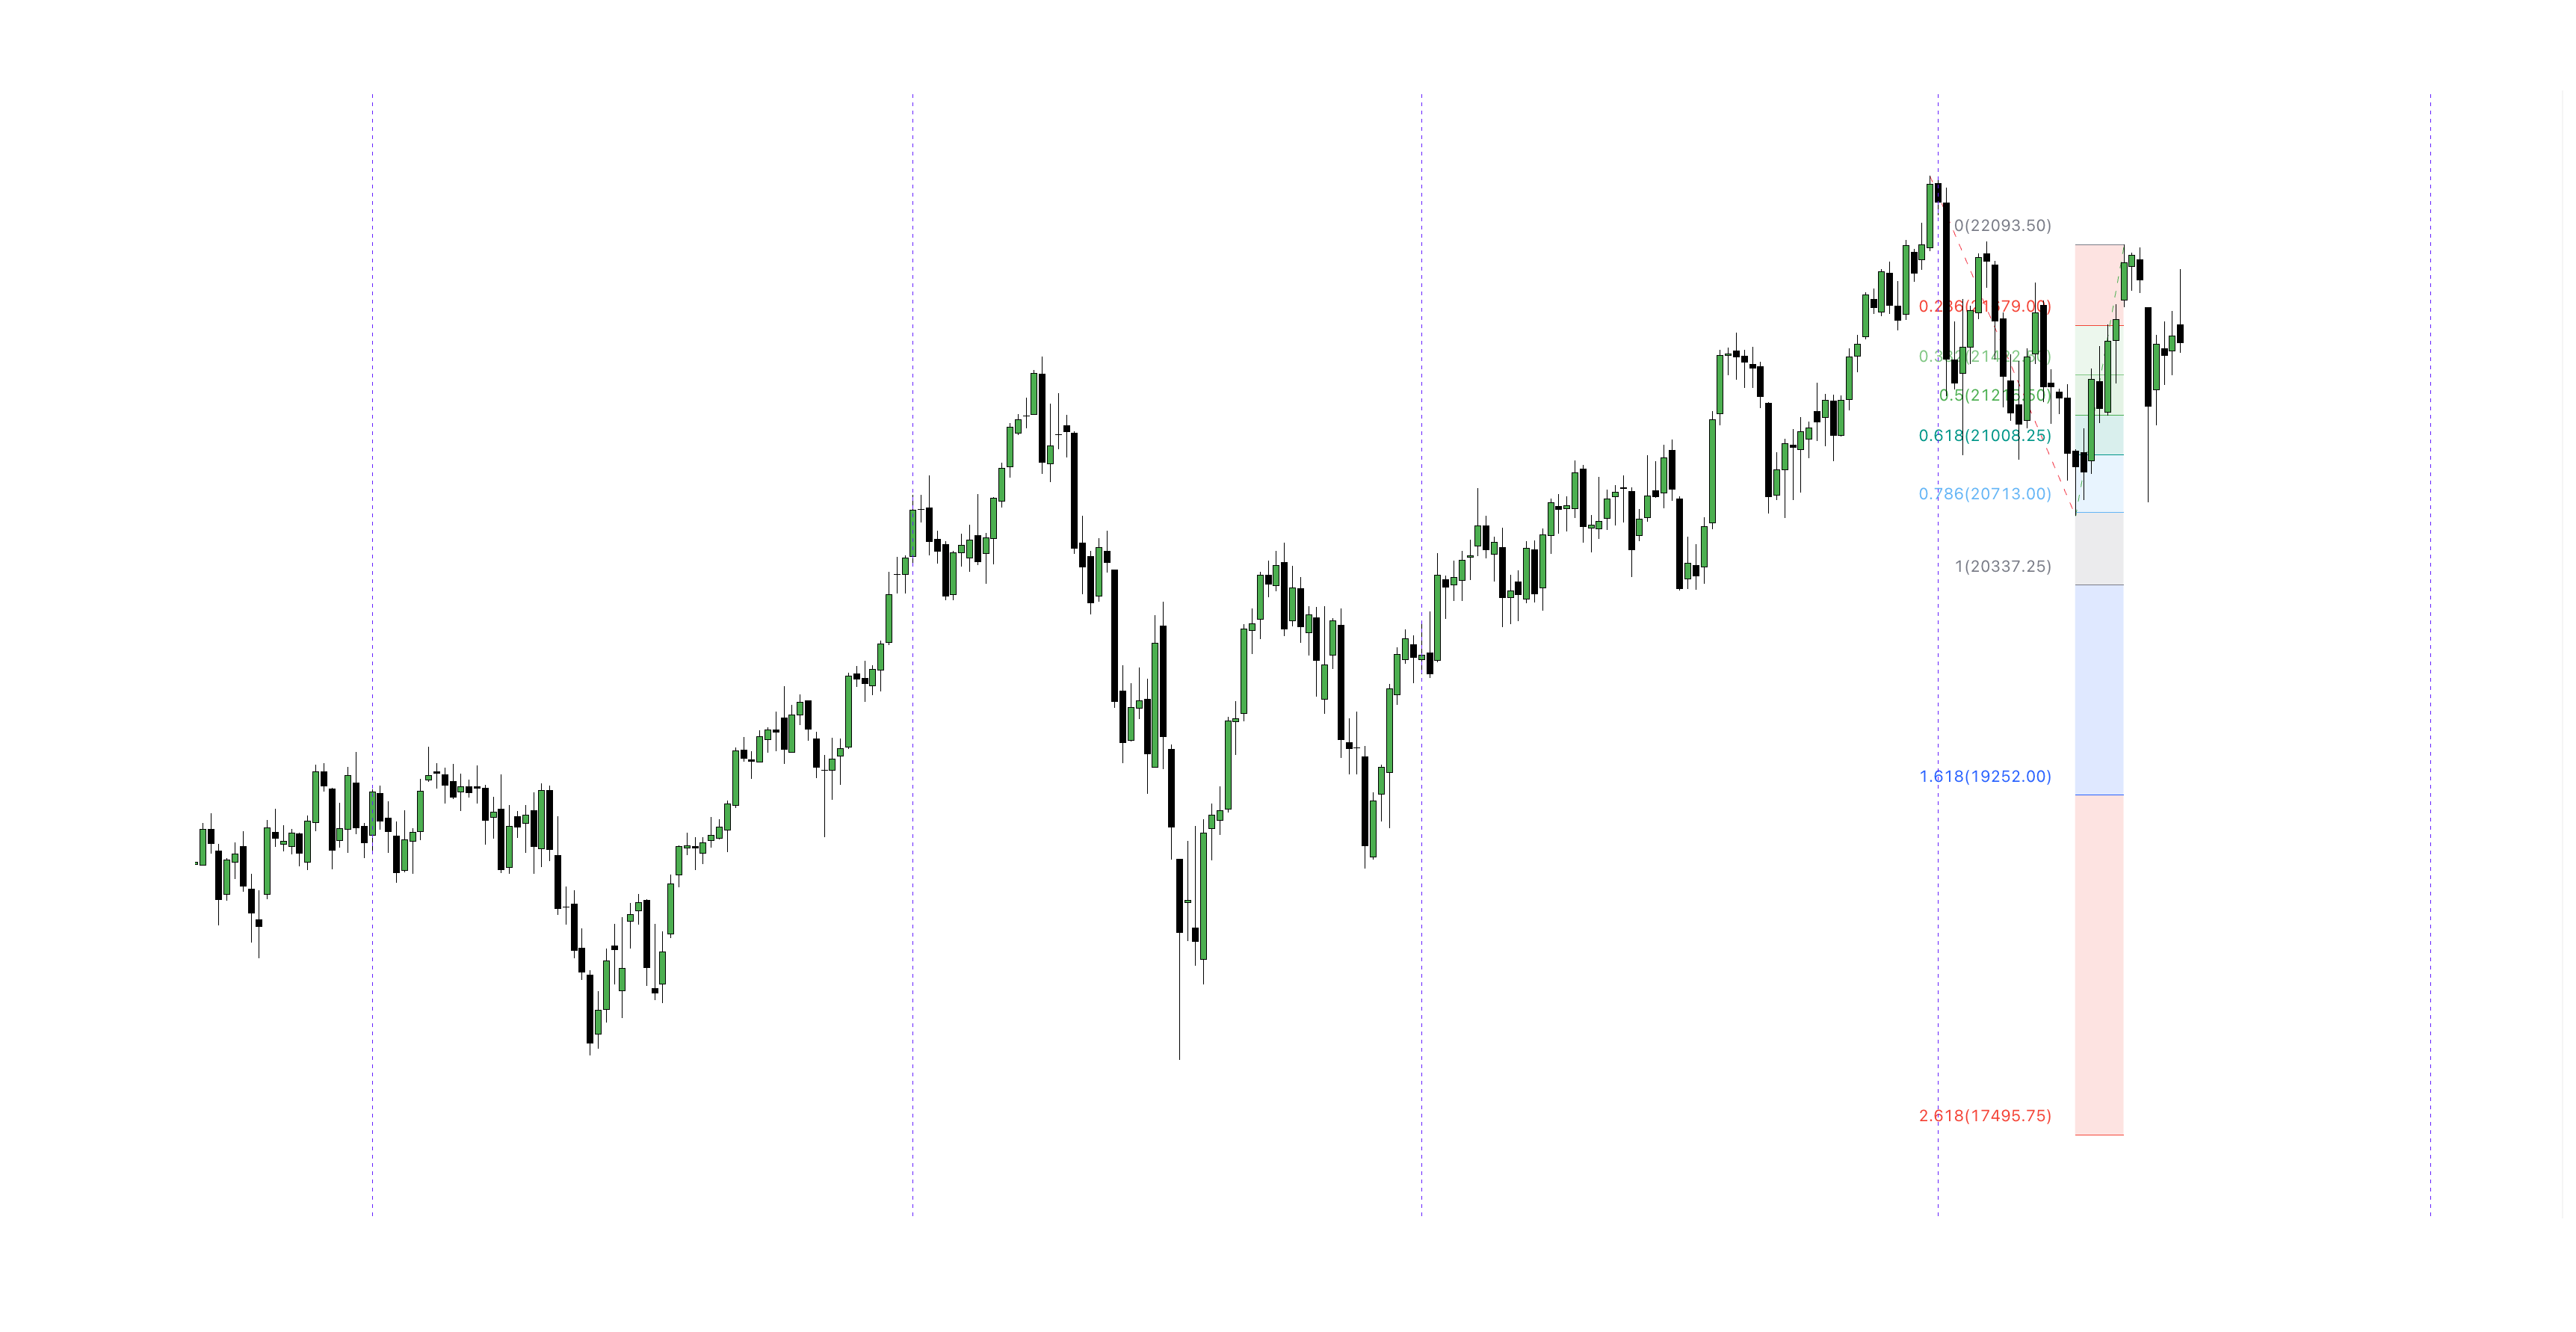
Advanced Geometric Tools
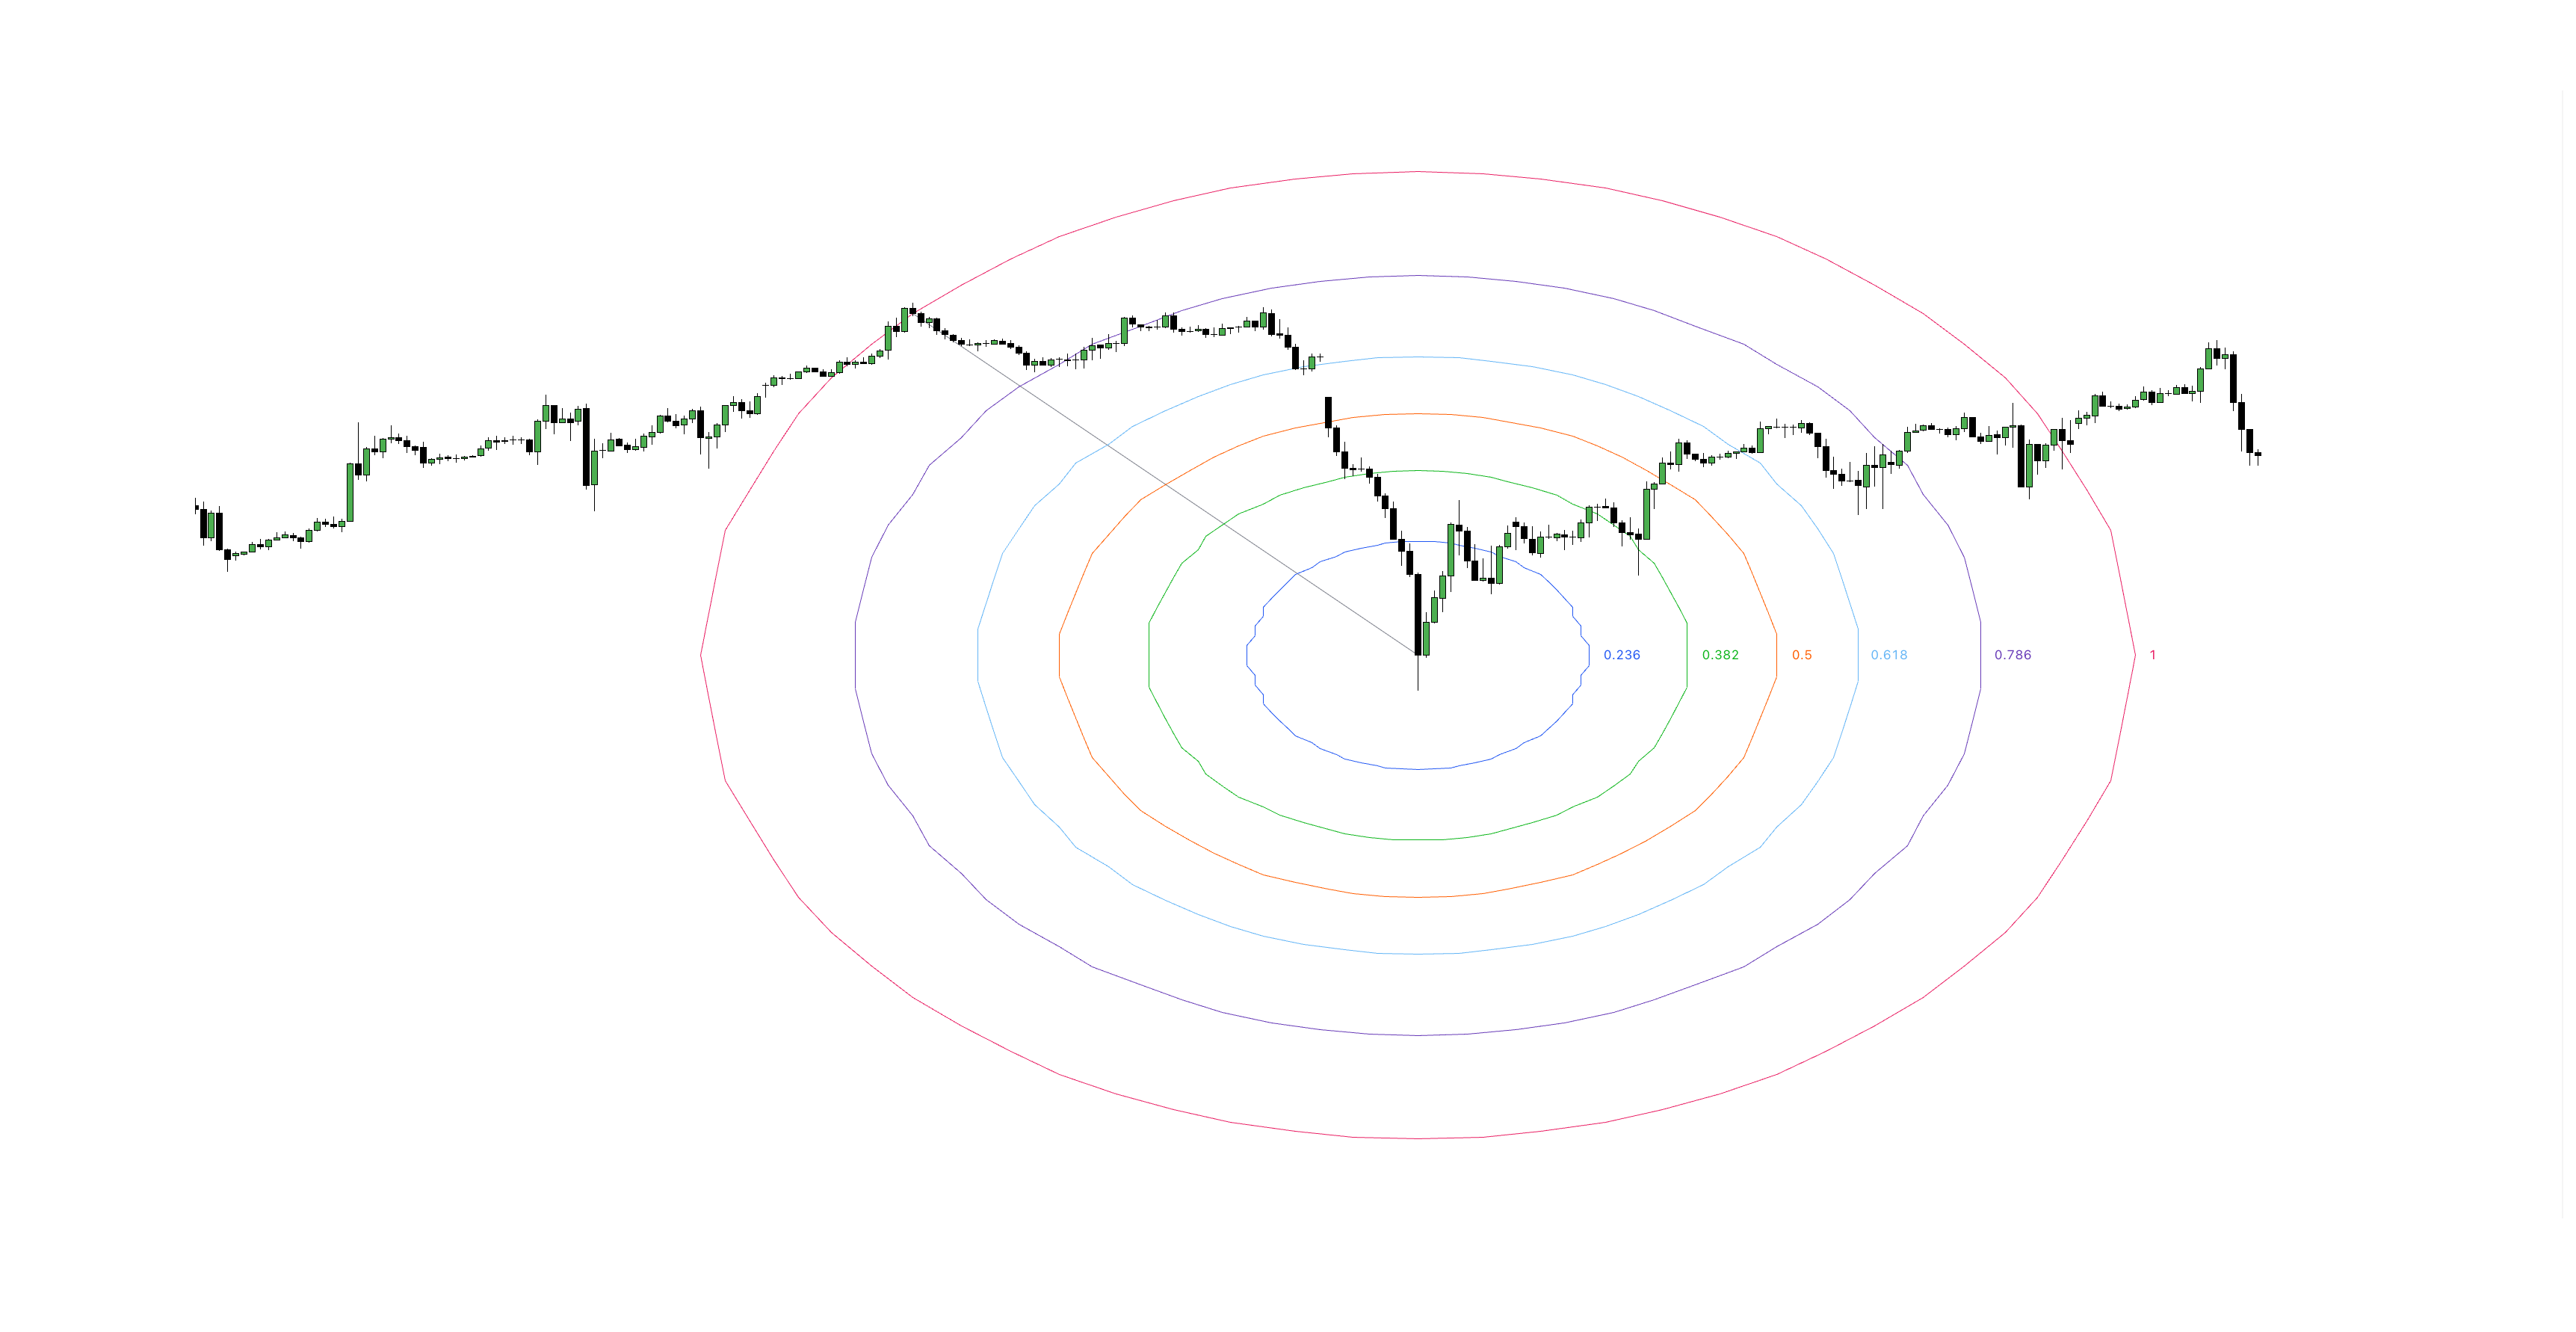
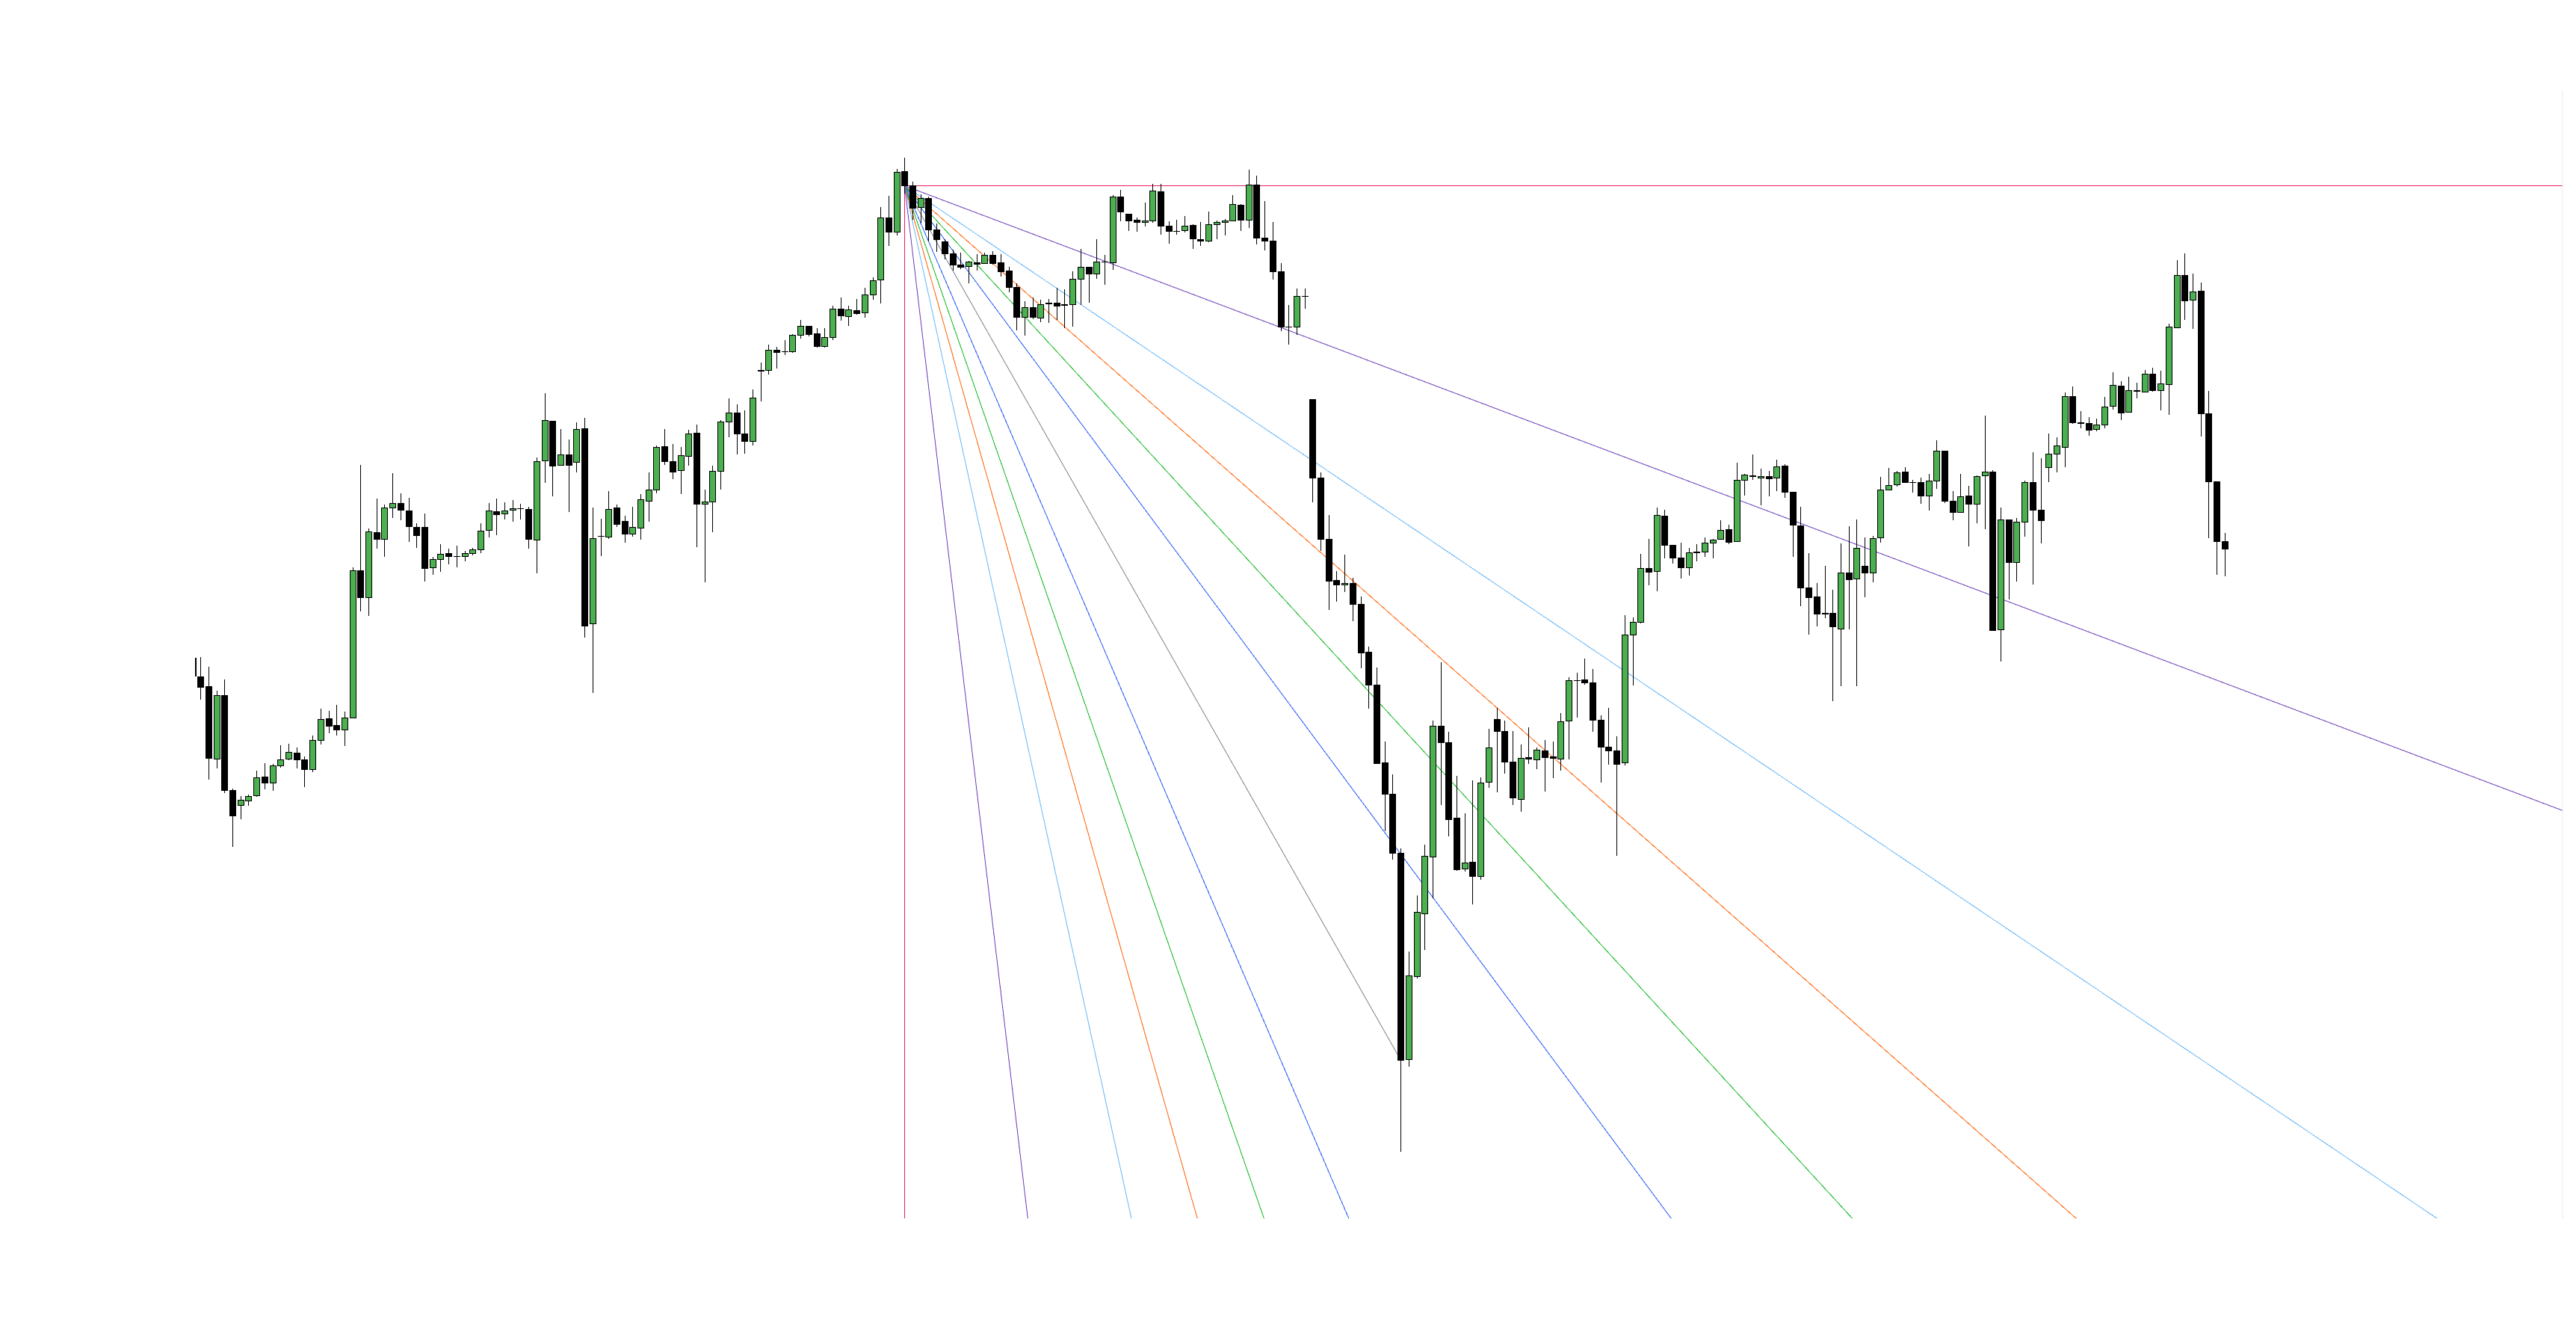
Traders also utilize multidimensional tools like Fibonacci Circles, Fans, and Time Zones to analyze price-time relationships across multiple dimensions.
Circles
Fibonacci Circles
Fans
Fibonacci Fans
3. Applying Fibonacci in Trading
Step 1: Identifying Swing Highs and Swing Lows
To apply Fibonacci tools accurately, start by identifying the major impulse wave on your active timeframe:
- Swing High: The prominent peak established before a market pull-back or correction.
- Swing Low: The structural trough formed before an upward price expansion.
Step 2: Drawing Fibonacci Retracement Levels
Once swing points are established, select the Fibonacci Retracement tool on your charting platform (such as TradingView):
- Bullish Trend (Uptrend): Click and drag from the Swing Low up to the Swing High.
- Bearish Trend (Downtrend): Click and drag from the Swing High down to the Swing Low.
The plotted horizontal lines create dynamic target zones where price is statistically likely to find support or resistance.
4. Advanced Fibonacci Concepts
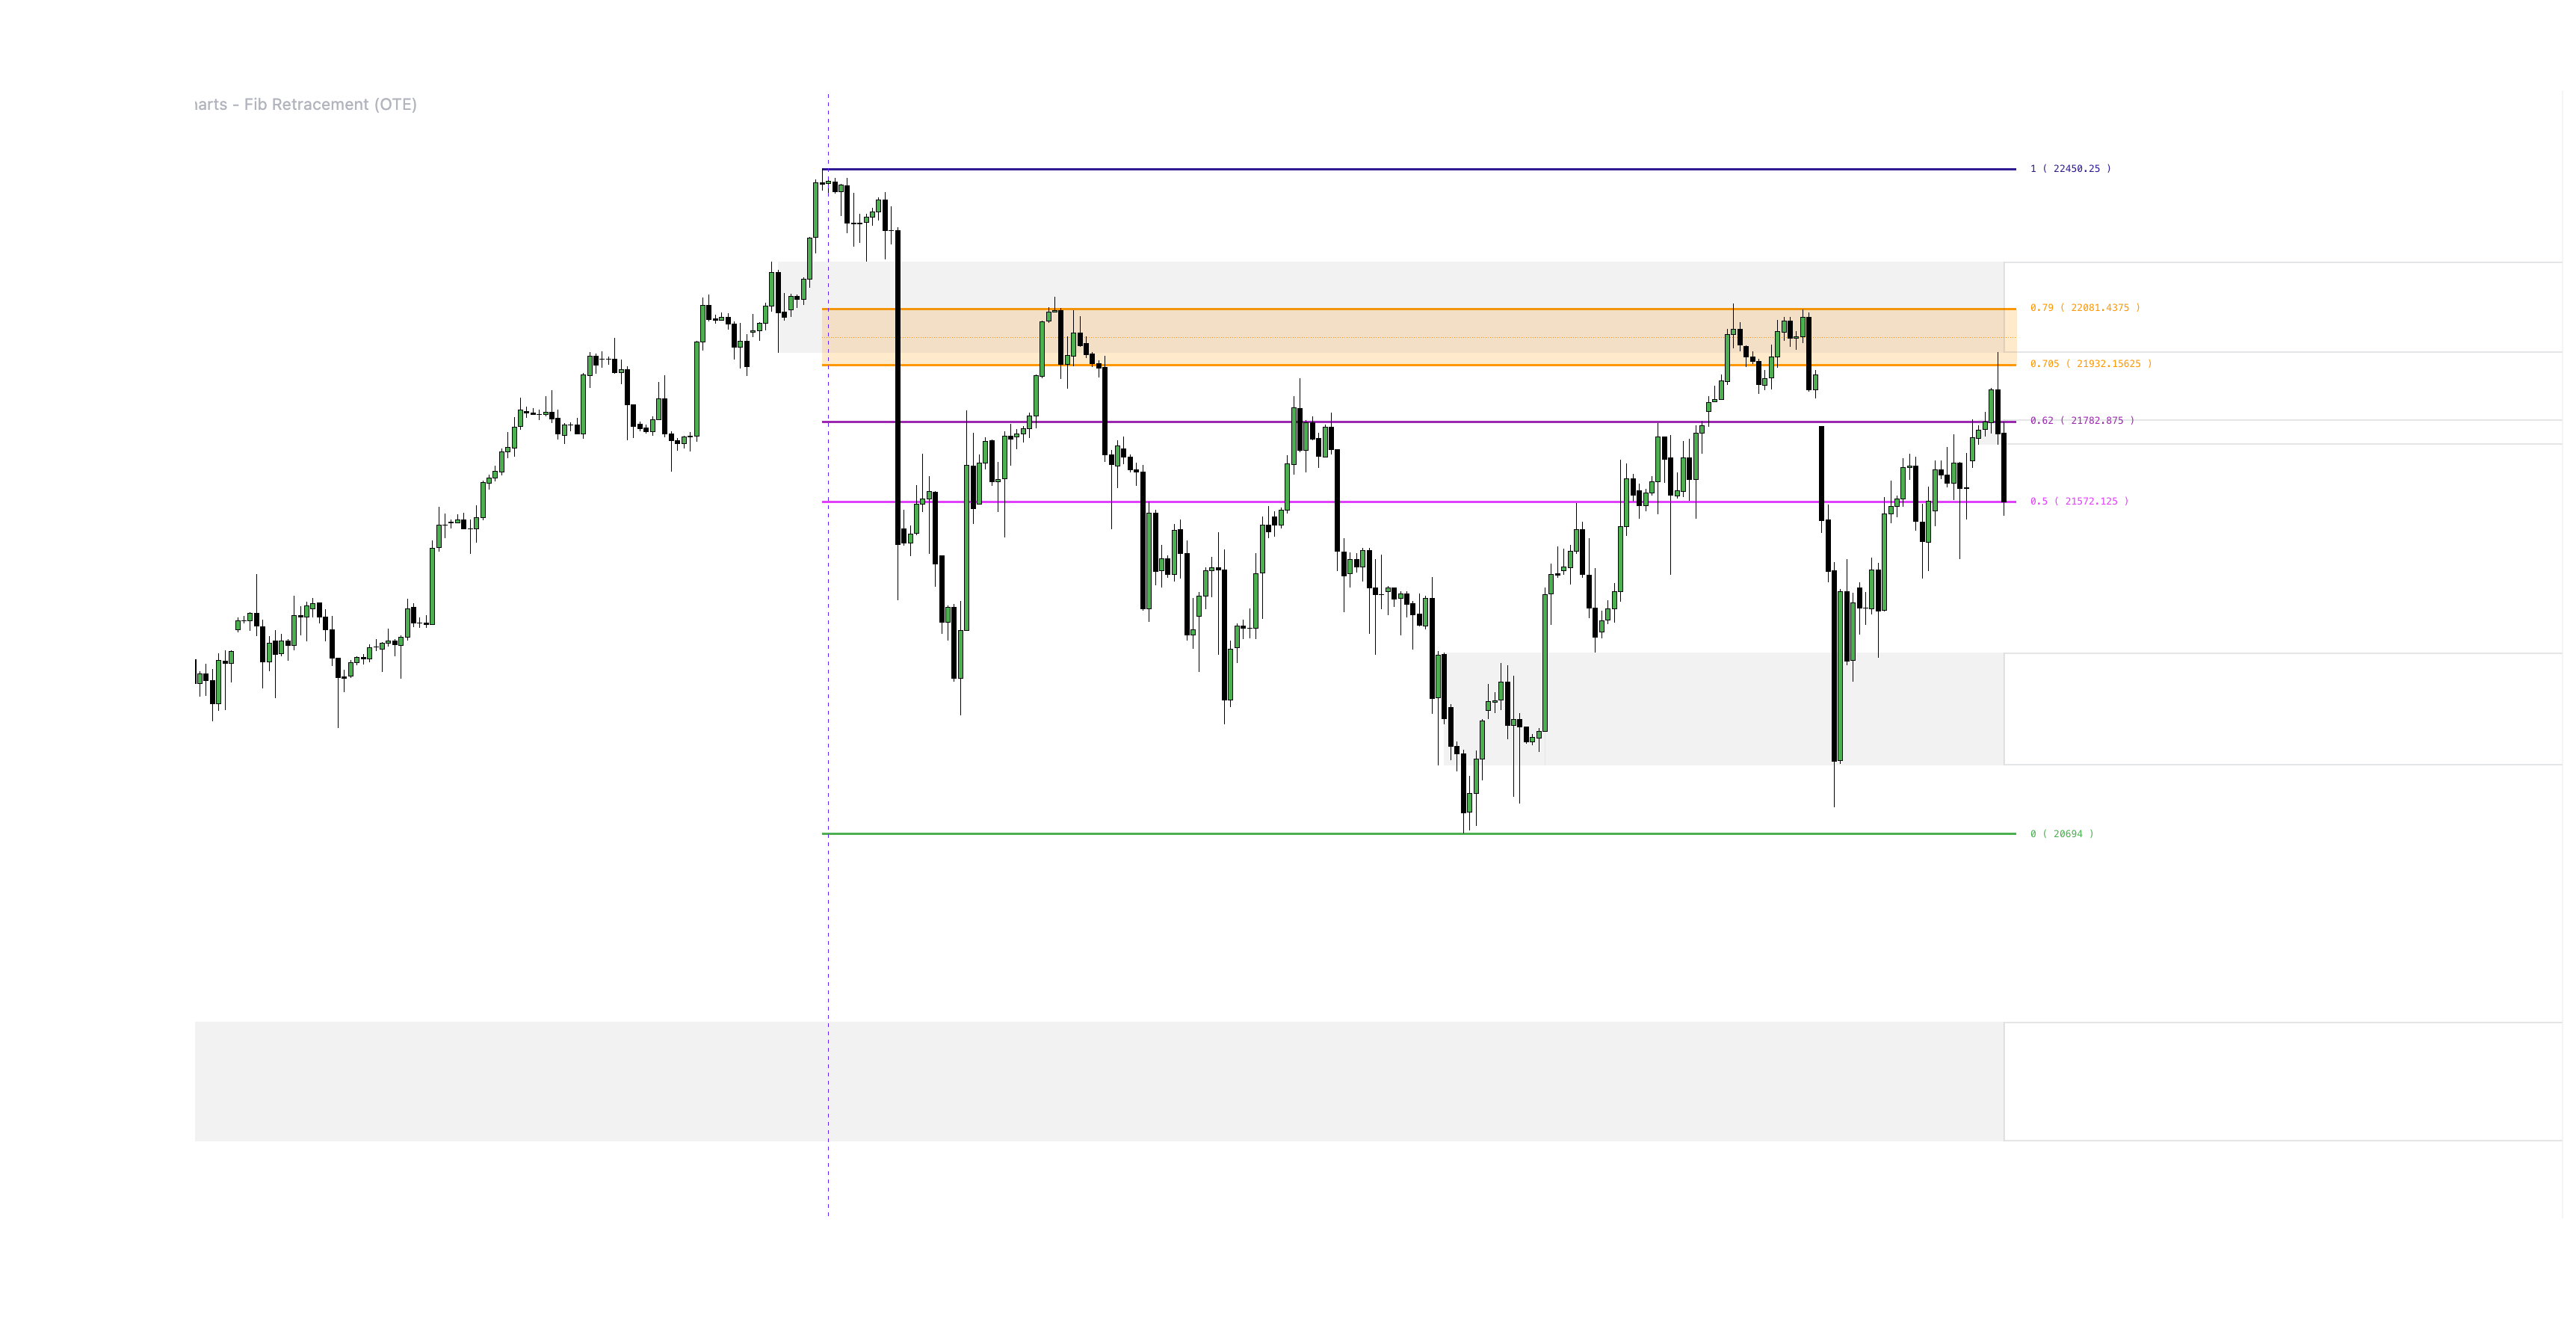
ICT Optimal Trade Entry (OTE) Zone
Popularized by Inner Circle Trader (ICT), the Optimal Trade Entry (OTE) framework focuses specifically on the 0.618 to 0.786 retracement band. This region represents the optimal balance point where institutional liquidity collects before a primary trend resumes.
ICT Optimal Trade Entry OTE Zone
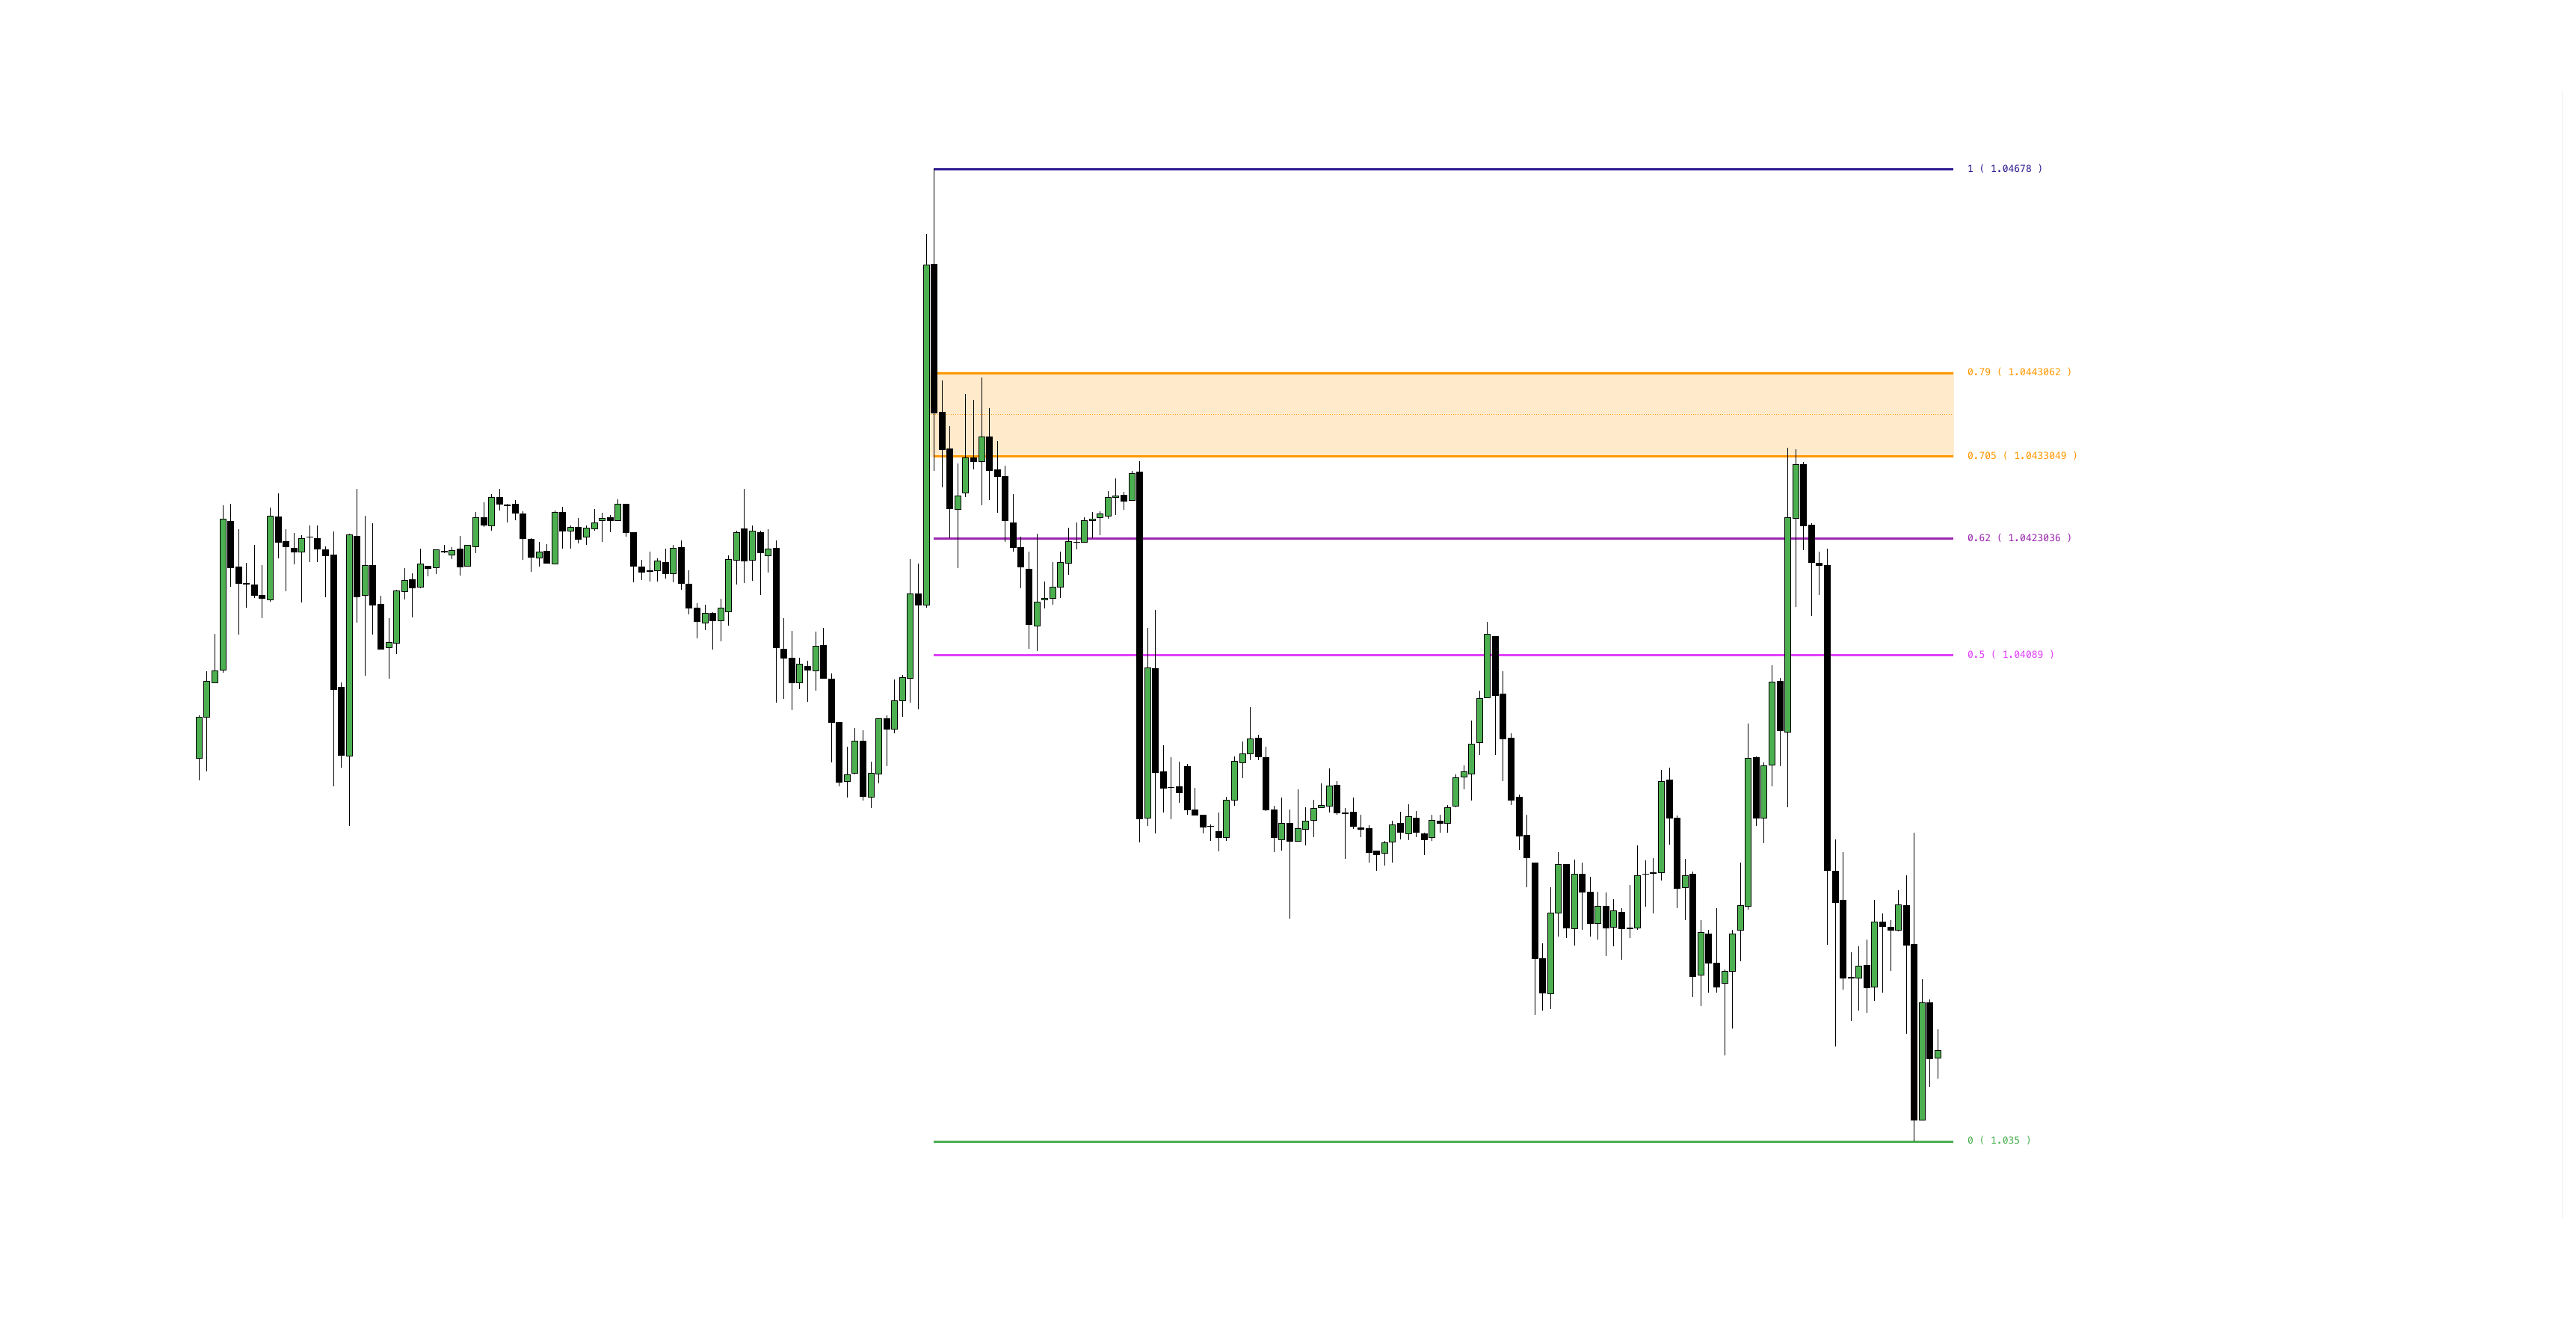
- Bullish OTE Setup: In a rising market, price retracing into the 61.8%–78.6% band provides a high-probability, low-risk long entry with clear stop-loss placement below the swing low.
- Bearish OTE Setup: In a declining market, a rally into the 61.8%–78.6% band presents a premium short opportunity with risk defined above the swing high.
The Golden Pocket
The narrow corridor between 0.618 and 0.650 is universally known among institutional traders as the "Golden Pocket." Algorithms and market makers heavily target this zone to fill institutional buy/sell orders, making it one of the highest-win-rate reversal zones in technical analysis.
Fibonacci Time Zones
While standard retracements analyze vertical price distance, Fibonacci Time Zones project horizontal timing windows. By placing vertical lines at Fibonacci number intervals (1, 2, 3, 5, 8, 13, 21...), traders can forecast when major volatility spikes or trend turns are likely to occur.
Fibonacci Confluence & Clusters
When multiple Fibonacci measurements overlap in the same price region—such as a 61.8% retracement from a higher timeframe aligning with a 161.8% extension from a lower timeframe—it forms a Fibonacci Confluence Zone. These clusters significantly boost trade probability.
5. Combining Fibonacci with Other Tools
Fibonacci levels should never be traded in isolation. Achieving consistent profitability requires combining Fibonacci ratios with complementary price action and volume indicators.
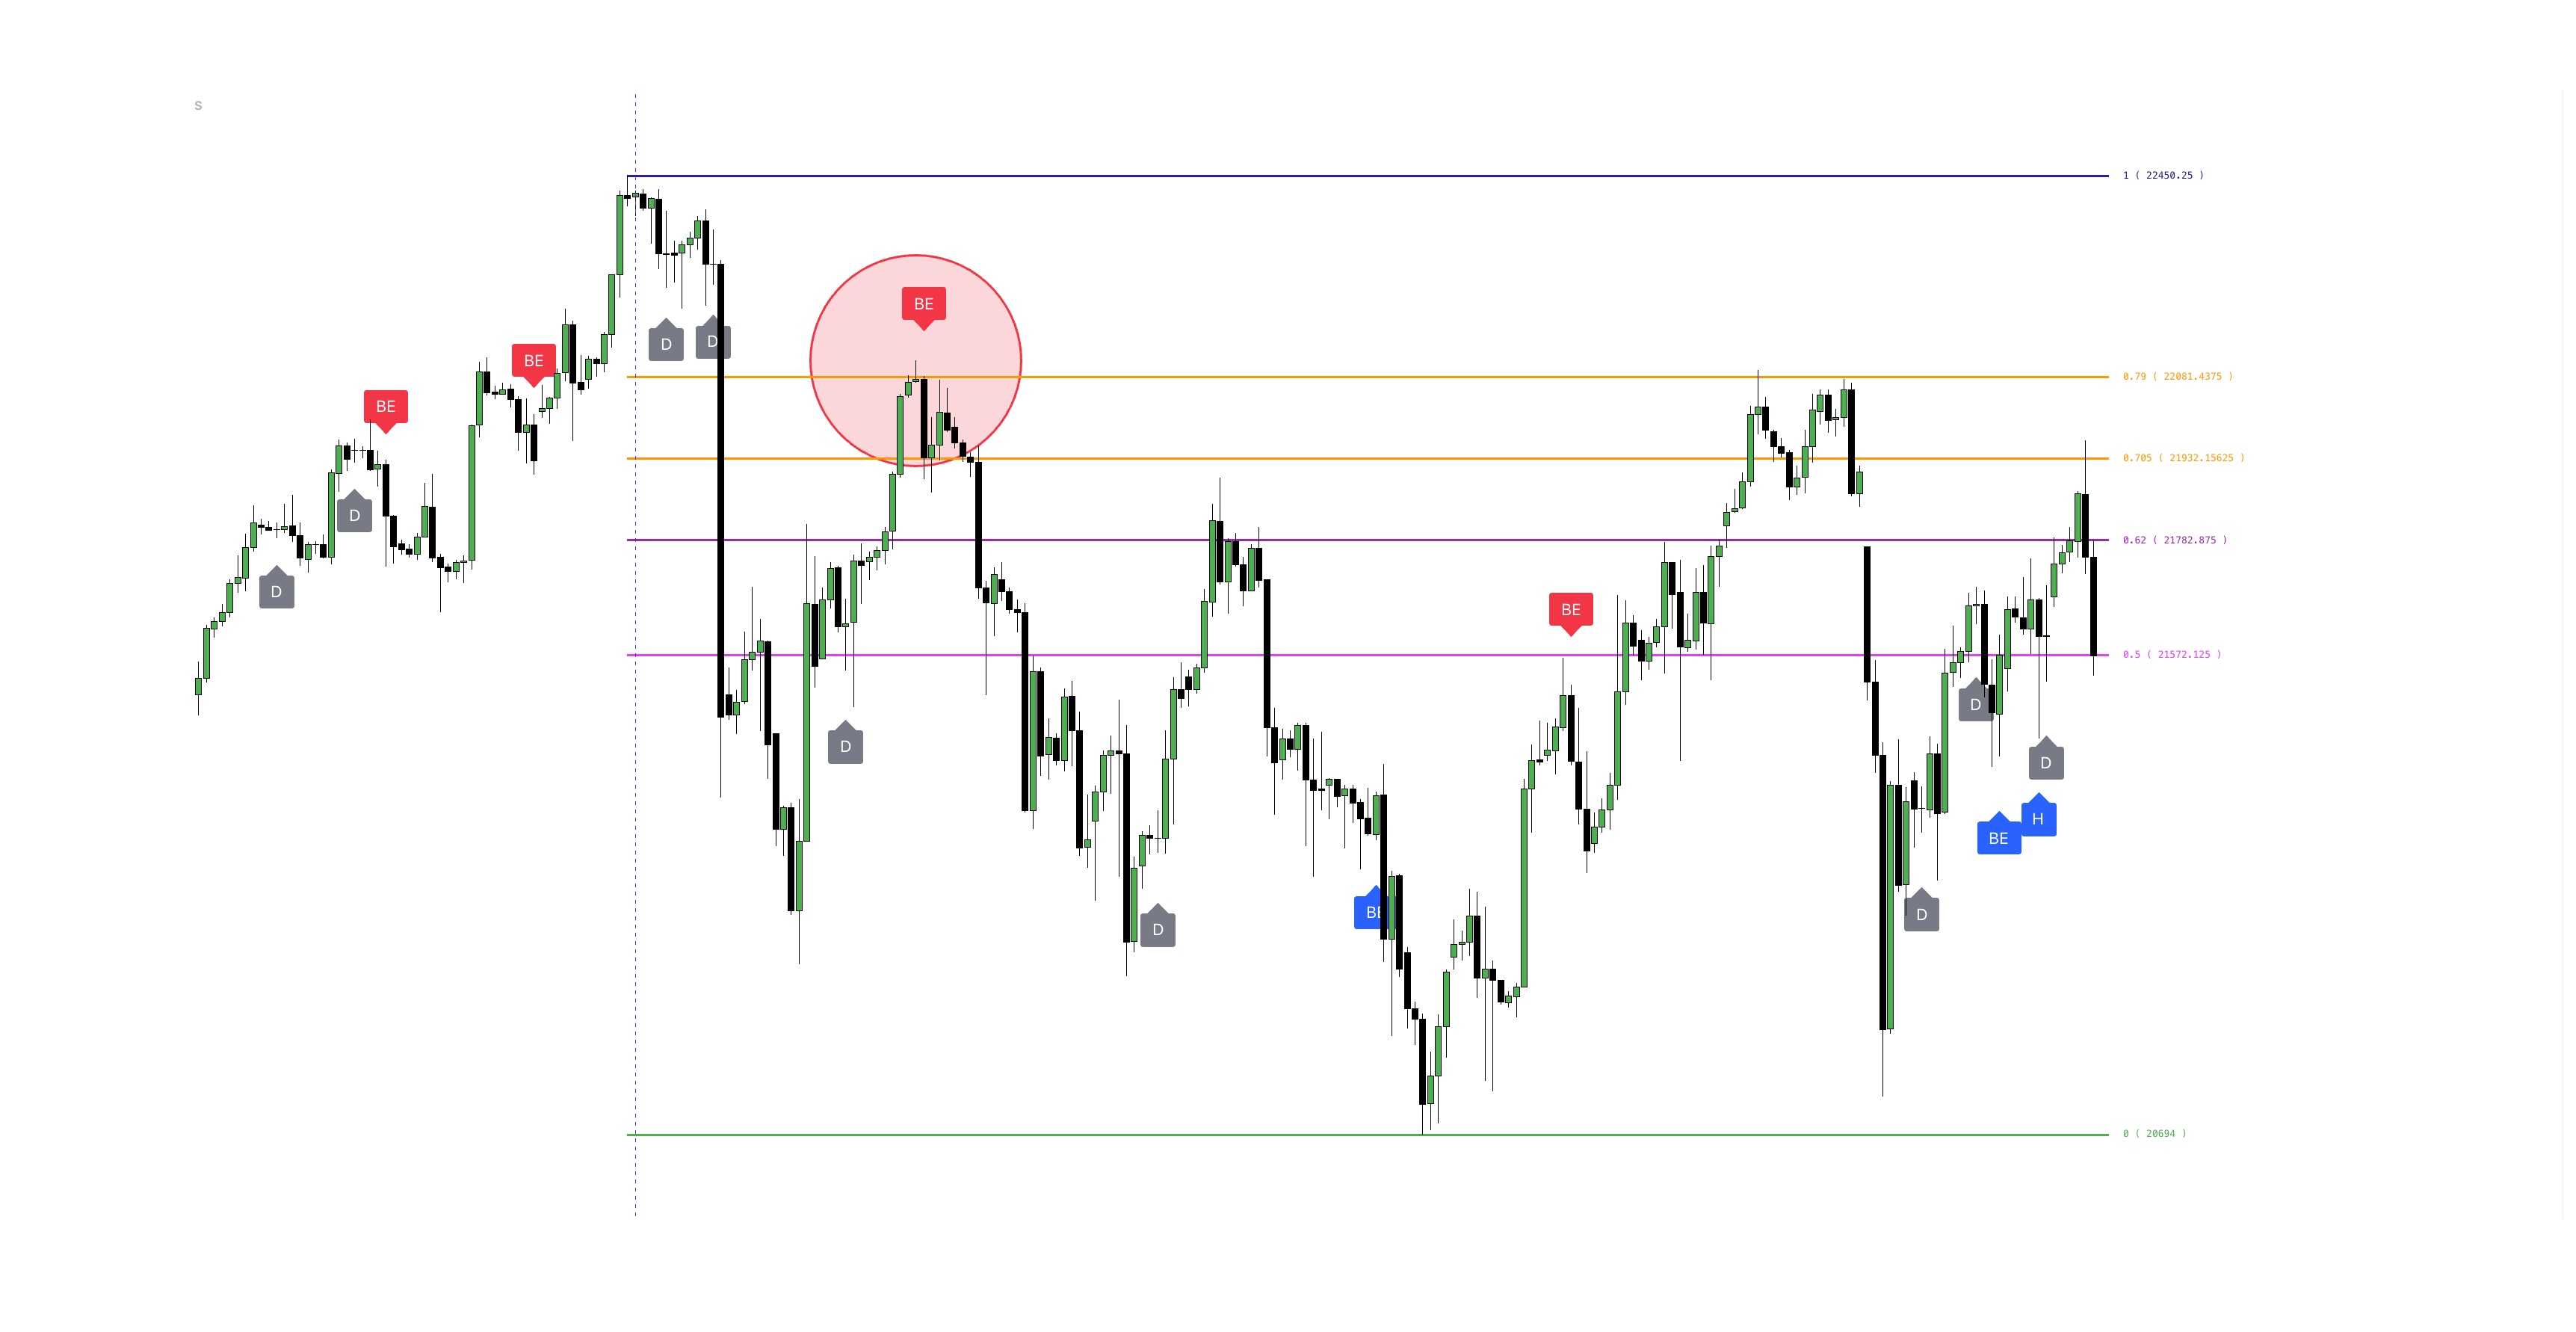
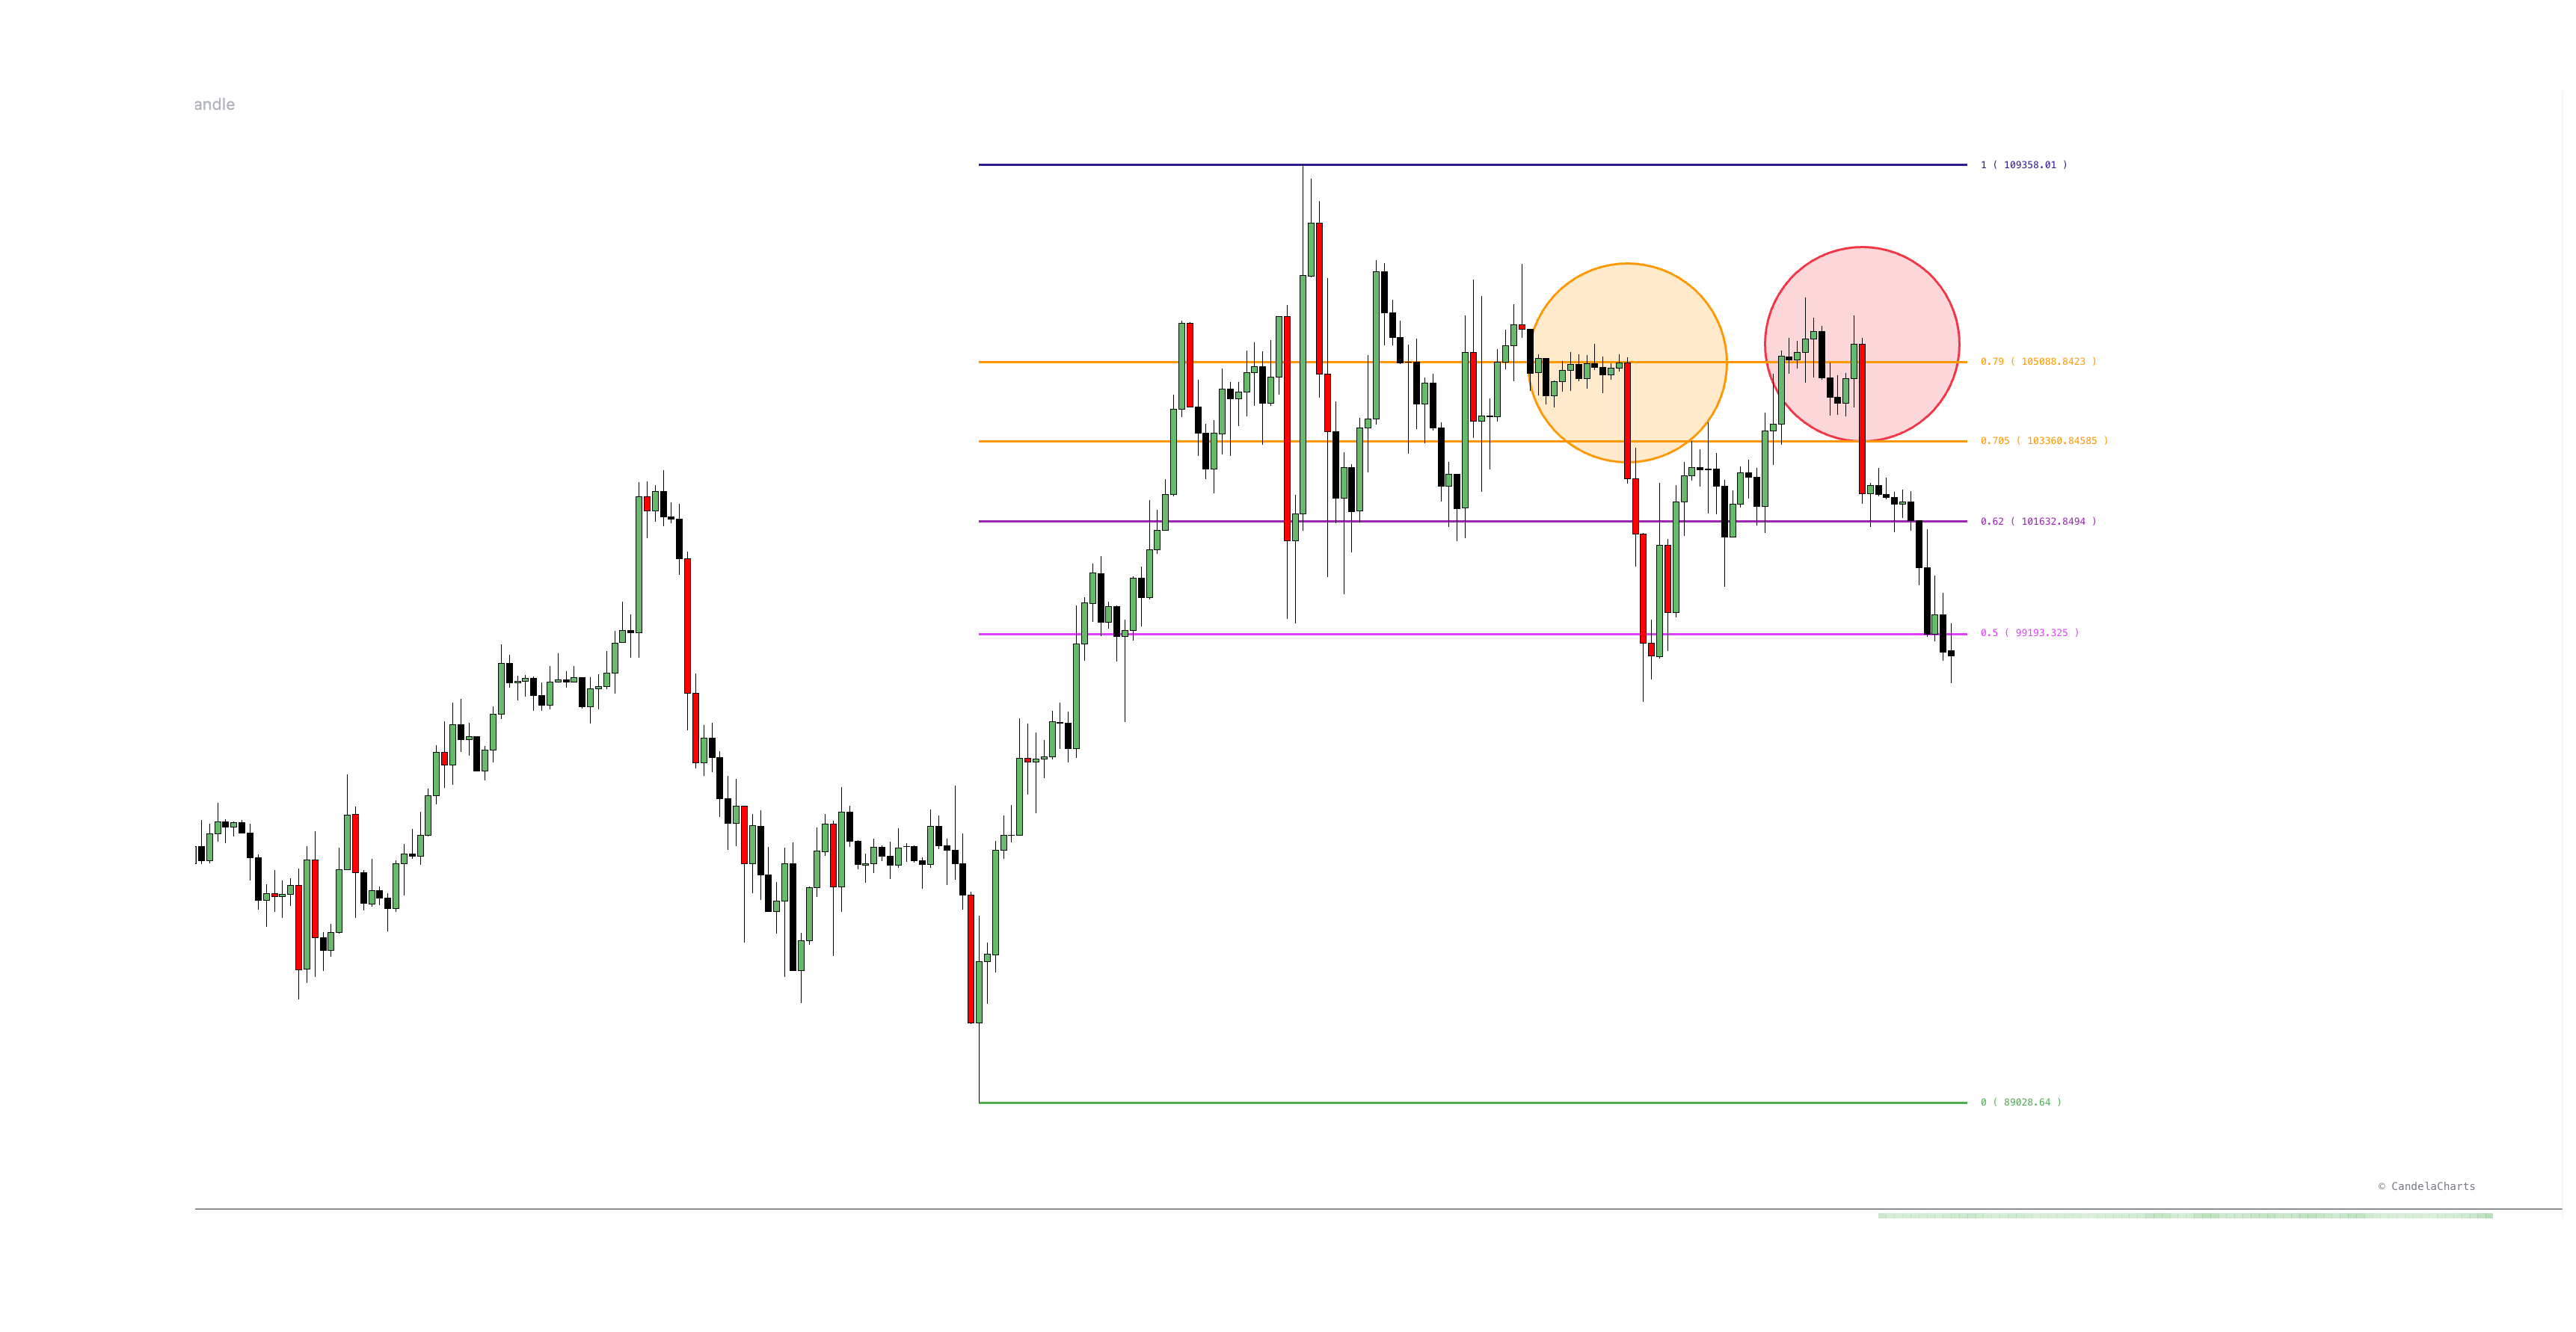
Candlestick Patterns
Look for reversal price action (such as bullish engulfing candles, hammer pins, or morning stars) forming precisely at a key Fibonacci ratio.
Fibonacci with Candlestick Patterns
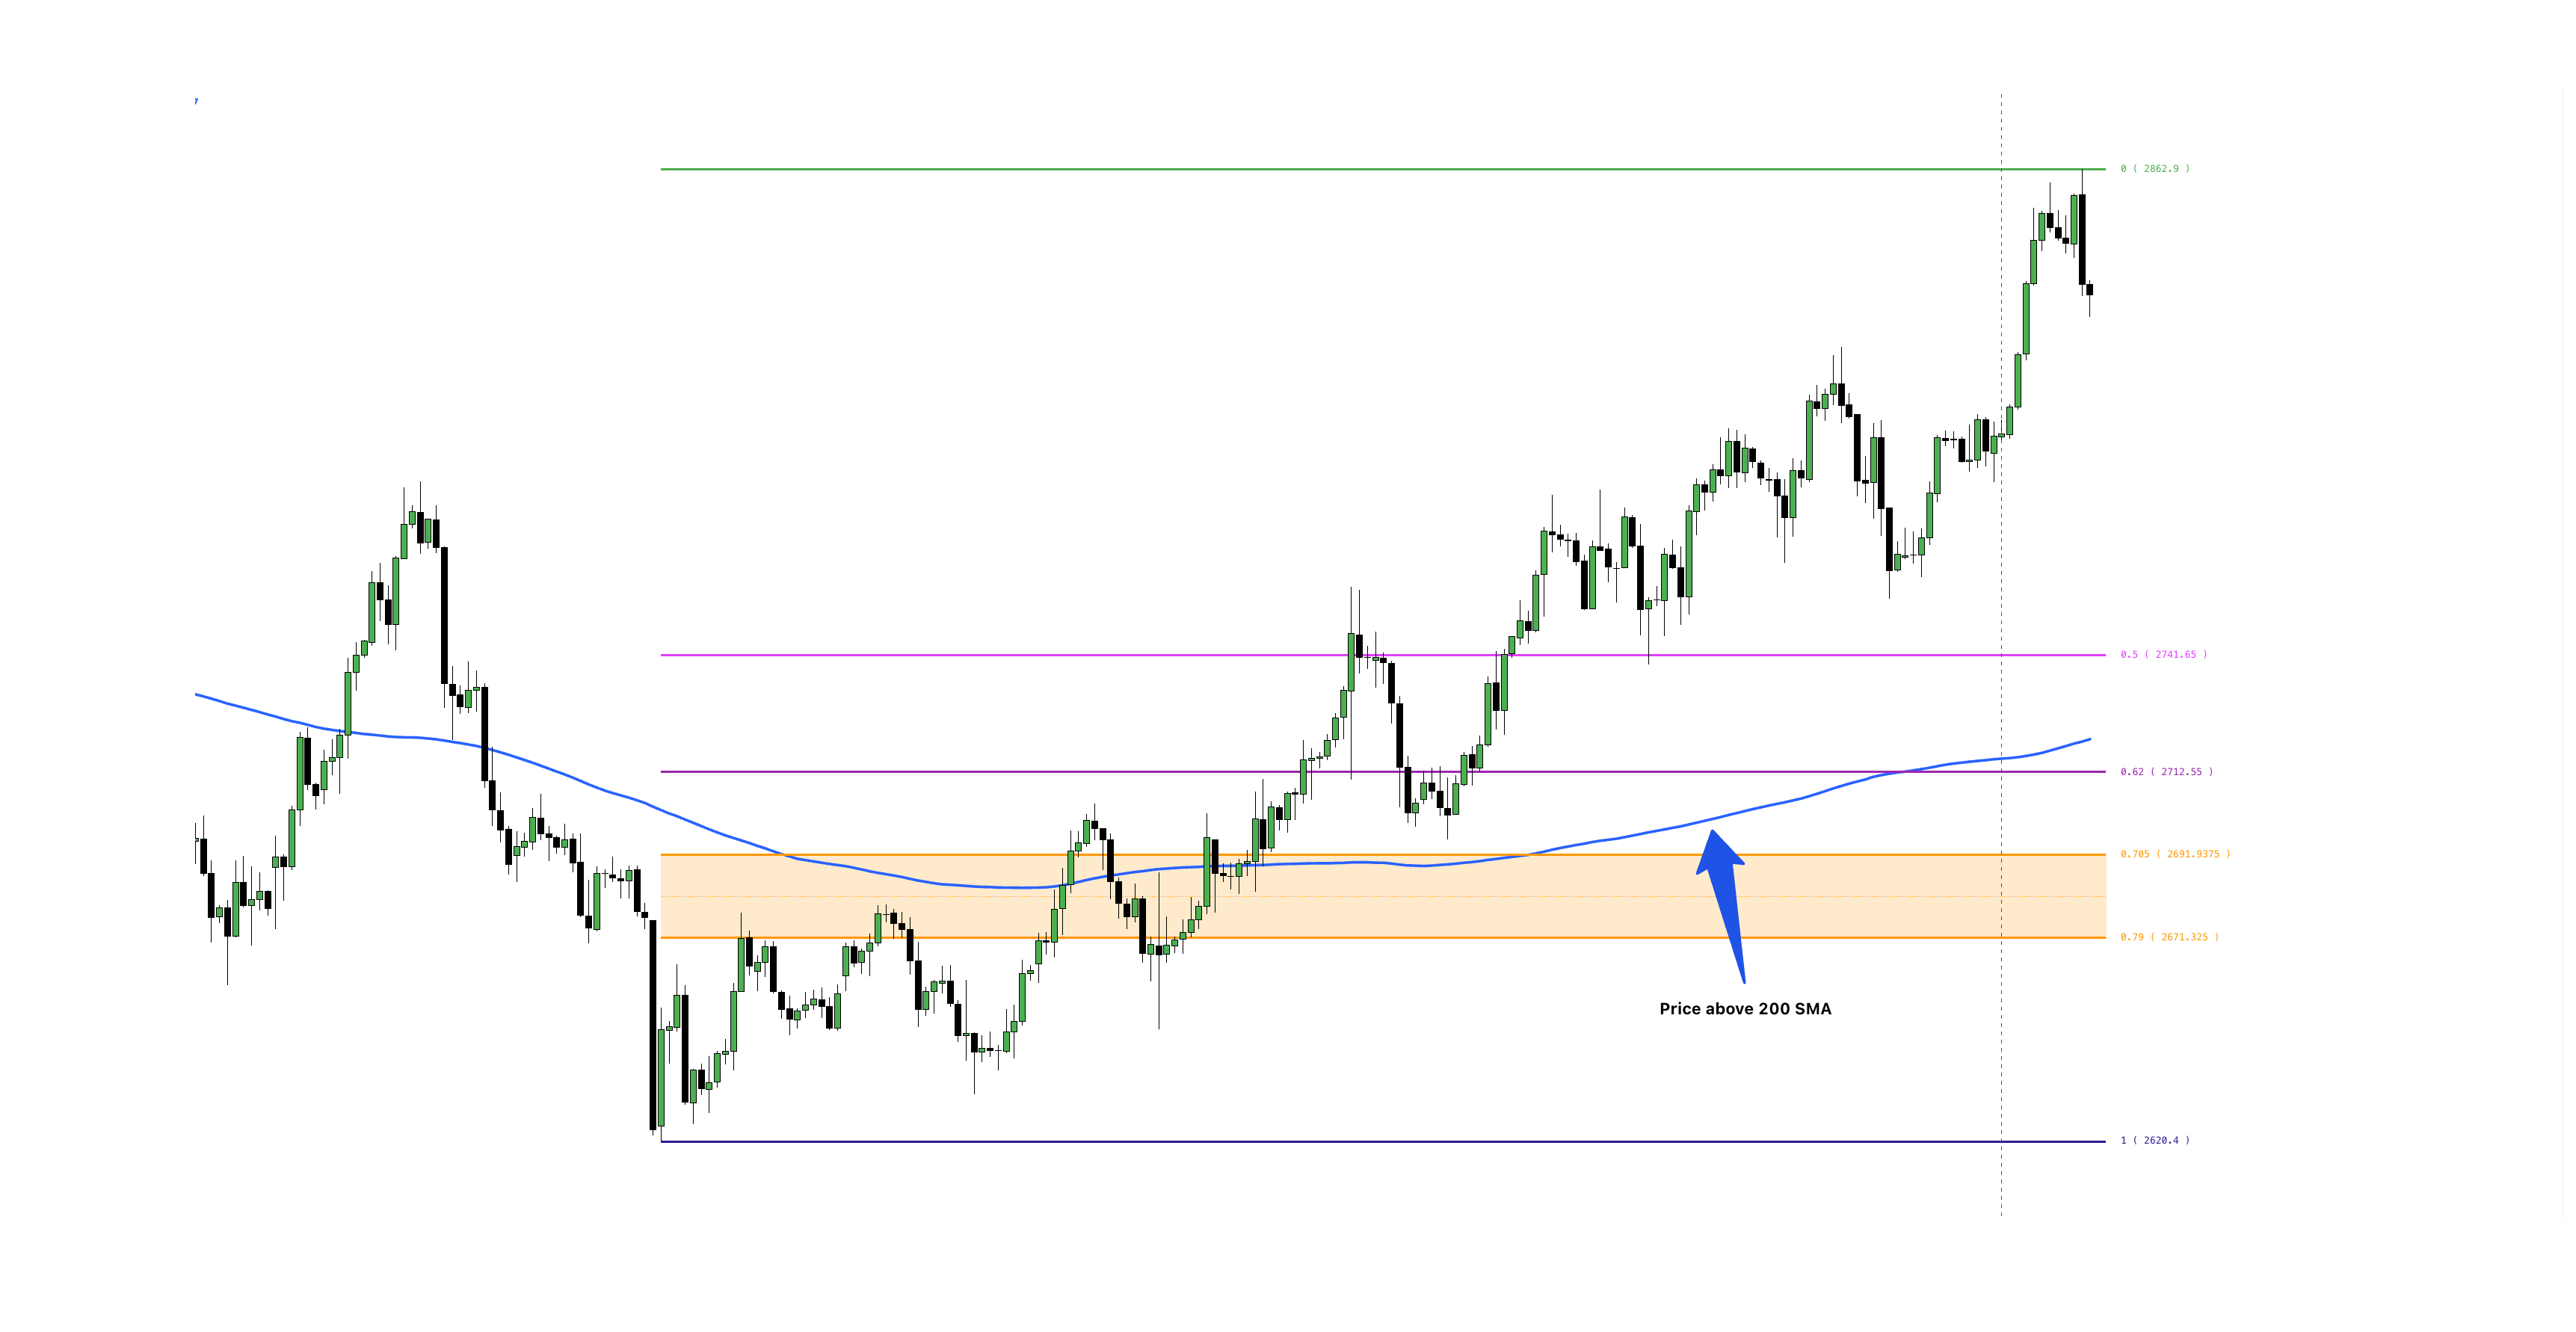
Trendlines & Moving Averages
Validate Fibonacci retracement levels by ensuring they align with major trendline support or key moving averages (such as the 50 SMA or 200 EMA).
Fibonacci with Trendlines and Moving Averages
Volume Analysis
Analyze volume behavior as price approaches a Fibonacci level. Decreasing volume on the pullback into support followed by a volume spike confirms strong institutional buying interest.
Fibonacci with Volume Analysis
ICT Strategies & Institutional Liquidity Tools
Elevate your precision by pairing Fibonacci OTE zones with institutional order flow tools:
- Fair Value Gaps (FVG) & Inversion FVGs: Look for market imbalance gaps residing inside the OTE zone.
- Order Blocks & Breaker Blocks: Enter when a high-timeframe order block overlaps directly with the 0.618 or 0.705 Fibonacci ratio.
Fibonacci with ICT Concepts
6. Practical Applications of Fibonacci
- Scalping (1m - 5m timeframes): Utilize micro-retracements into the Golden Pocket for high-frequency entries with tight risk controls.
- Swing Trading (1h - 4h timeframes): Combine 61.8% retracements with market structure breaks for multi-day directional trends.
- Position Trading / Long-Term Investing (Daily / Weekly timeframes): Map macro Fibonacci cycles on index charts or major crypto assets to pinpoint generational market bottoms and cycle tops.
7. Key Takeaways
- Precision timing: Fibonacci levels offer objective, non-arbitrary support and resistance target zones.
- Statistical advantage: Focus on high-probability zones like the Golden Pocket (0.618–0.65) and ICT OTE (0.618–0.786) to maximize risk-to-reward ratios.
- Confluence is king: Combine Fibonacci ratios with candlestick patterns, volume confirmation, moving averages, and ICT liquidity concepts (FVGs & Order Blocks).
- Risk management: Always define risk outside structural swing highs/lows to protect capital against unexpected volatility spikes.