
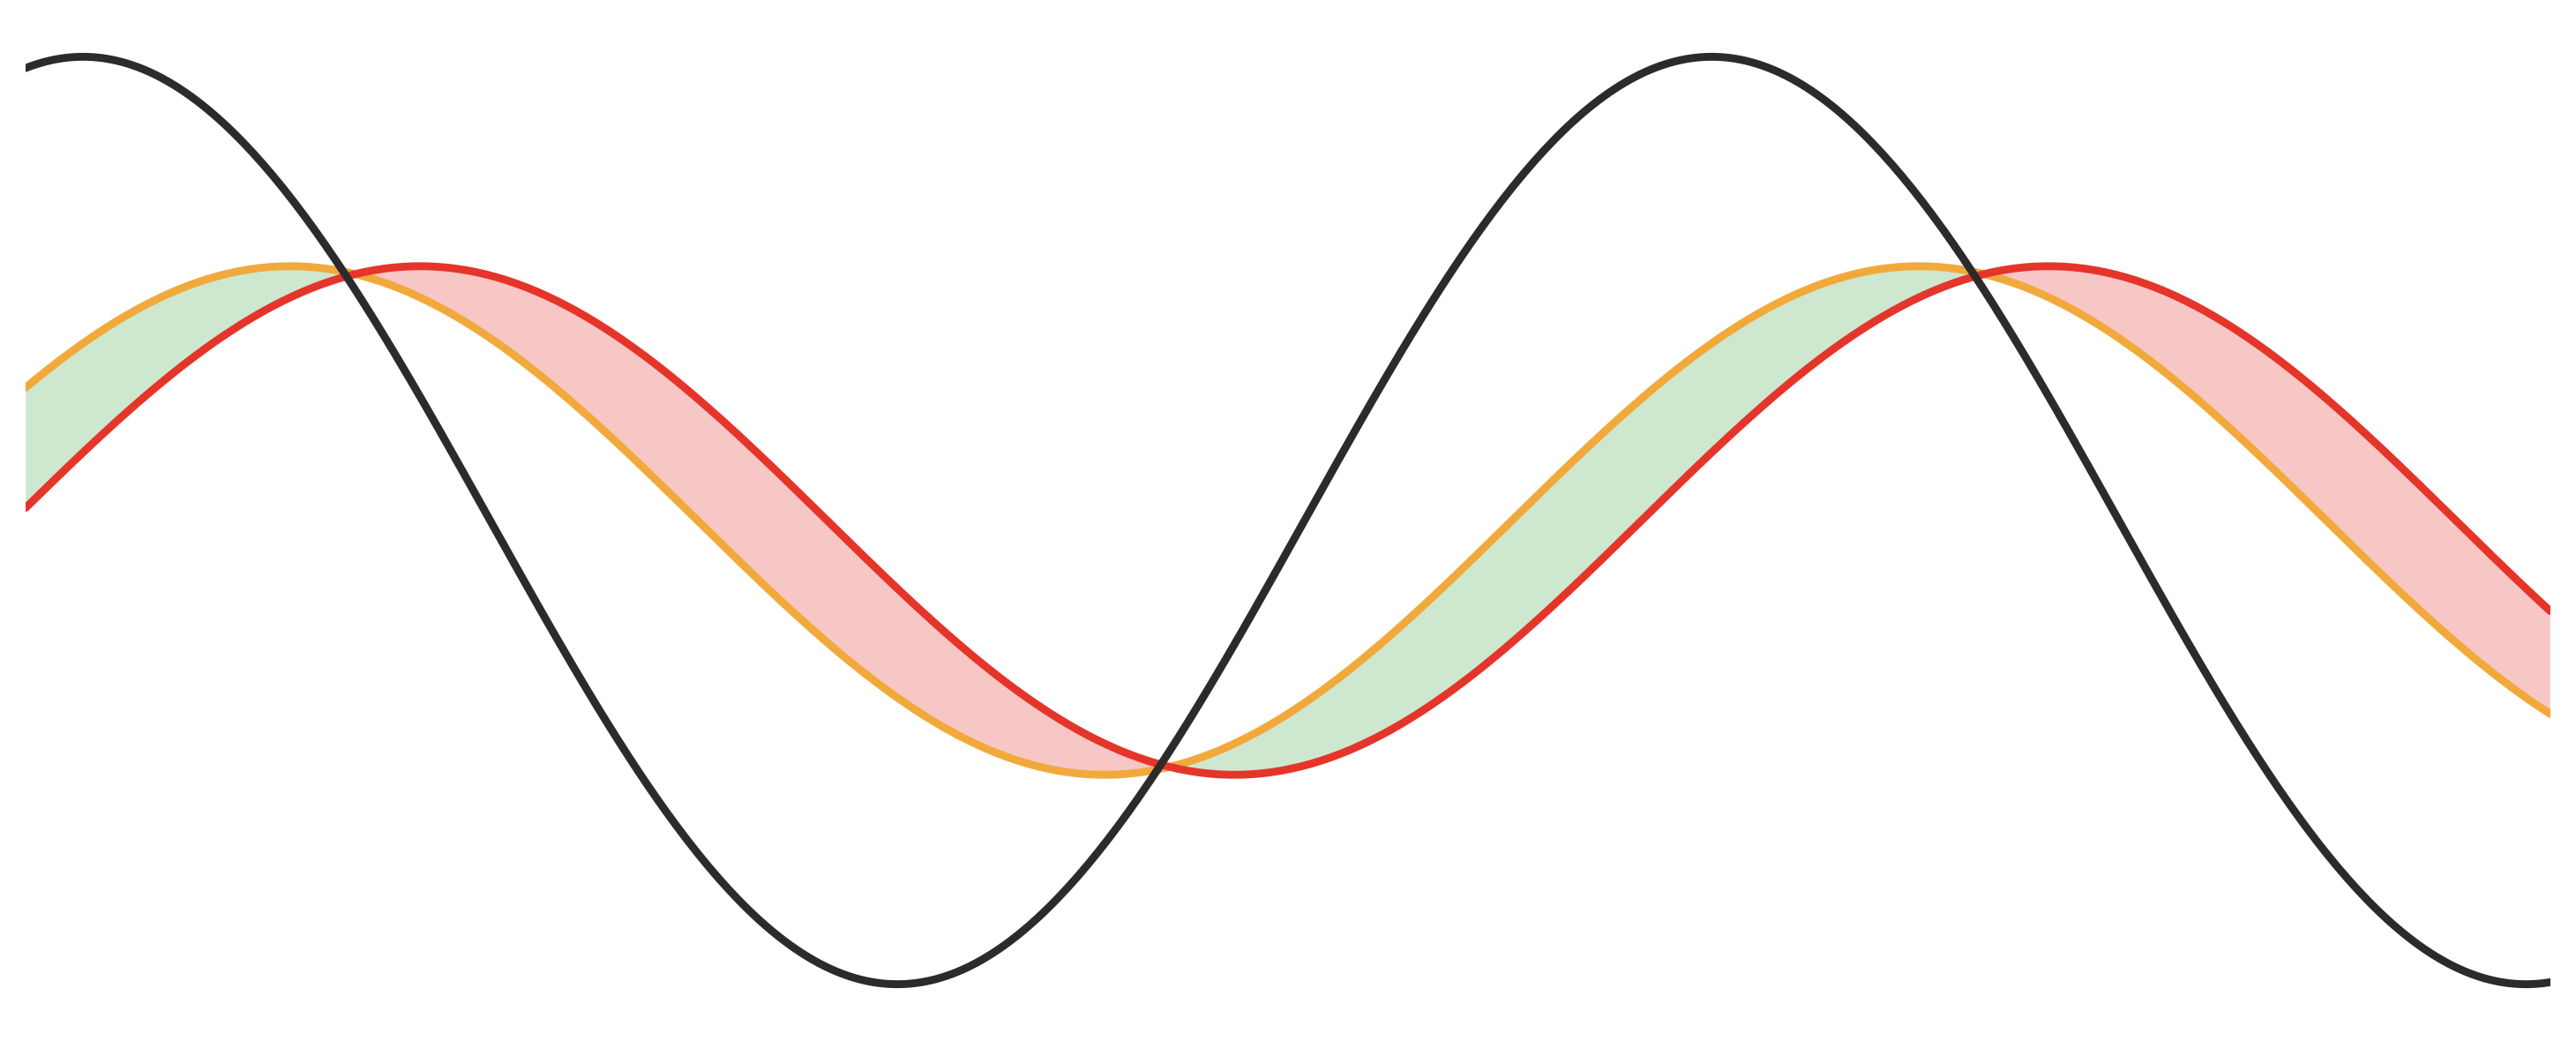
Gain an instant, panoramic read on market equilibrium, trend direction, dynamic support/resistance, and forward momentum with Ichimoku Kinko Hyo. Meaning “one-glance equilibrium chart,” the Ichimoku Cloud is a comprehensive charting framework that combines multiple layers of technical analysis into a single, cohesive visual template. Rather than relying on lagging indicators that react only to past price action, Ichimoku projects future structural boundaries and equilibrium zones directly onto your charts.
1. What is the Ichimoku Cloud?
Developed to streamline decision-making without cluttering price charts, Ichimoku Kinko Hyo translates complex market dynamics into immediate visual signals:
- All-in-One Framework: Measures trend direction, momentum pace, and structural levels within a single indicator overlay.
- Forward-Looking Geometry: Projects future support and resistance zones 26 periods ahead via the Kumo (Cloud), allowing traders to plan trade scenarios proactively.
- Midpoint Equilibrium Logic: Uses 50% high-low midpoints rather than simple closing moving averages, capturing true market balance and structural swing points.
- Instant Visual Clarity: Color-coded spans and position relationships deliver high-signal context at a single glance.
2. History of Ichimoku Kinko Hyo
Goichi Hosoda, creator of Ichimoku Kinko Hyo
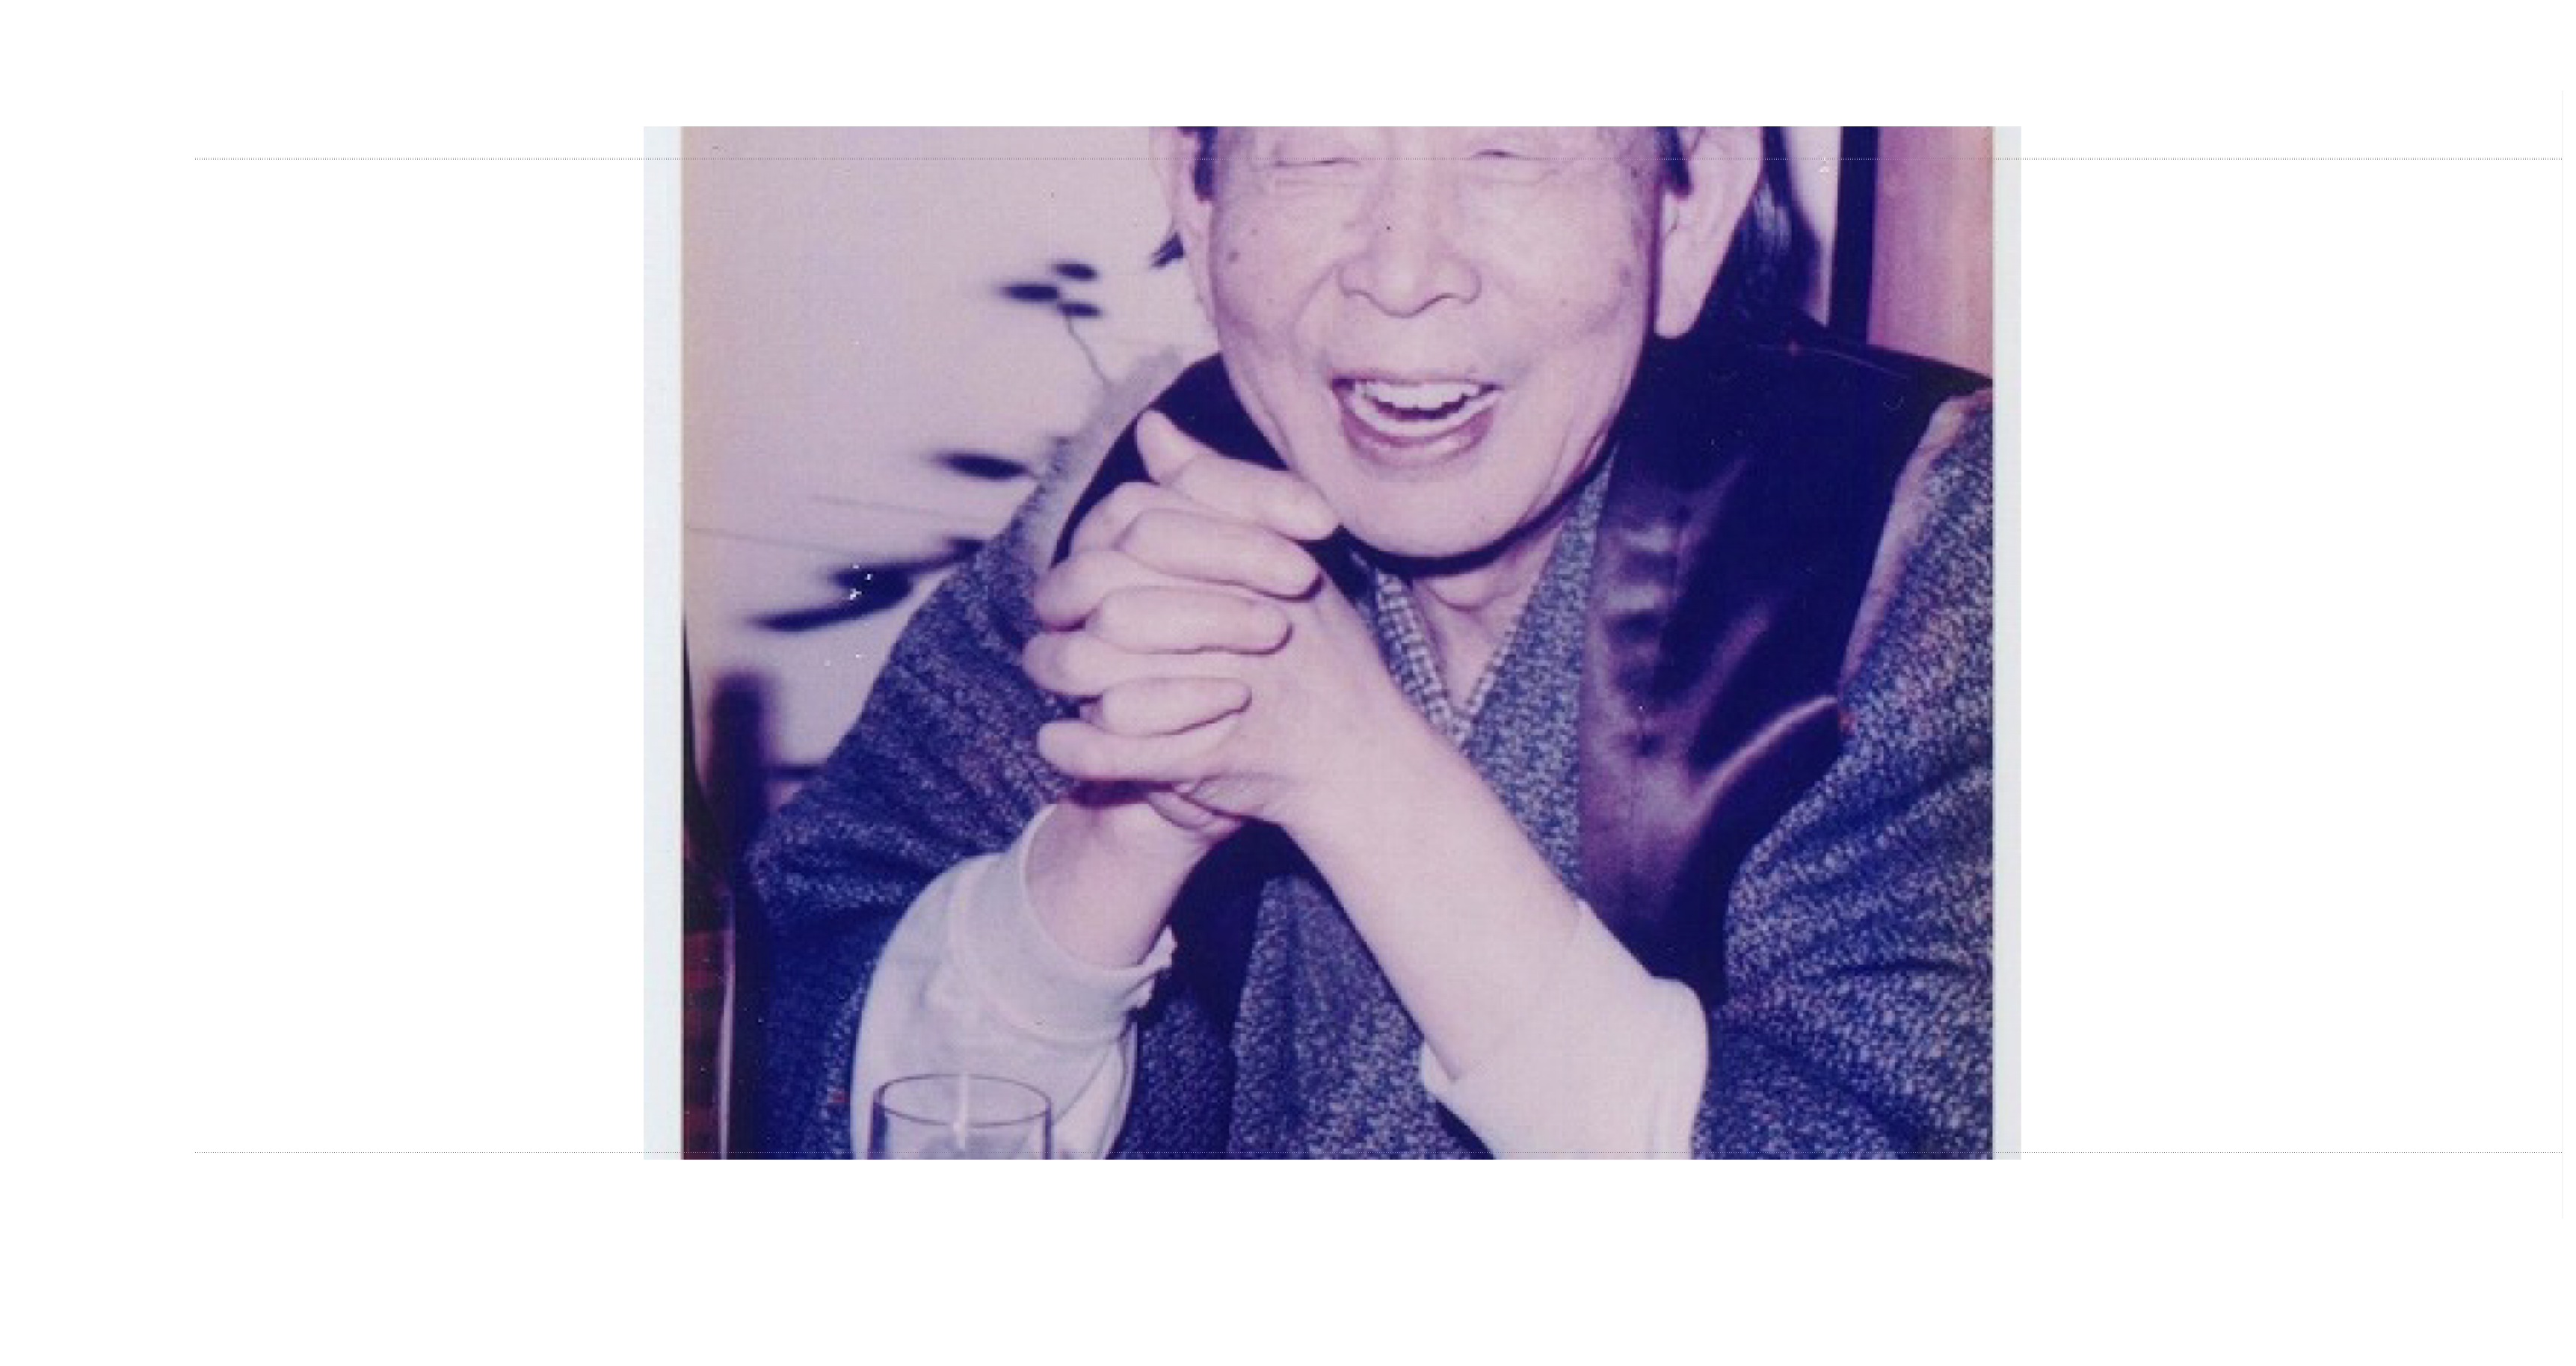
The Ichimoku system was created by Japanese journalist Goichi Hosoda, who published under the pen name Ichimoku Sanjin. Between the 1930s and 1960s, Hosoda and a dedicated team of student assistants spent over three decades performing hand-drawn mathematical calculations to discover the optimal time and price relationships governing financial markets.
The standard settings—9, 26, and 52—originated from the historical Japanese trading week (which operated six days a week, making 26 periods represent a full trading month and 52 periods representing two months). These specific intervals establish a balanced short-, medium-, and long-term rhythm that maintains internal geometry across equities, futures, forex, and crypto markets alike.
3. Benefits of the Ichimoku System
- Integrated Trend & Momentum Analysis: Clear visual rules define market health. A rising Cloud with Senkou Span A above Span B confirms a healthy bullish trend, while the distance and angle between the Tenkan-sen and Kijun-sen reflect trend acceleration.
- Structural Memory & Equilibrium Magnets: Flat Kijun-sen and flat Senkou Span B lines act as strong price magnets, pinpointing exact mean-reversion targets and key retest zones.
- Built-in Volatility & Risk Filtering: Kumo thickness visualizes market volatility and structural depth; thick clouds signal robust support/resistance buffers, while thin clouds highlight fragile zones prone to fast breakouts.
- Seamless Multi-Timeframe Alignment: Traders can set macro bias using a daily or weekly Kumo, then step down to intraday timeframes (1H, 15M) to trigger precise entries as Tenkan and Kijun realign.
4. The 5 Core Components
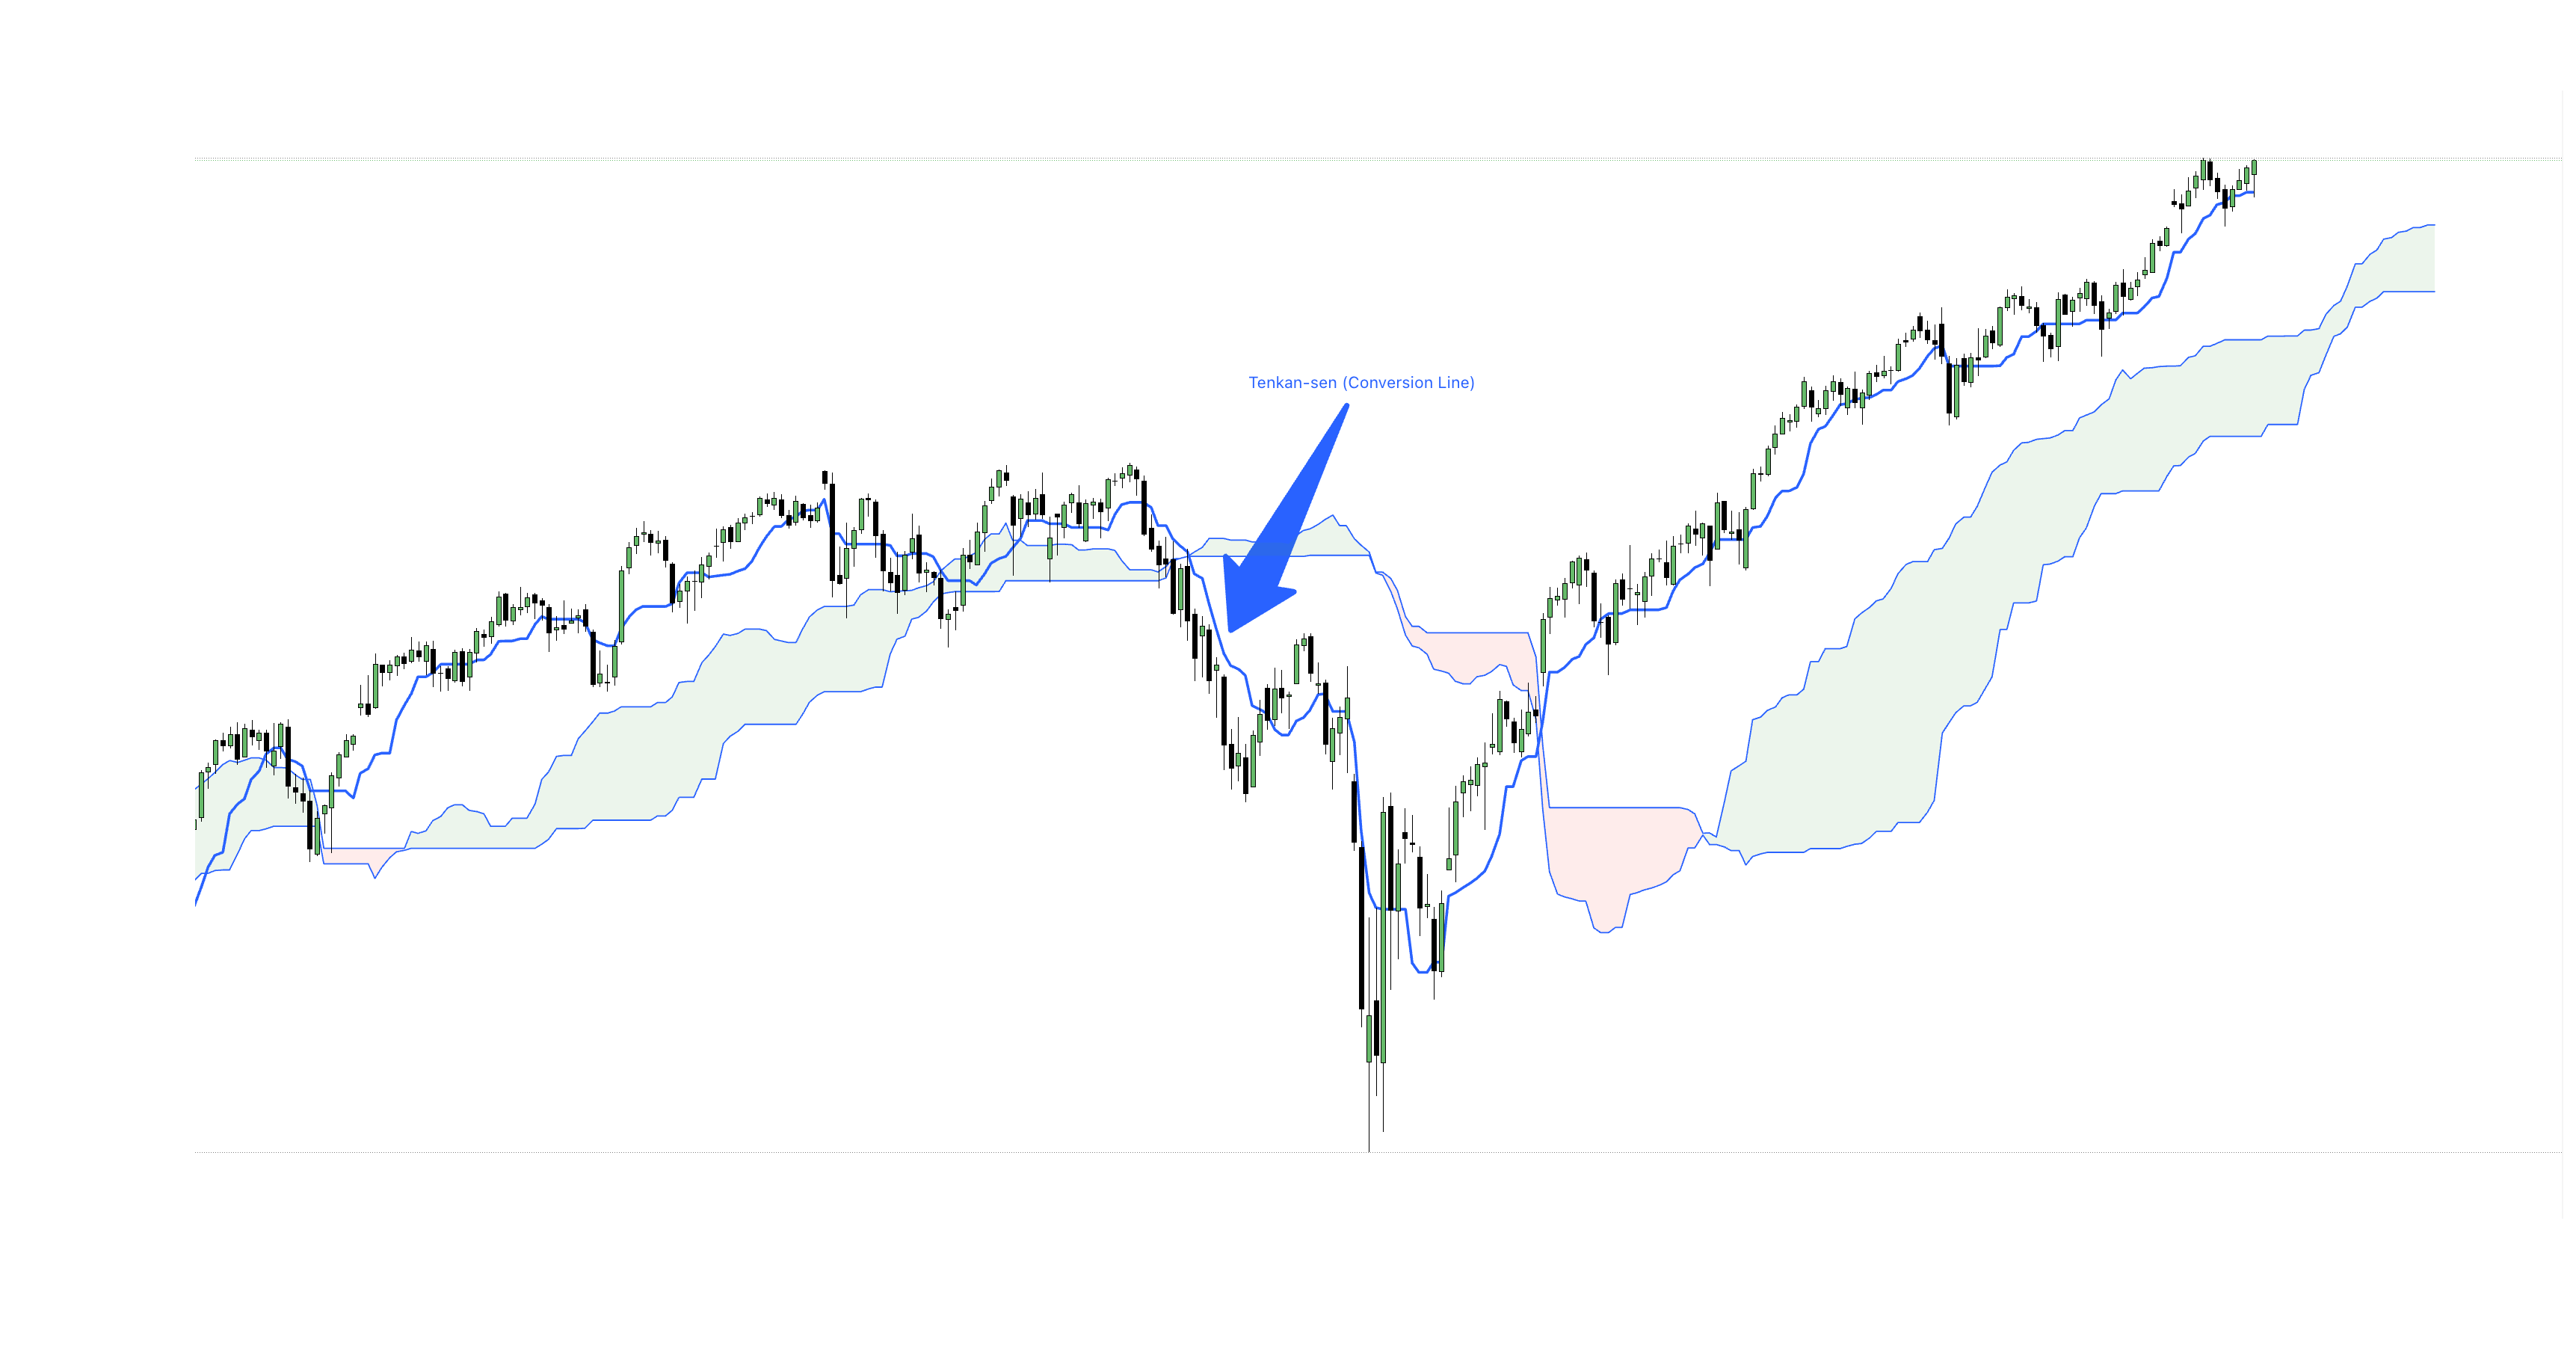
1. Tenkan-sen (Conversion Line)
The midpoint of the highest high and lowest low over the past 9 periods.
Tenkan = (Highest High(9) + Lowest Low(9)) / 2
In a strong trend, price breathes closely around the Tenkan-sen. A steeply angled Tenkan signals high momentum, while a flattening line indicates short-term market consolidation.
Tenkan-sen Conversion Line
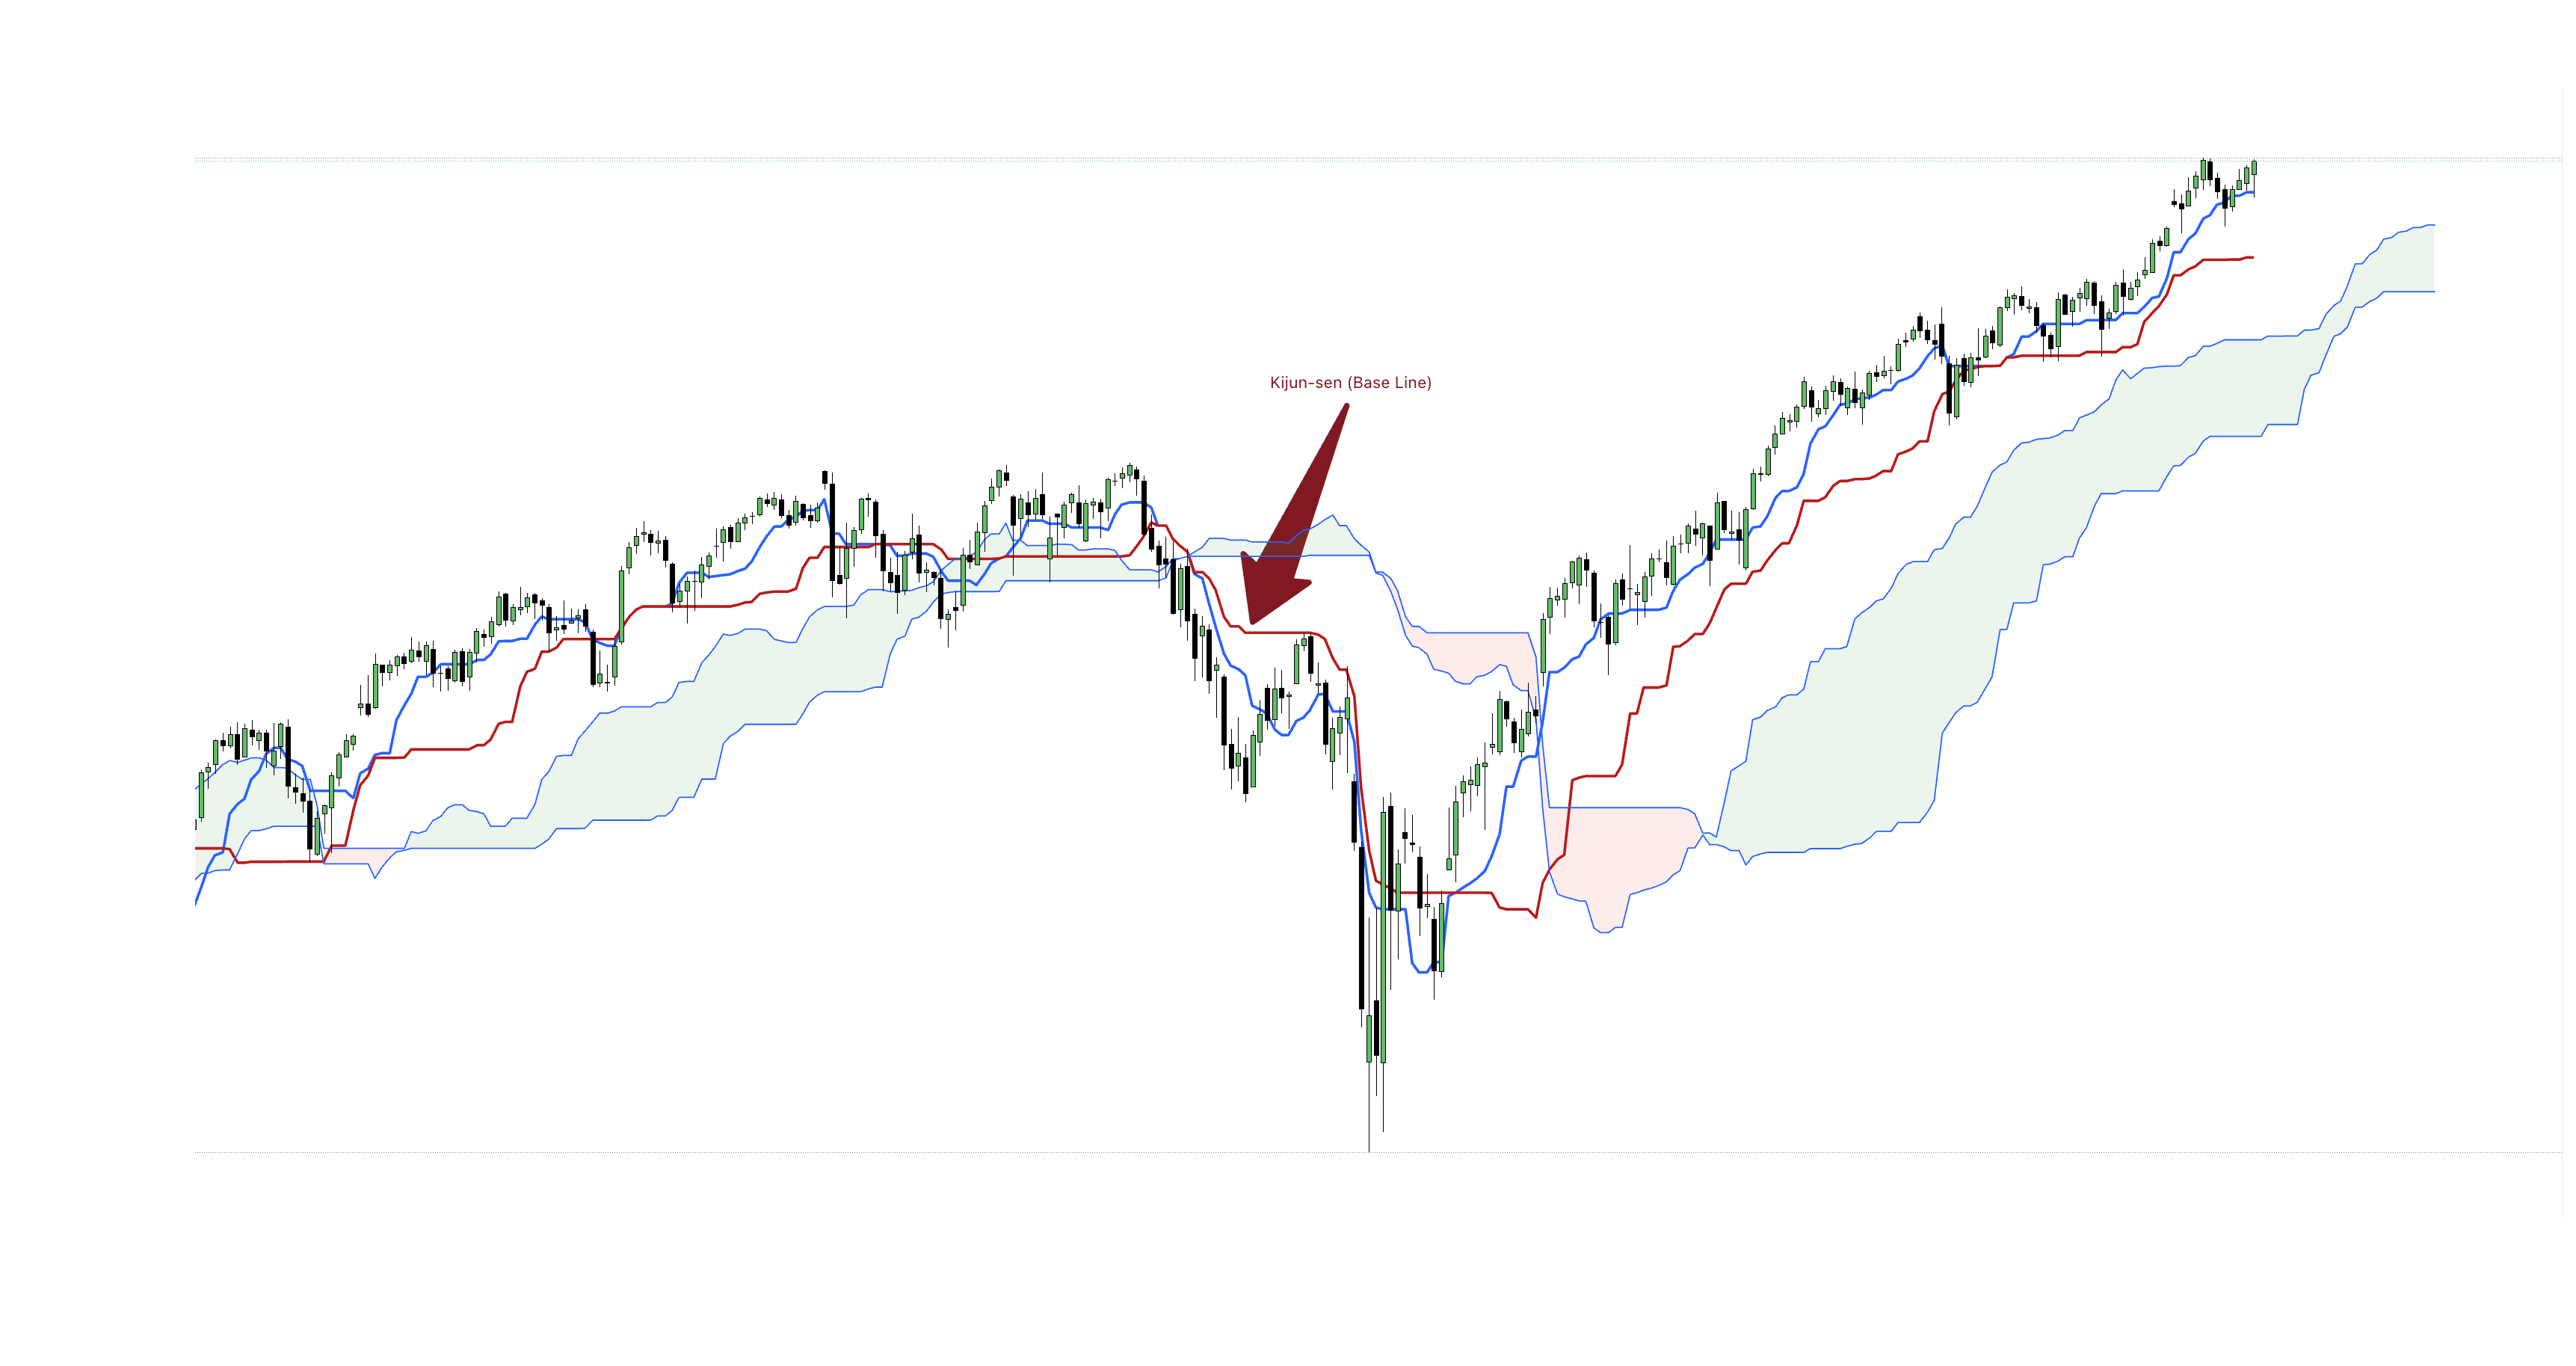
2. Kijun-sen (Base Line)
The midpoint of the highest high and lowest low over the past 26 periods.
Kijun = (Highest High(26) + Lowest Low(26)) / 2
Representing medium-term equilibrium, the Kijun-sen acts as both a trend filter and a trailing stop anchor. Price frequently returns to retest the Kijun-sen during healthy pullbacks.
Kijun-sen Base Line
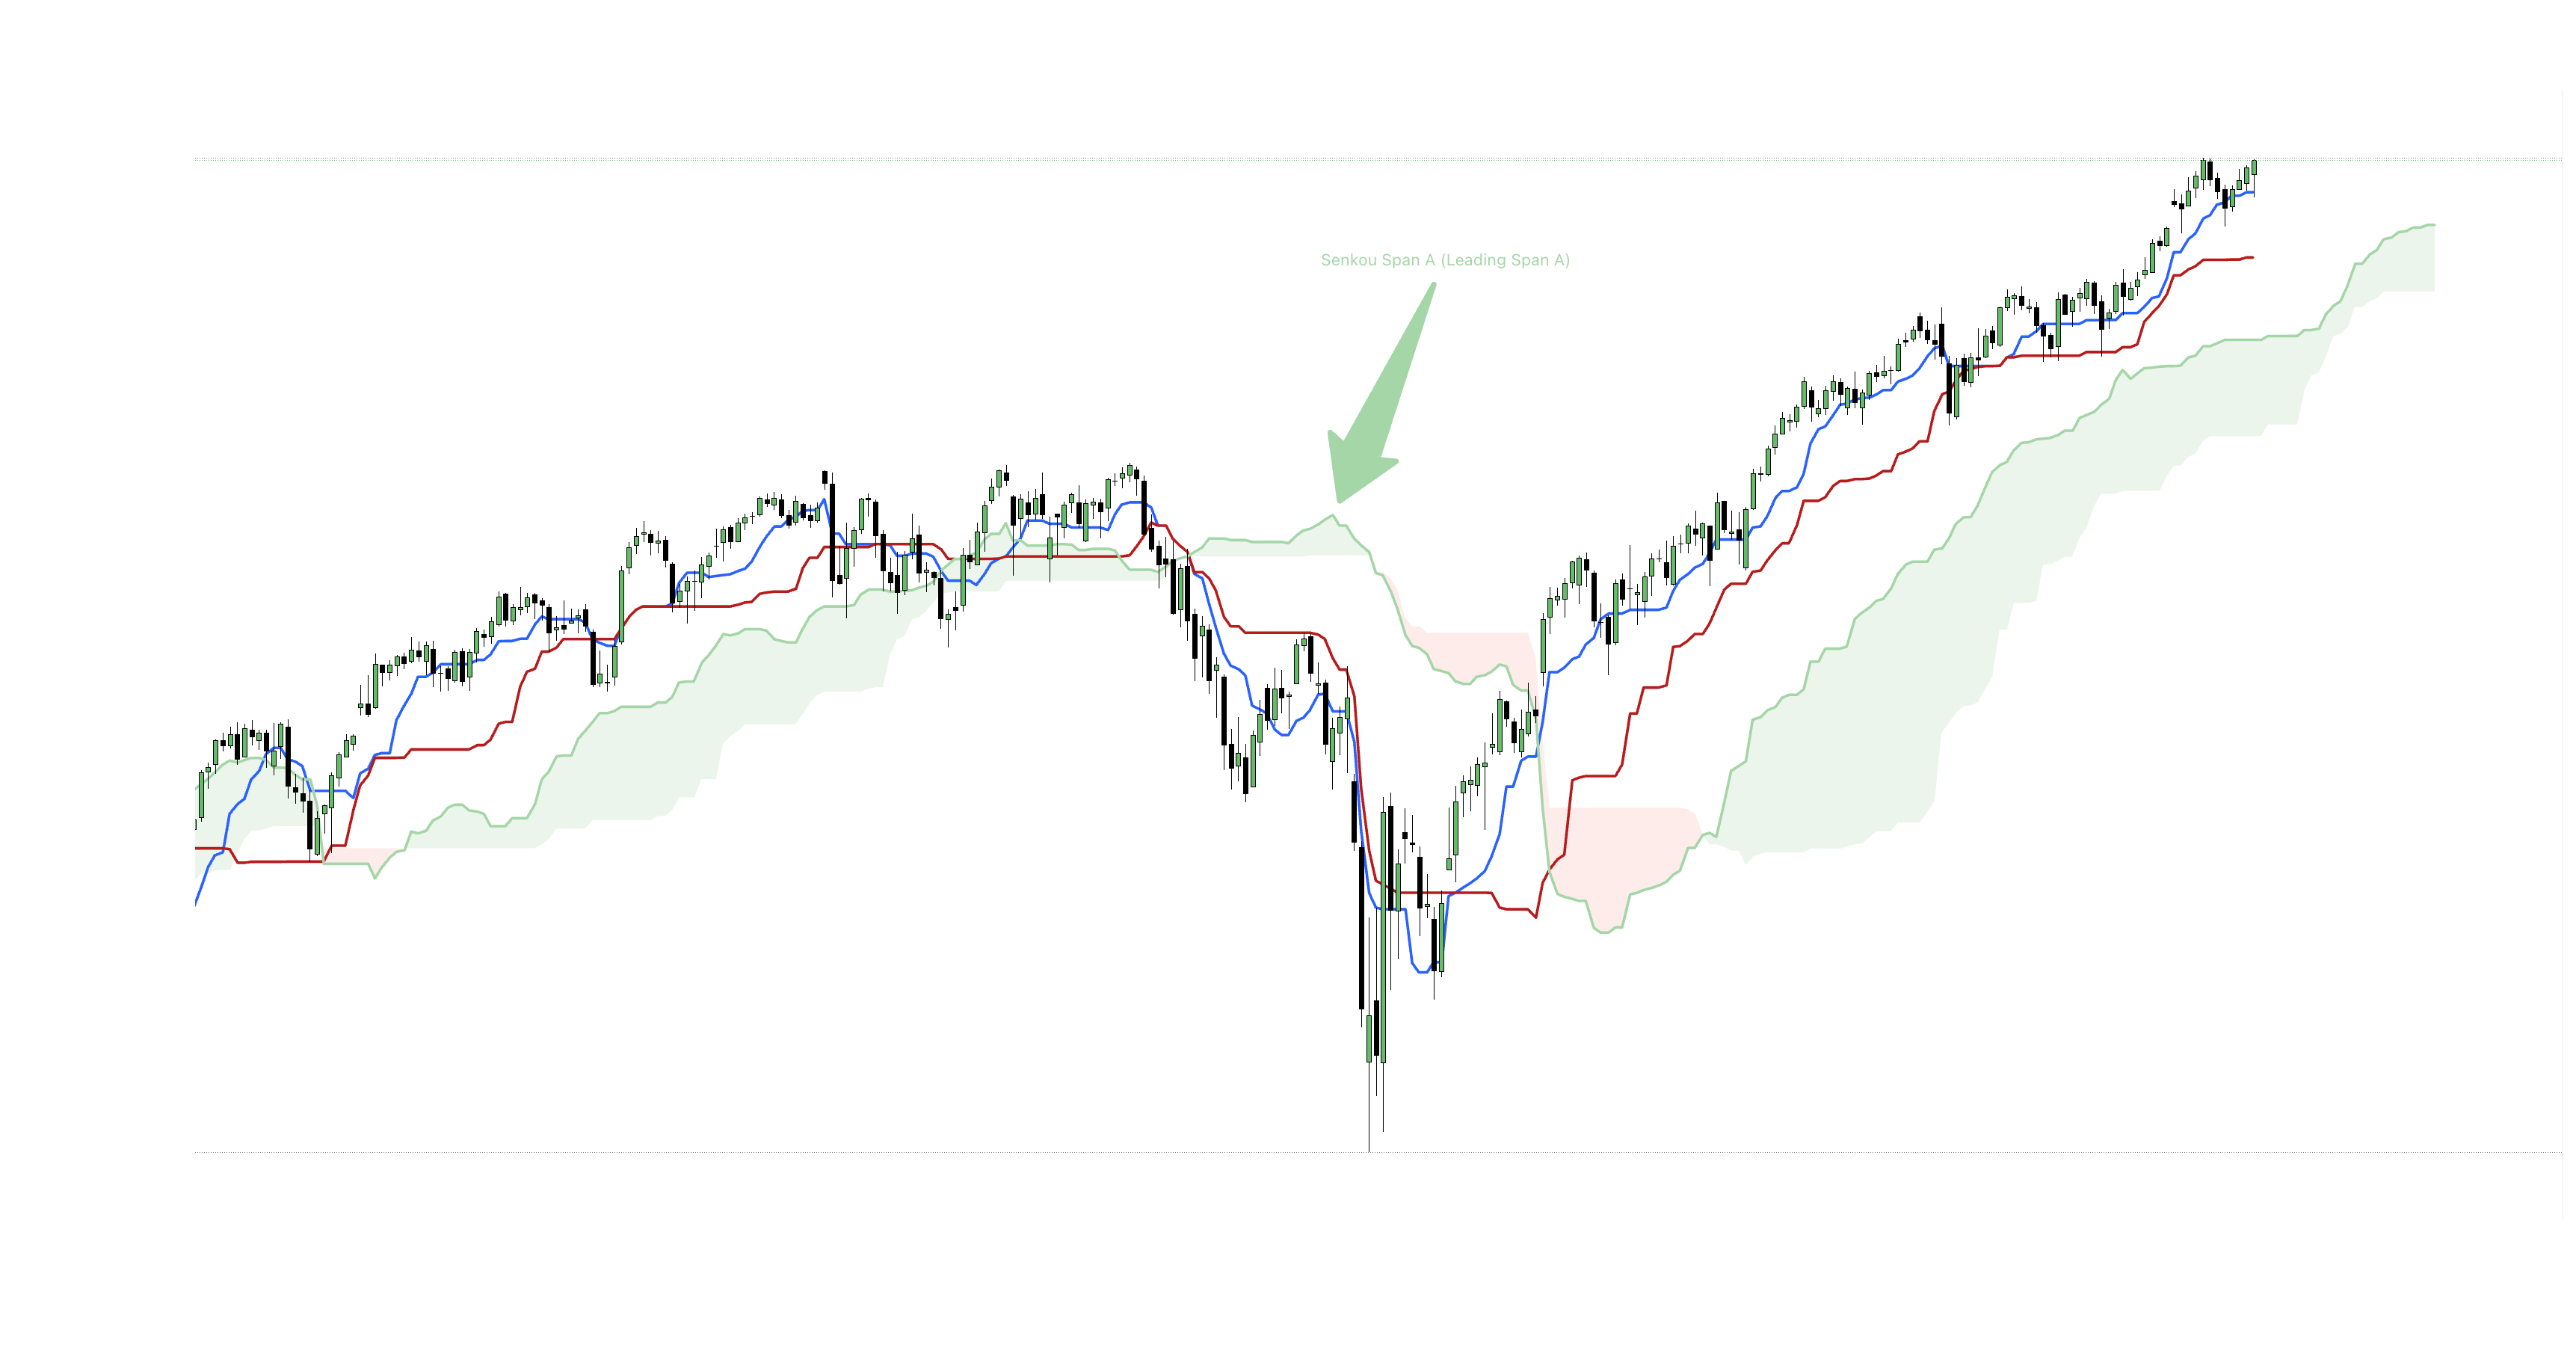
3. Senkou Span A (Leading Span A)
The average of the Tenkan-sen and Kijun-sen, plotted 26 periods forward.
Span A = (Tenkan + Kijun) / 2 → Shifted +26
Forms the faster, dynamic boundary of the Cloud, adjusting rapidly to recent momentum changes.
Senkou Span A Leading Span A
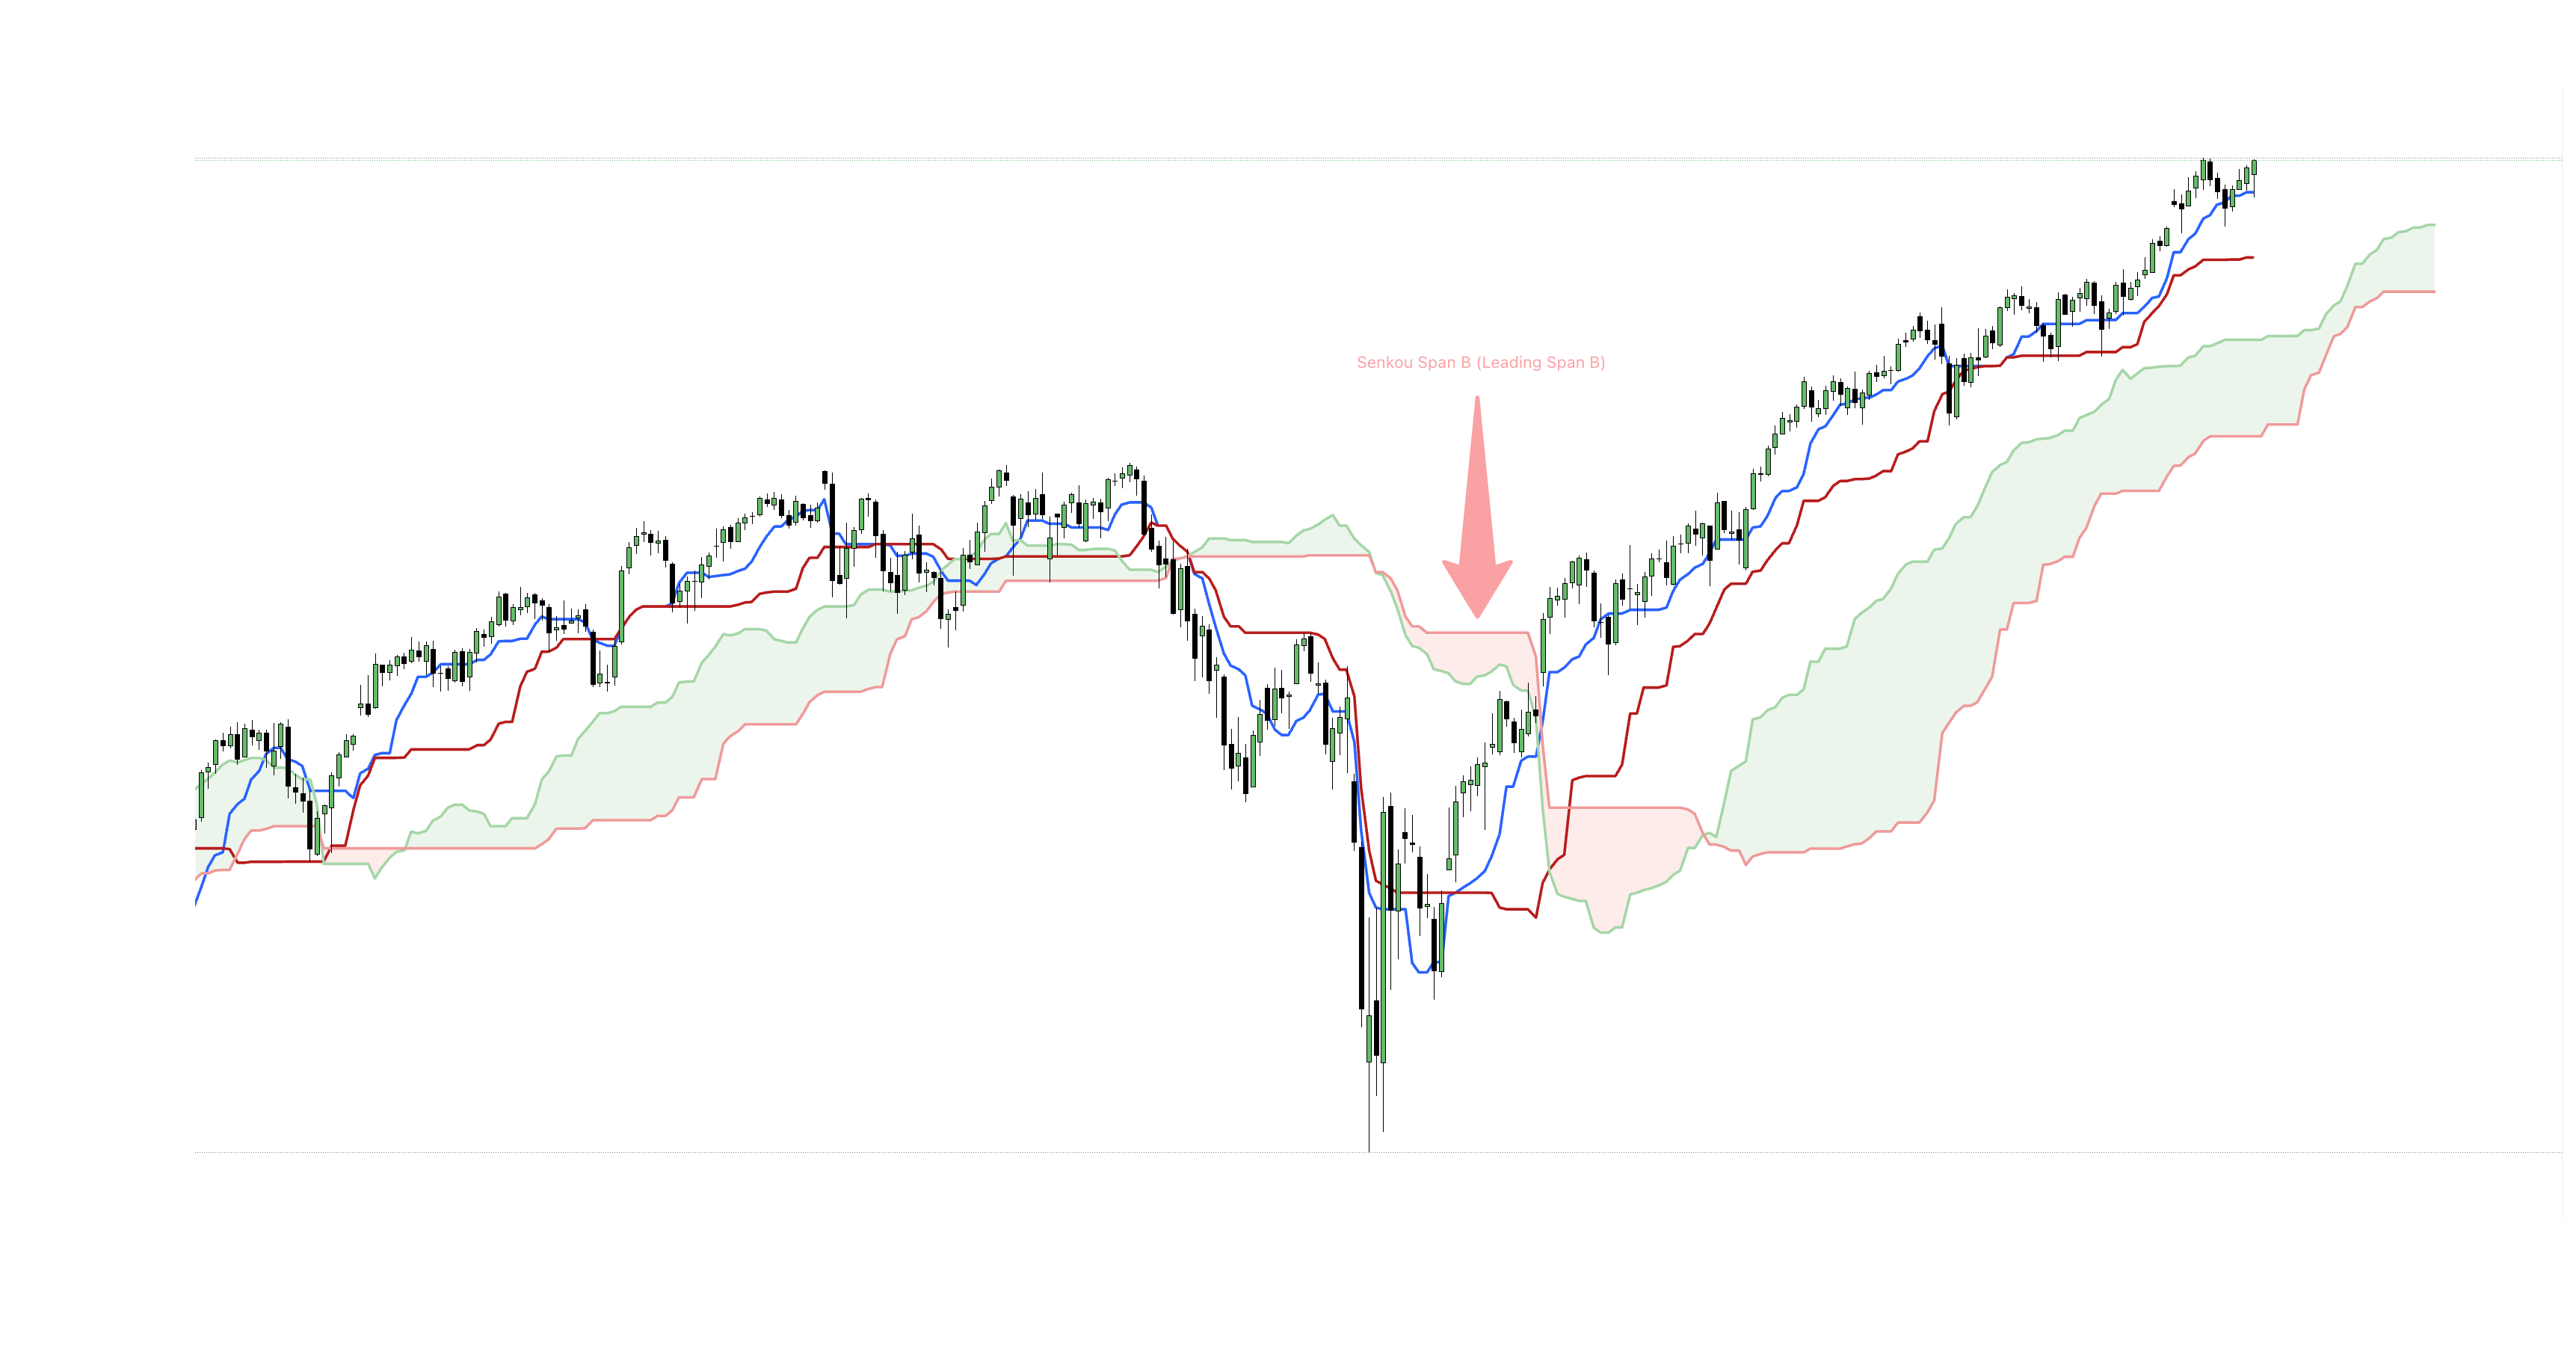
4. Senkou Span B (Leading Span B)
The midpoint of the highest high and lowest low over the past 52 periods, plotted 26 periods forward.
Span B = (Highest High(52) + Lowest Low(52)) / 2 → Shifted +26
Forms the slower, structural boundary of the Cloud. Horizontal flat sections on Span B mark major long-term support and resistance shelves.
Senkou Span B Leading Span B
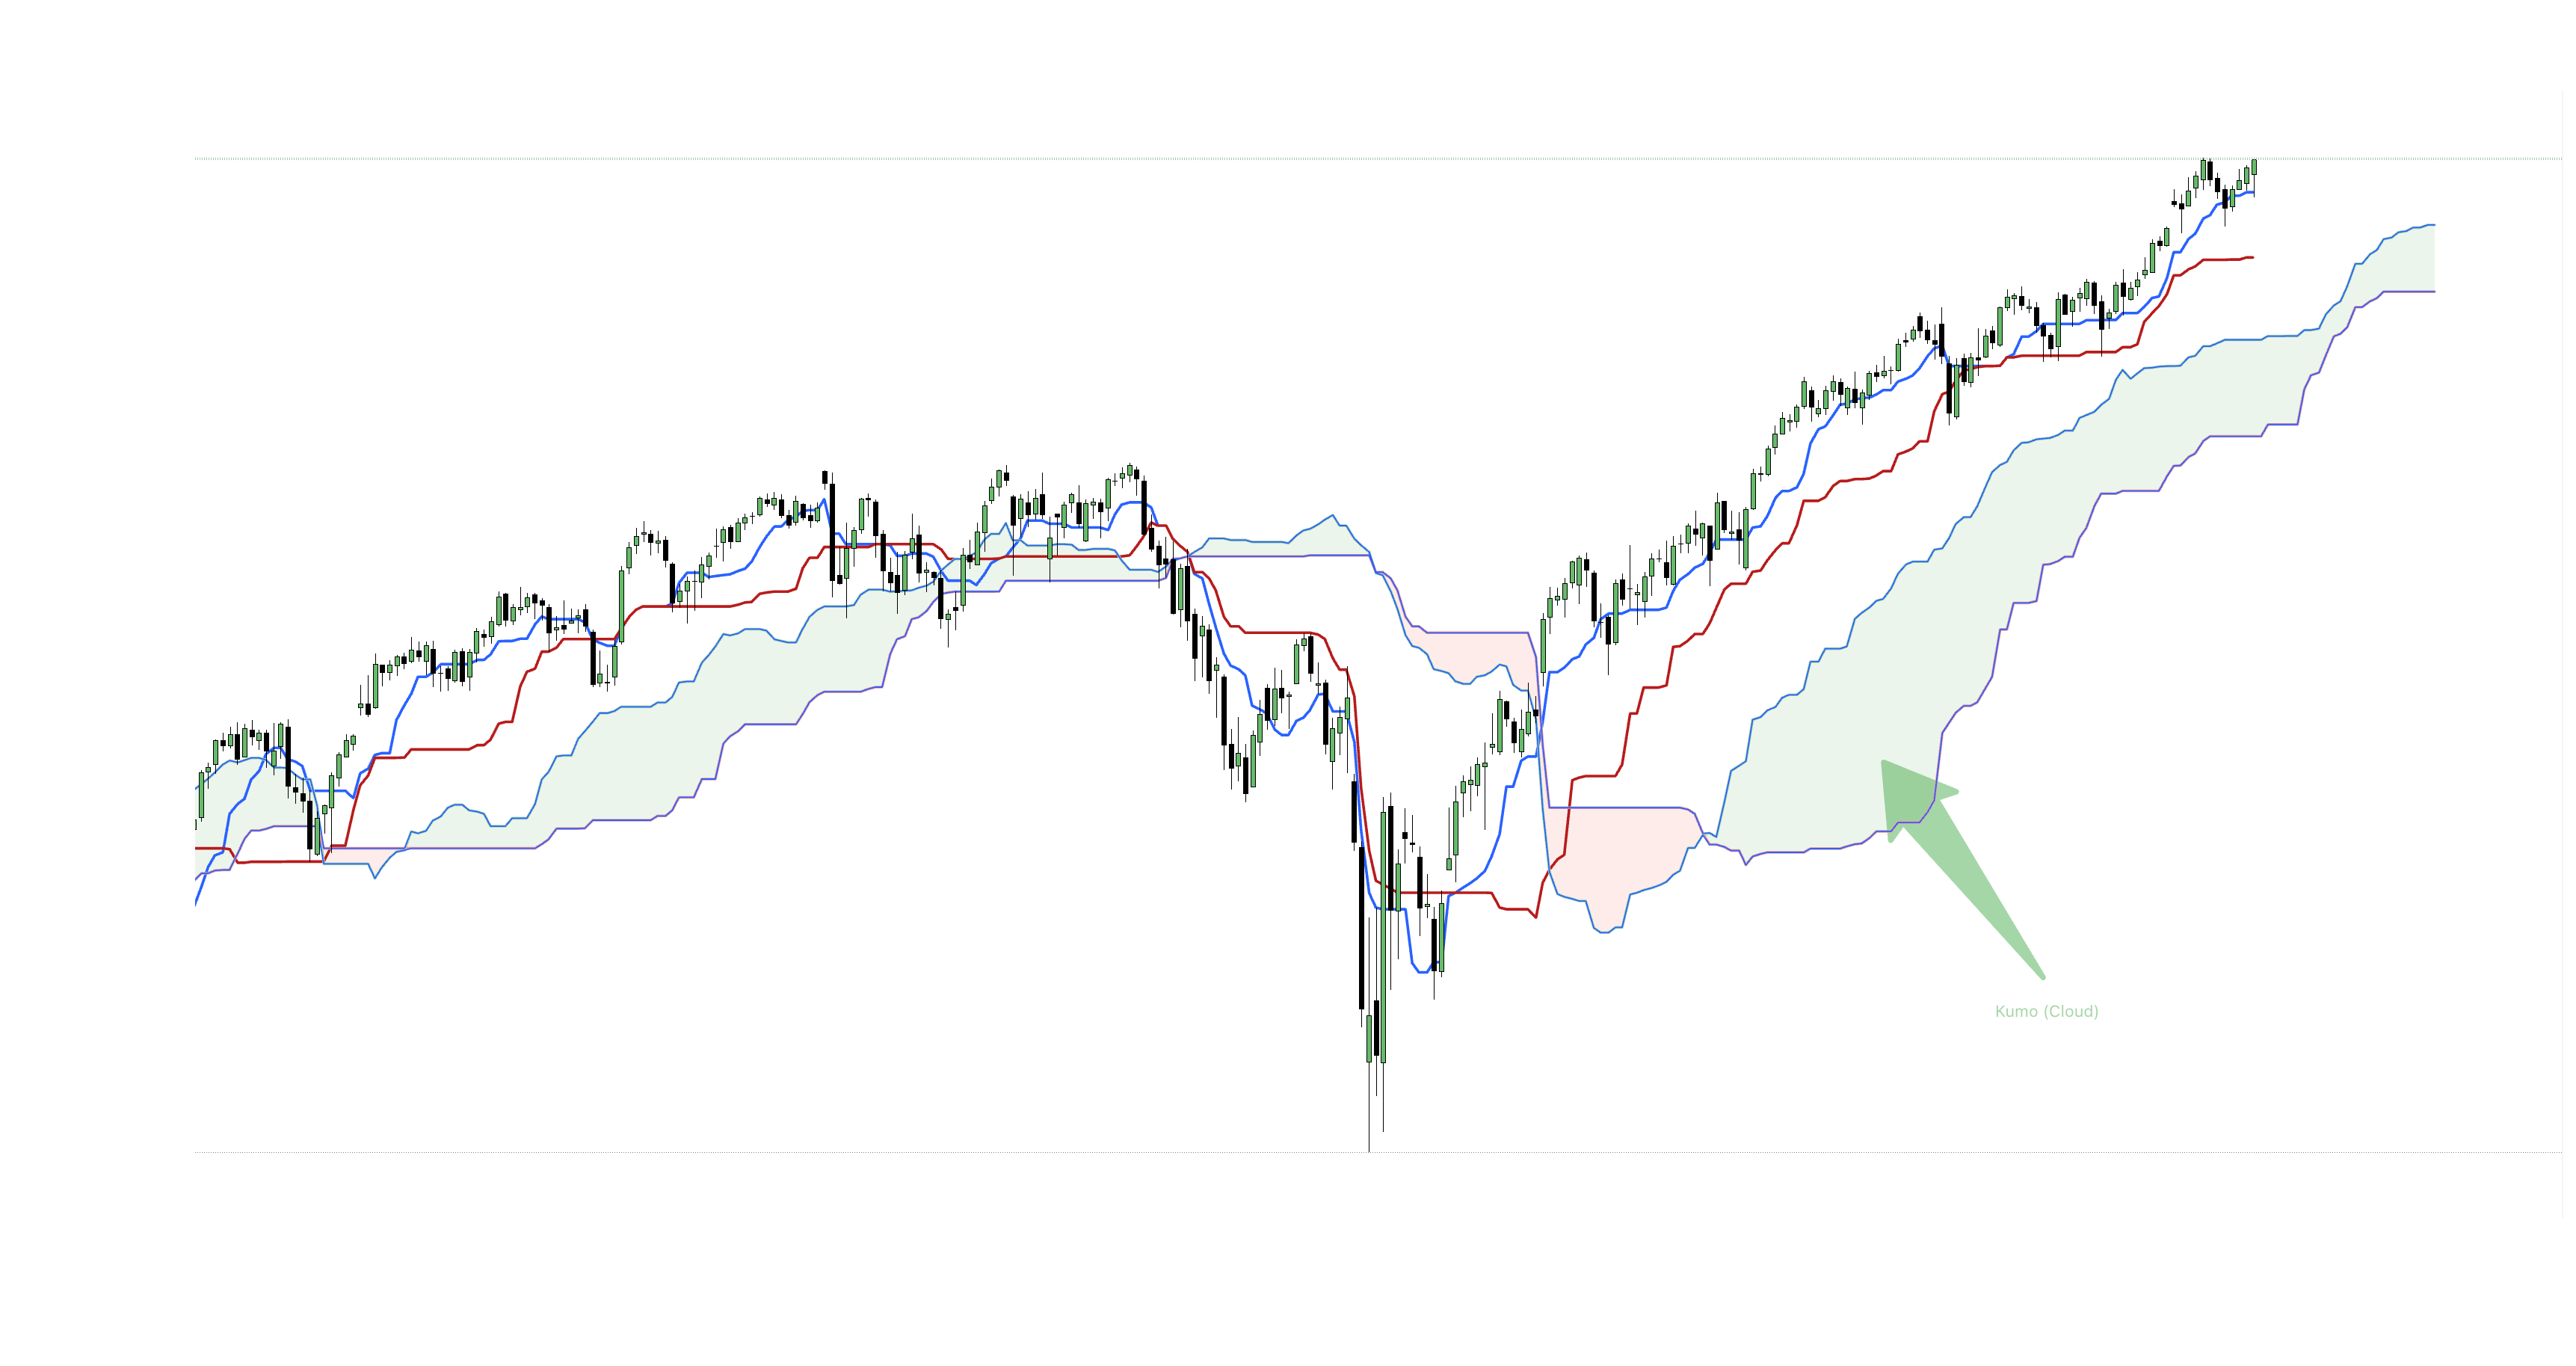
5. The Kumo (Cloud)
The shaded region bounded between Senkou Span A and Senkou Span B.
- Bullish Kumo: Span A is above Span B (typically shaded green).
- Bearish Kumo: Span B is above Span A (typically shaded red).
- Cloud Thickness: Indicates buffer strength and market volatility.
The Kumo Cloud
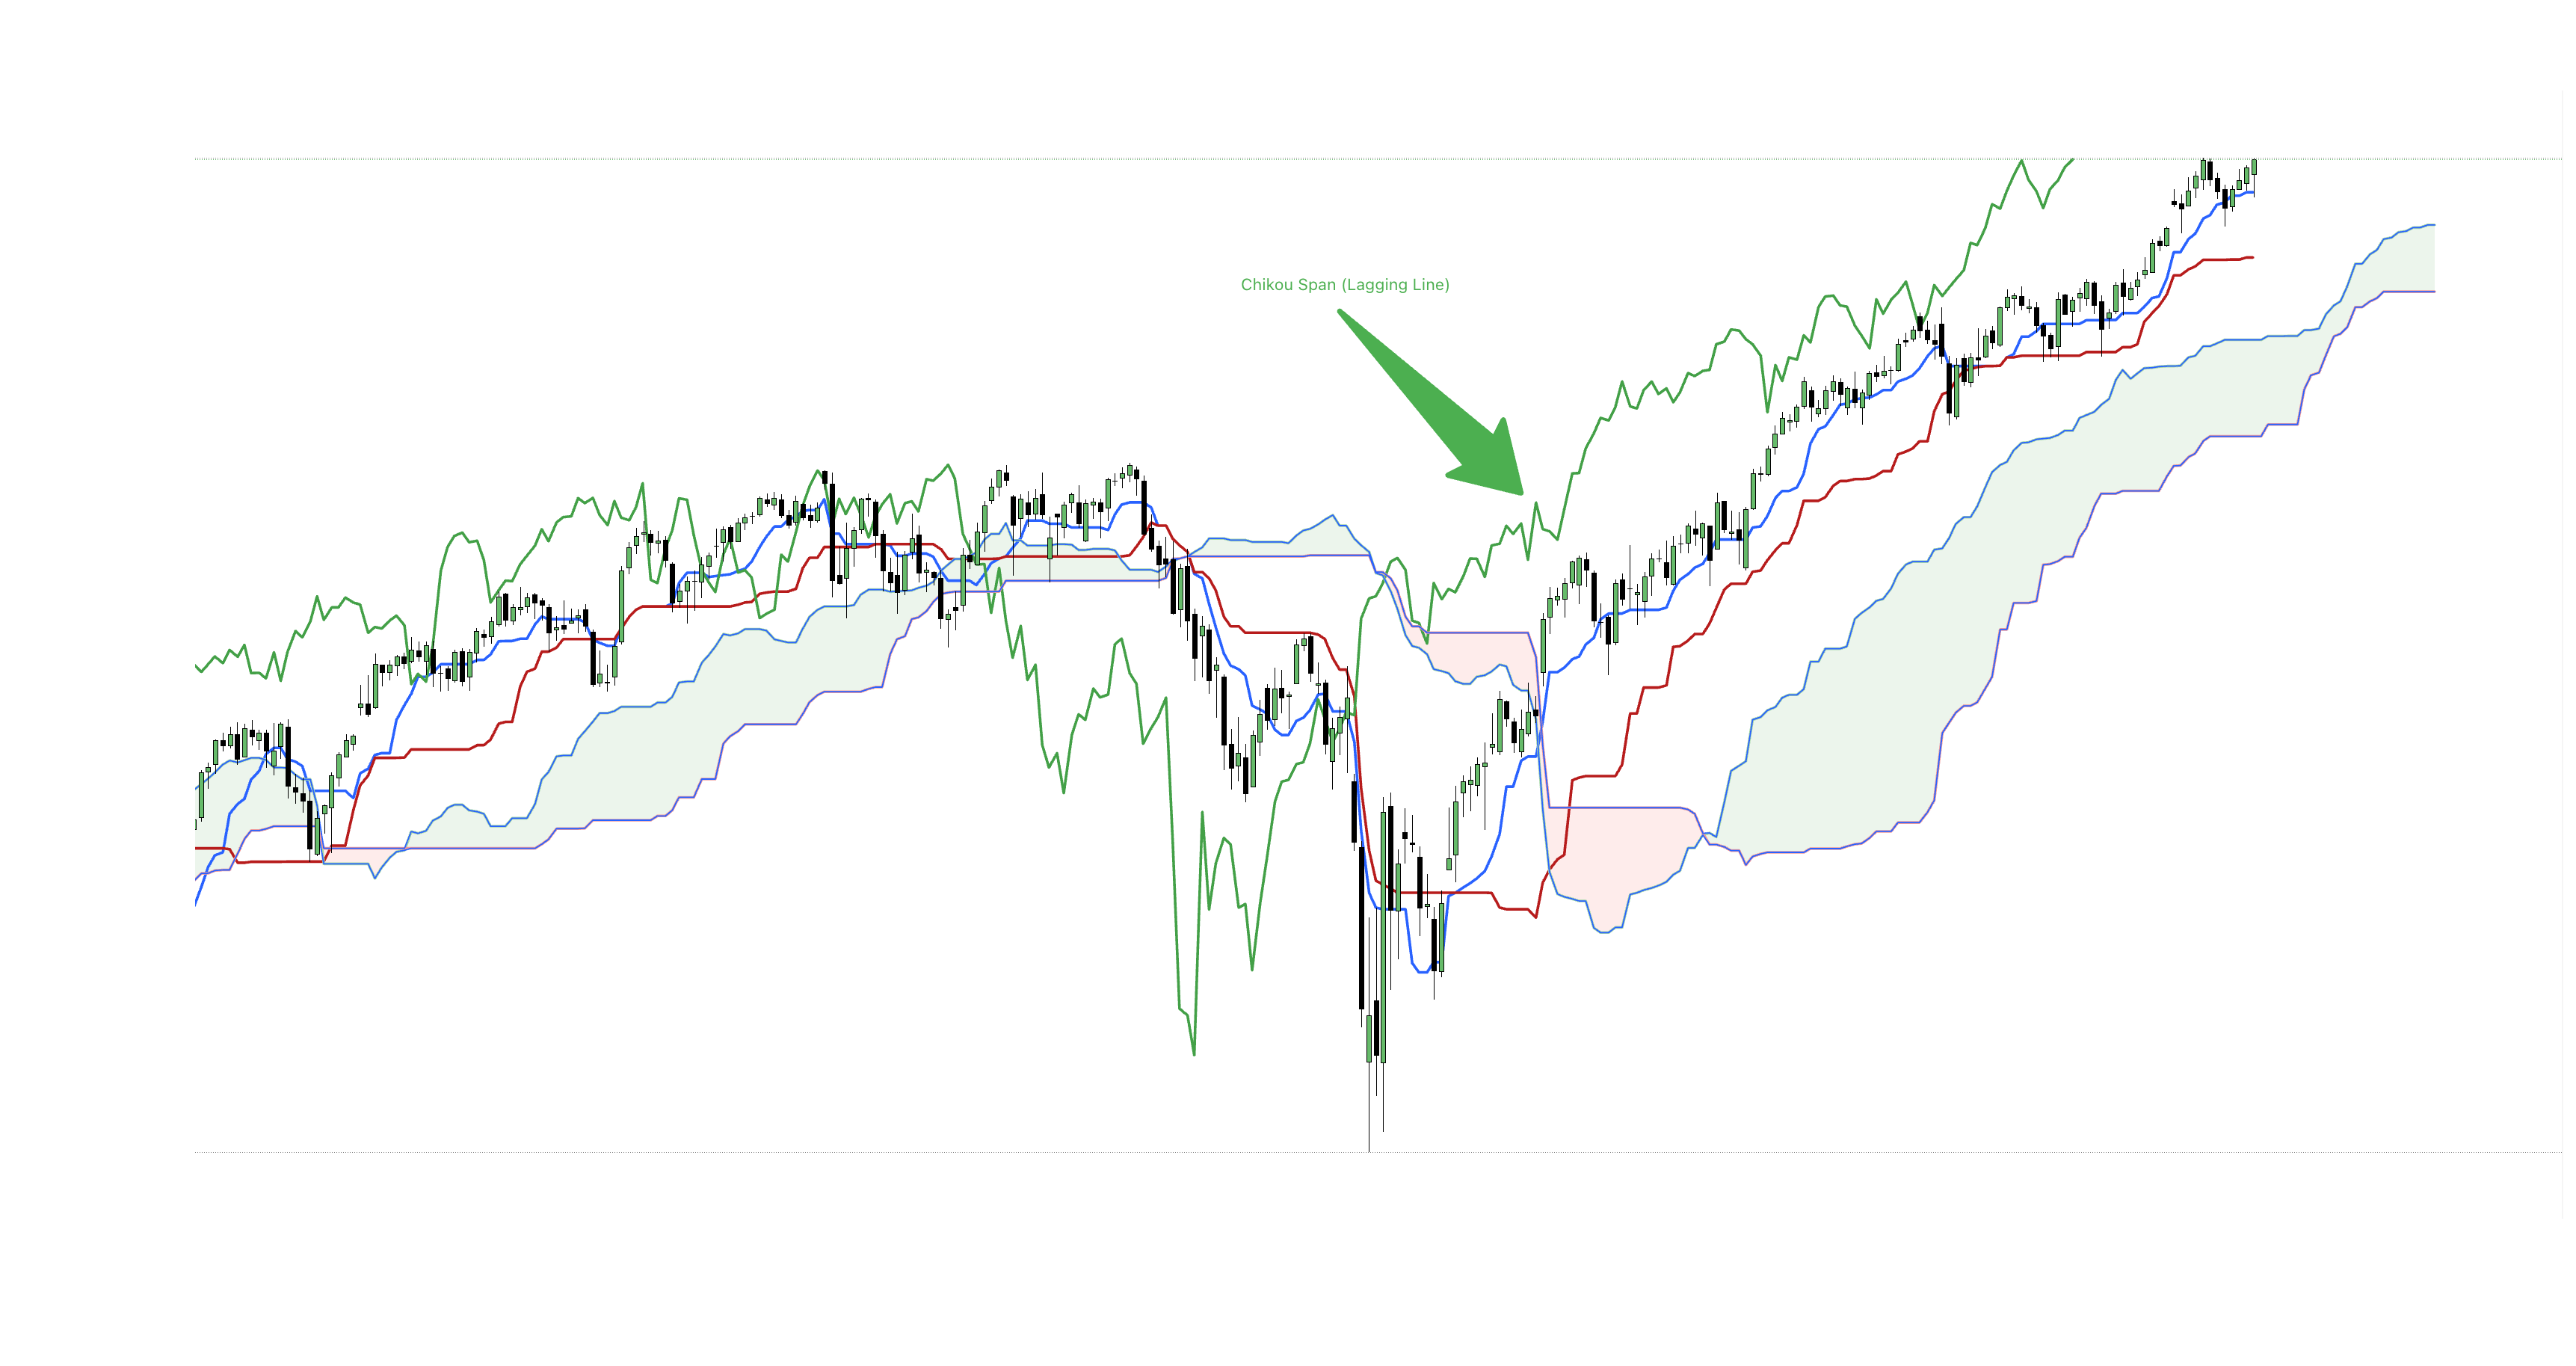
6. Chikou Span (Lagging Line)
The current closing price plotted 26 periods back.
Chikou acts as the ultimate confirmation veto. When Chikou is positioned above past price candles and above the historical Cloud, the path ahead is clear of overhead resistance.
Chikou Span Lagging Span
5. Interpreting Ichimoku Signals
- Tenkan–Kijun (TK) Crosses: A bullish TK cross occurs when Tenkan rises above Kijun. Signals generated above the Kumo carry the highest probability.
- Chikou Breakout Confirmation: Validates breakouts when Chikou clears historical high/low price structure without obstruction.
- Edge-to-Edge Kumo Moves: When price closes inside the Cloud, it frequently travels completely through to the opposite Span boundary.
- Kumo Twist Predictions: A forward cross between Span A and Span B forecasts an impending shift in market balance.
6. Understanding the Kumo (Cloud)
Kumo as Dynamic Support & Resistance
In a rising market, pullbacks into the top edge of the Kumo frequently find strong institutional buying. Conversely, rallies into the lower boundary of a falling Kumo encounter dynamic selling pressure.
Kumo Twist (Span A / Span B Crossover)
When Span A crosses Span B 26 periods in advance, the Cloud flips color. This forward twist serves as an early warning of structural regime change, signaling that the broader market equilibrium is rotating.
Kumo Breakouts: Thin vs. Thick Clouds
- Thick Kumo: Acts as a dense structural buffer requiring high volume and momentum to penetrate.
- Thin Kumo: Represents low-volatility equilibrium gates where price can easily pierce through and initiate rapid trend reversals.
7. Ichimoku Trading Strategies
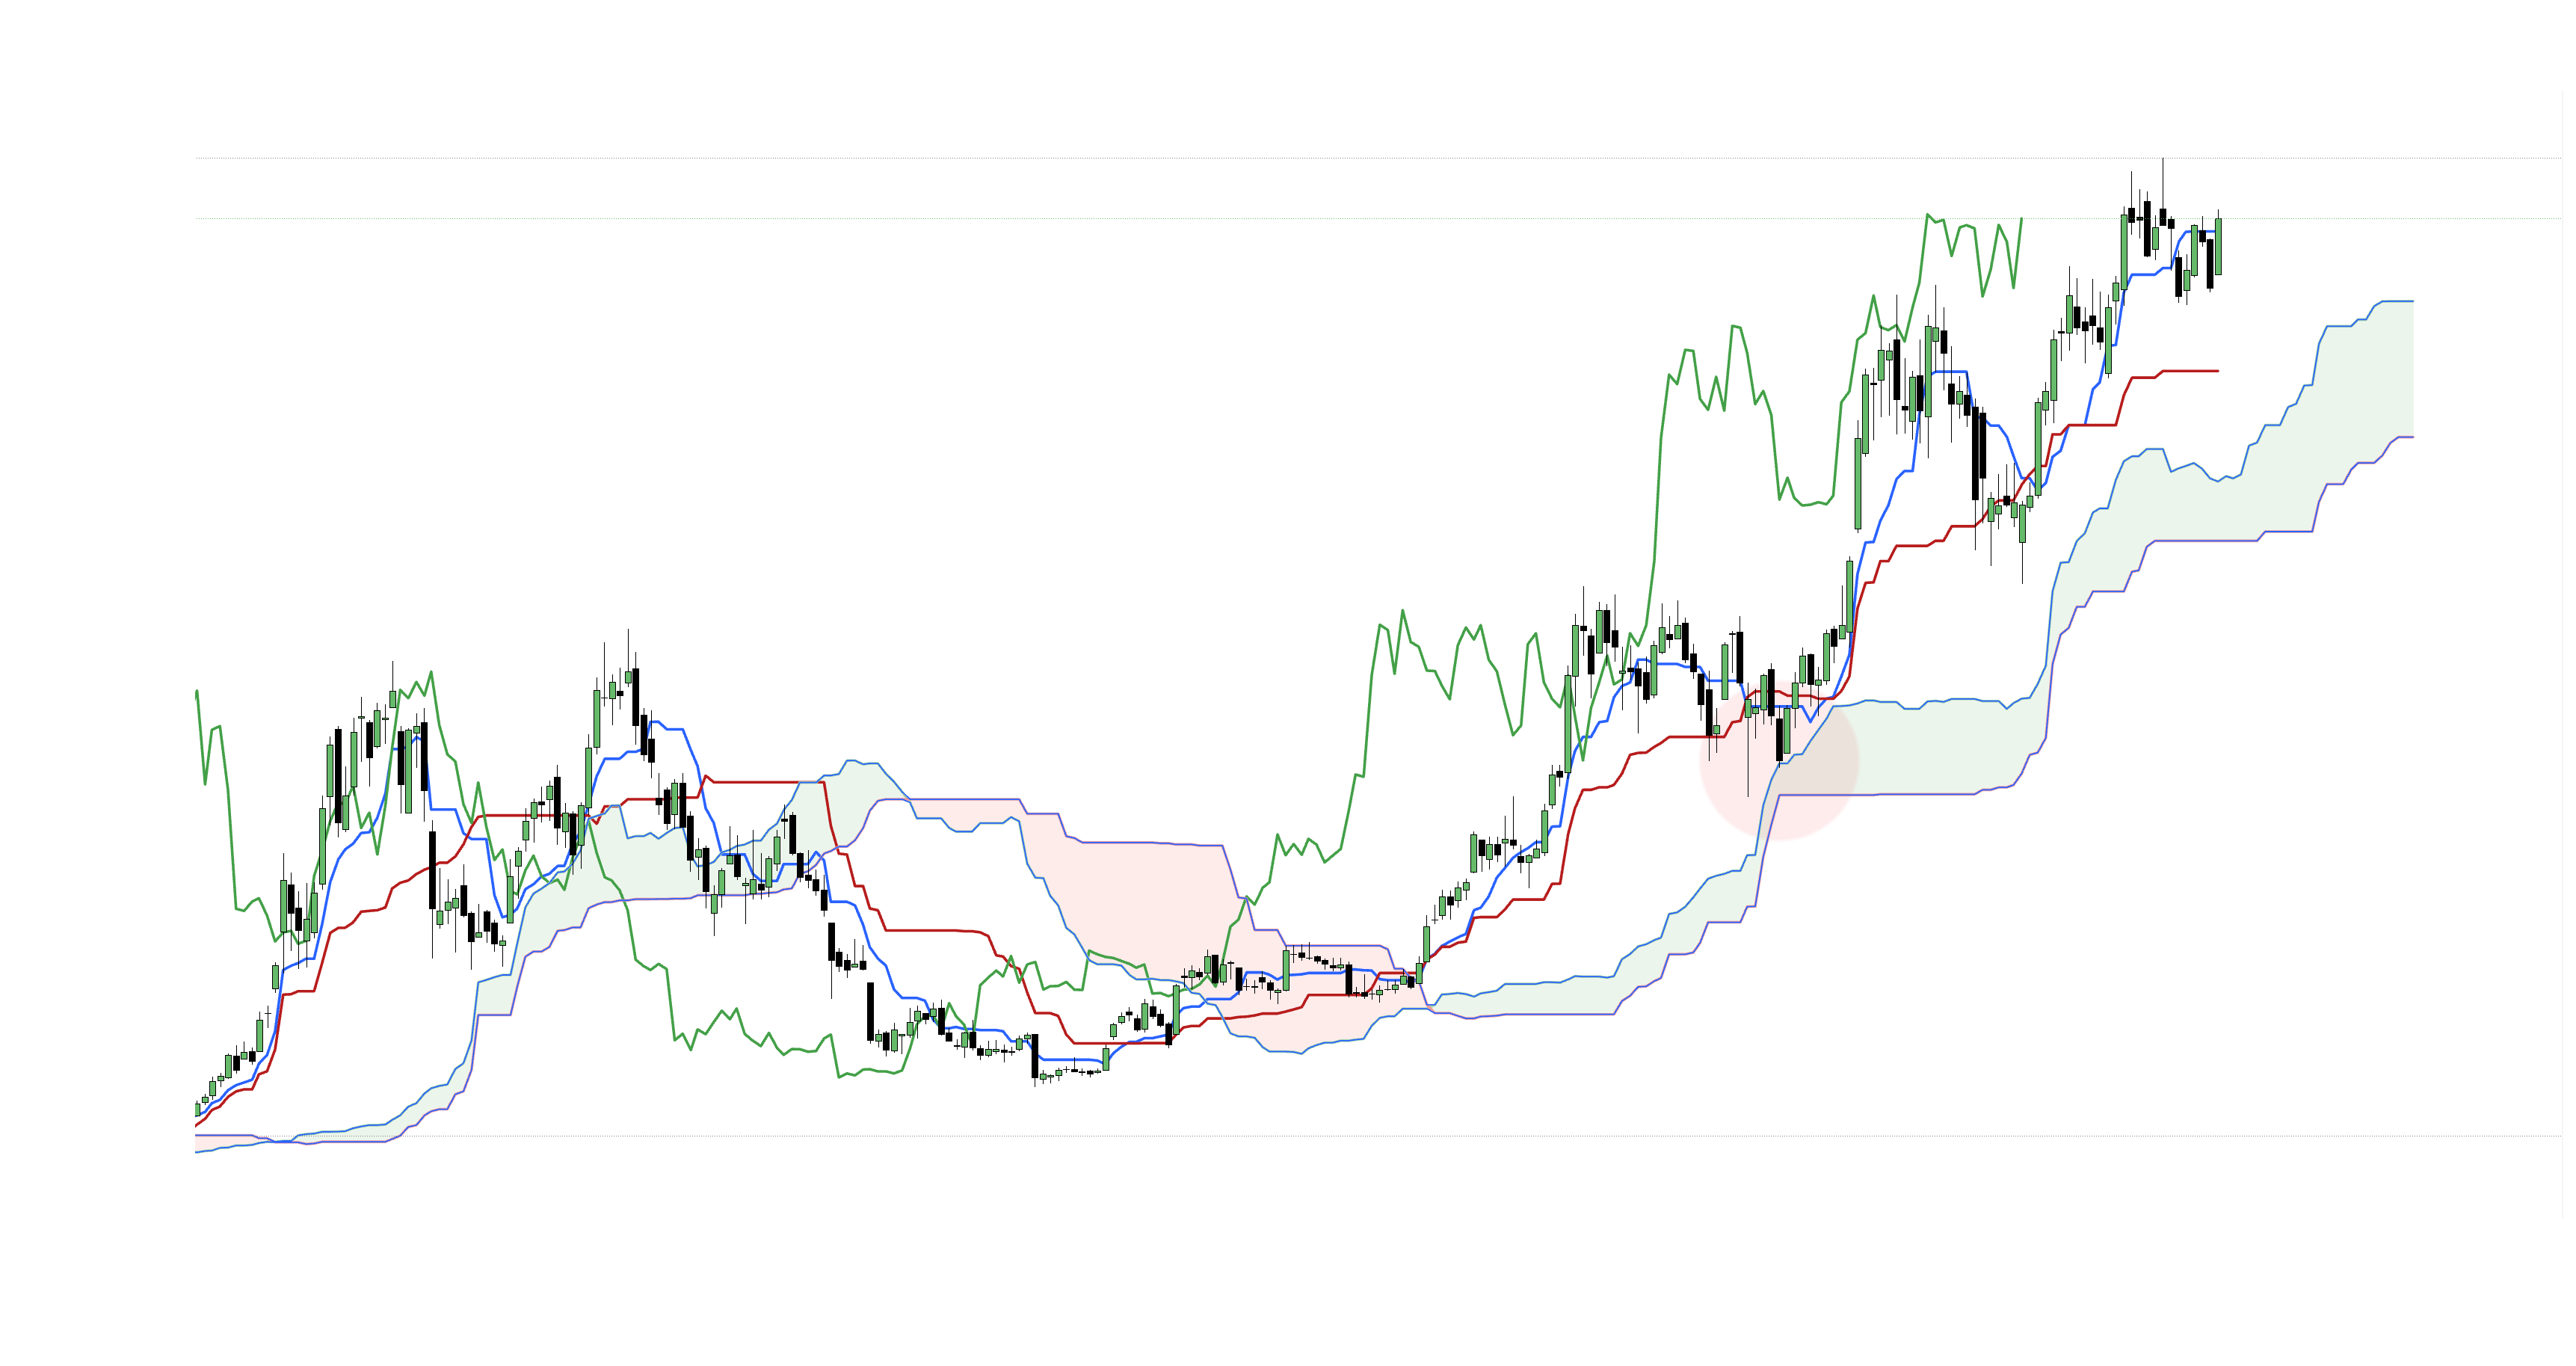
Strategy 1: Kumo Retest & Bounce
Identify established trends where price pulls back to test a flat Senkou Span B shelf or upper Cloud edge. Look for candlestick rejection patterns confirming dynamic support before entering in the trend direction.
Kumo Support and Resistance Strategy
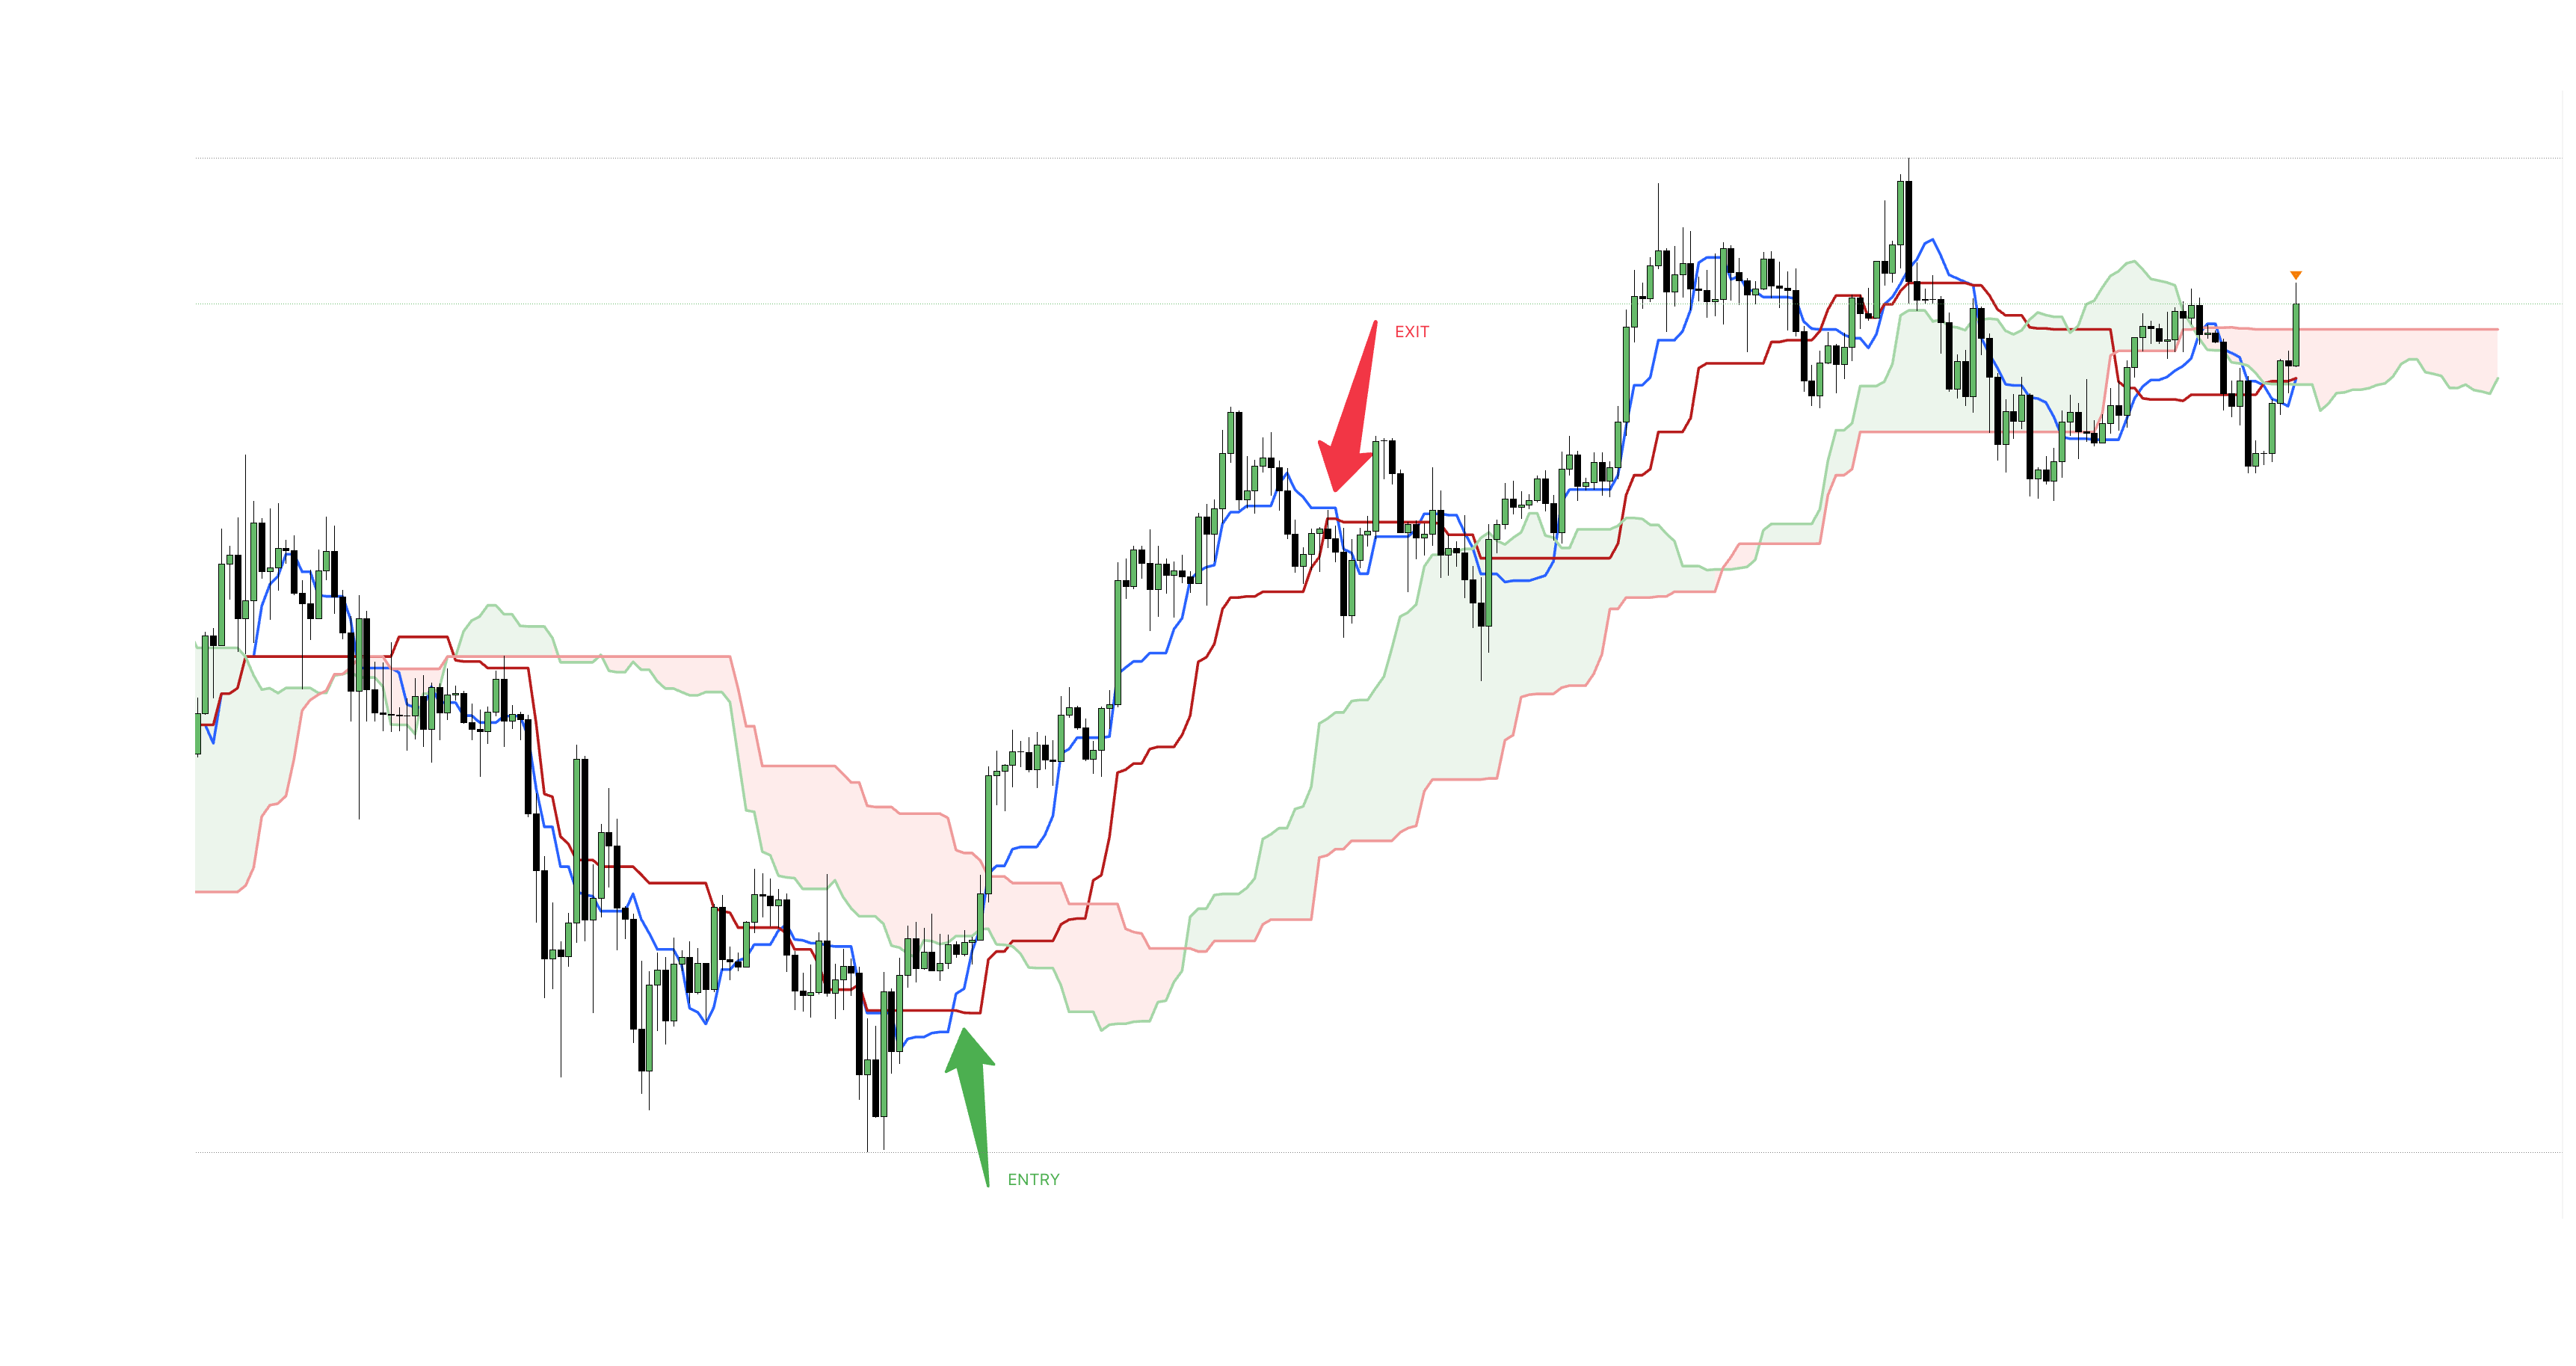
Strategy 2: Bullish / Bearish TK Crossover in Context
Filter Tenkan-Kijun crosses strictly by Cloud regime. Enter long when a bullish TK cross occurs above a rising green Kumo with Chikou open to space, placing stops below the Kijun-sen.
Tenkan-Kijun Crossover Strategy
8. Key Takeaways & Checklist
- Context first: Let the position of price relative to the Kumo determine whether you are buyer, seller, or neutral.
- Demand confluence: Only take TK crossover signals that align with the forward Cloud slope and Chikou clearance.
- Respect equilibrium magnets: Use flat Kijun-sen and flat Senkou Span B lines as logical profit targets and key retest levels.
- Manage risk methodically: Anchor protective stop-losses behind structural Kijun-sen lines or outer Kumo boundaries.