The Moving Average Convergence Divergence (MACD) is a trend-following momentum indicator that measures the relationship between two moving averages of an asset's price. Developed by Gerald Appel in the late 1970s, MACD is designed to provide insights into both trend strength and momentum.
Unlike simple moving averages, which merely smooth price data over a specific period, MACD goes a step further by identifying when short-term momentum is shifting in relation to the long-term trend. This makes it a valuable tool for traders looking to enter or exit positions at optimal points.
1. Why is MACD important in trading?
- Trend Confirmation: Identifies whether an asset is in an uptrend or downtrend.
- Momentum Strength: Measures how strong a price movement is.
- Reversal Signals: Detects potential changes in trend direction.
- Entry and Exit Points: Helps traders determine when to buy and sell.
2. MACD Components
MACD Components
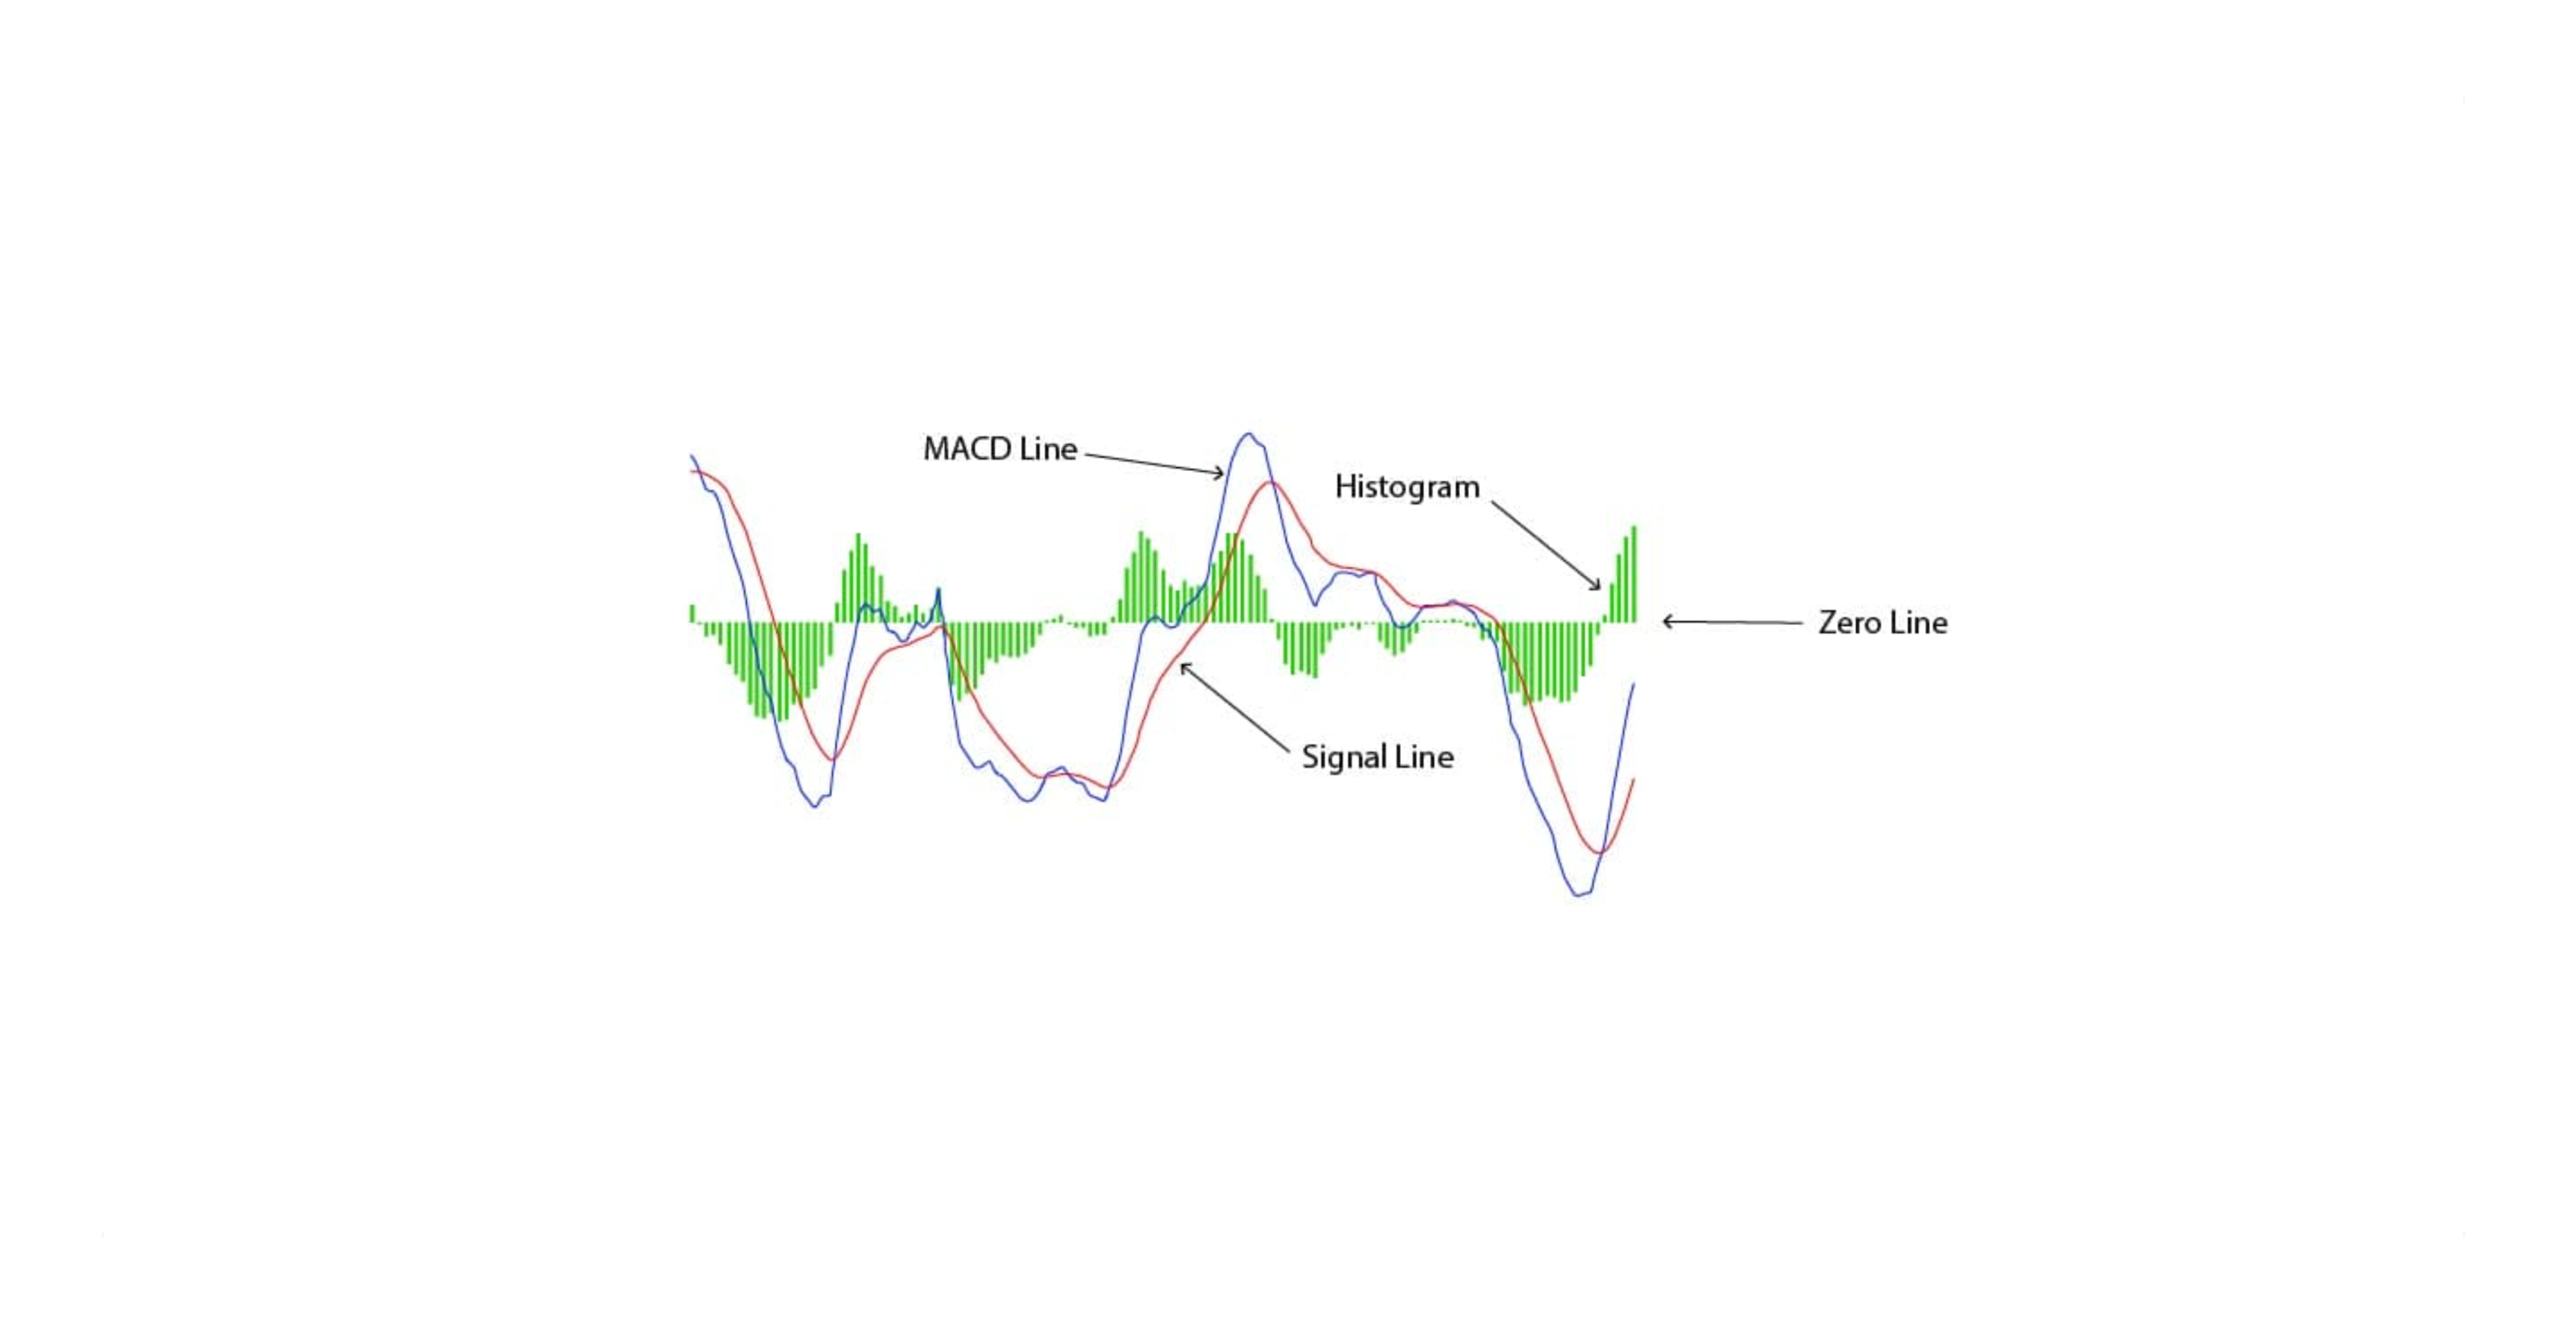
- The MACD Line: Identifies whether an asset is in an uptrend or downtrend.
- This line is derived by subtracting the 26-period Exponential Moving Average (EMA) from the 12-period EMA.
- When the MACD Line is positive, it indicates bullish momentum; when negative, it suggests bearish momentum.
- The Signal Line: Measures how strong a price movement is.
- A 9-period EMA of the MACD Line.
- It smooths out MACD fluctuations, making it easier to identify crossovers.
- The Histogram: Detects potential changes in trend direction.
- The difference between the MACD Line and the Signal Line.
- A positive histogram suggests increasing bullish momentum, while a negative histogram suggests growing bearish momentum.
3. MACD Formula
The Moving Average Convergence Divergence (MACD) is one of the most widely used technical indicators in trading. It helps traders identify trends, momentum shifts, and potential buy or sell opportunities by analyzing the relationship between two moving averages.
By calculating the difference between a short-term and long-term exponential moving average (EMA), MACD provides insight into market direction and strength.
//@version=6
indicator("MACD Indicator", overlay=false)

// MACD parameters
shortLength = 12
longLength = 26
signalLength = 9

// Calculate MACD
macdLine = ta.ema(close, shortLength) - ta.ema(close, longLength)
signalLine = ta.ema(macdLine, signalLength)
histogram = macdLine - signalLine

// Plot MACD components
plot(macdLine, color=color.blue, title="MACD Line")
plot(signalLine, color=color.red, title="Signal Line")
plot(histogram, color=color.green, style=plot.style_columns, title="Histogram")
Explanation:
- Short EMA (12-period) and Long EMA (26-period) are calculated.
- The MACD Line is the difference between these EMAs.
- A Signal Line (9-period EMA of MACD Line) is calculated.
- The Histogram represents the difference between the MACD Line and the Signal Line.
4. Interpreting MACD signals
MACD Crossovers
MACD Crossovers
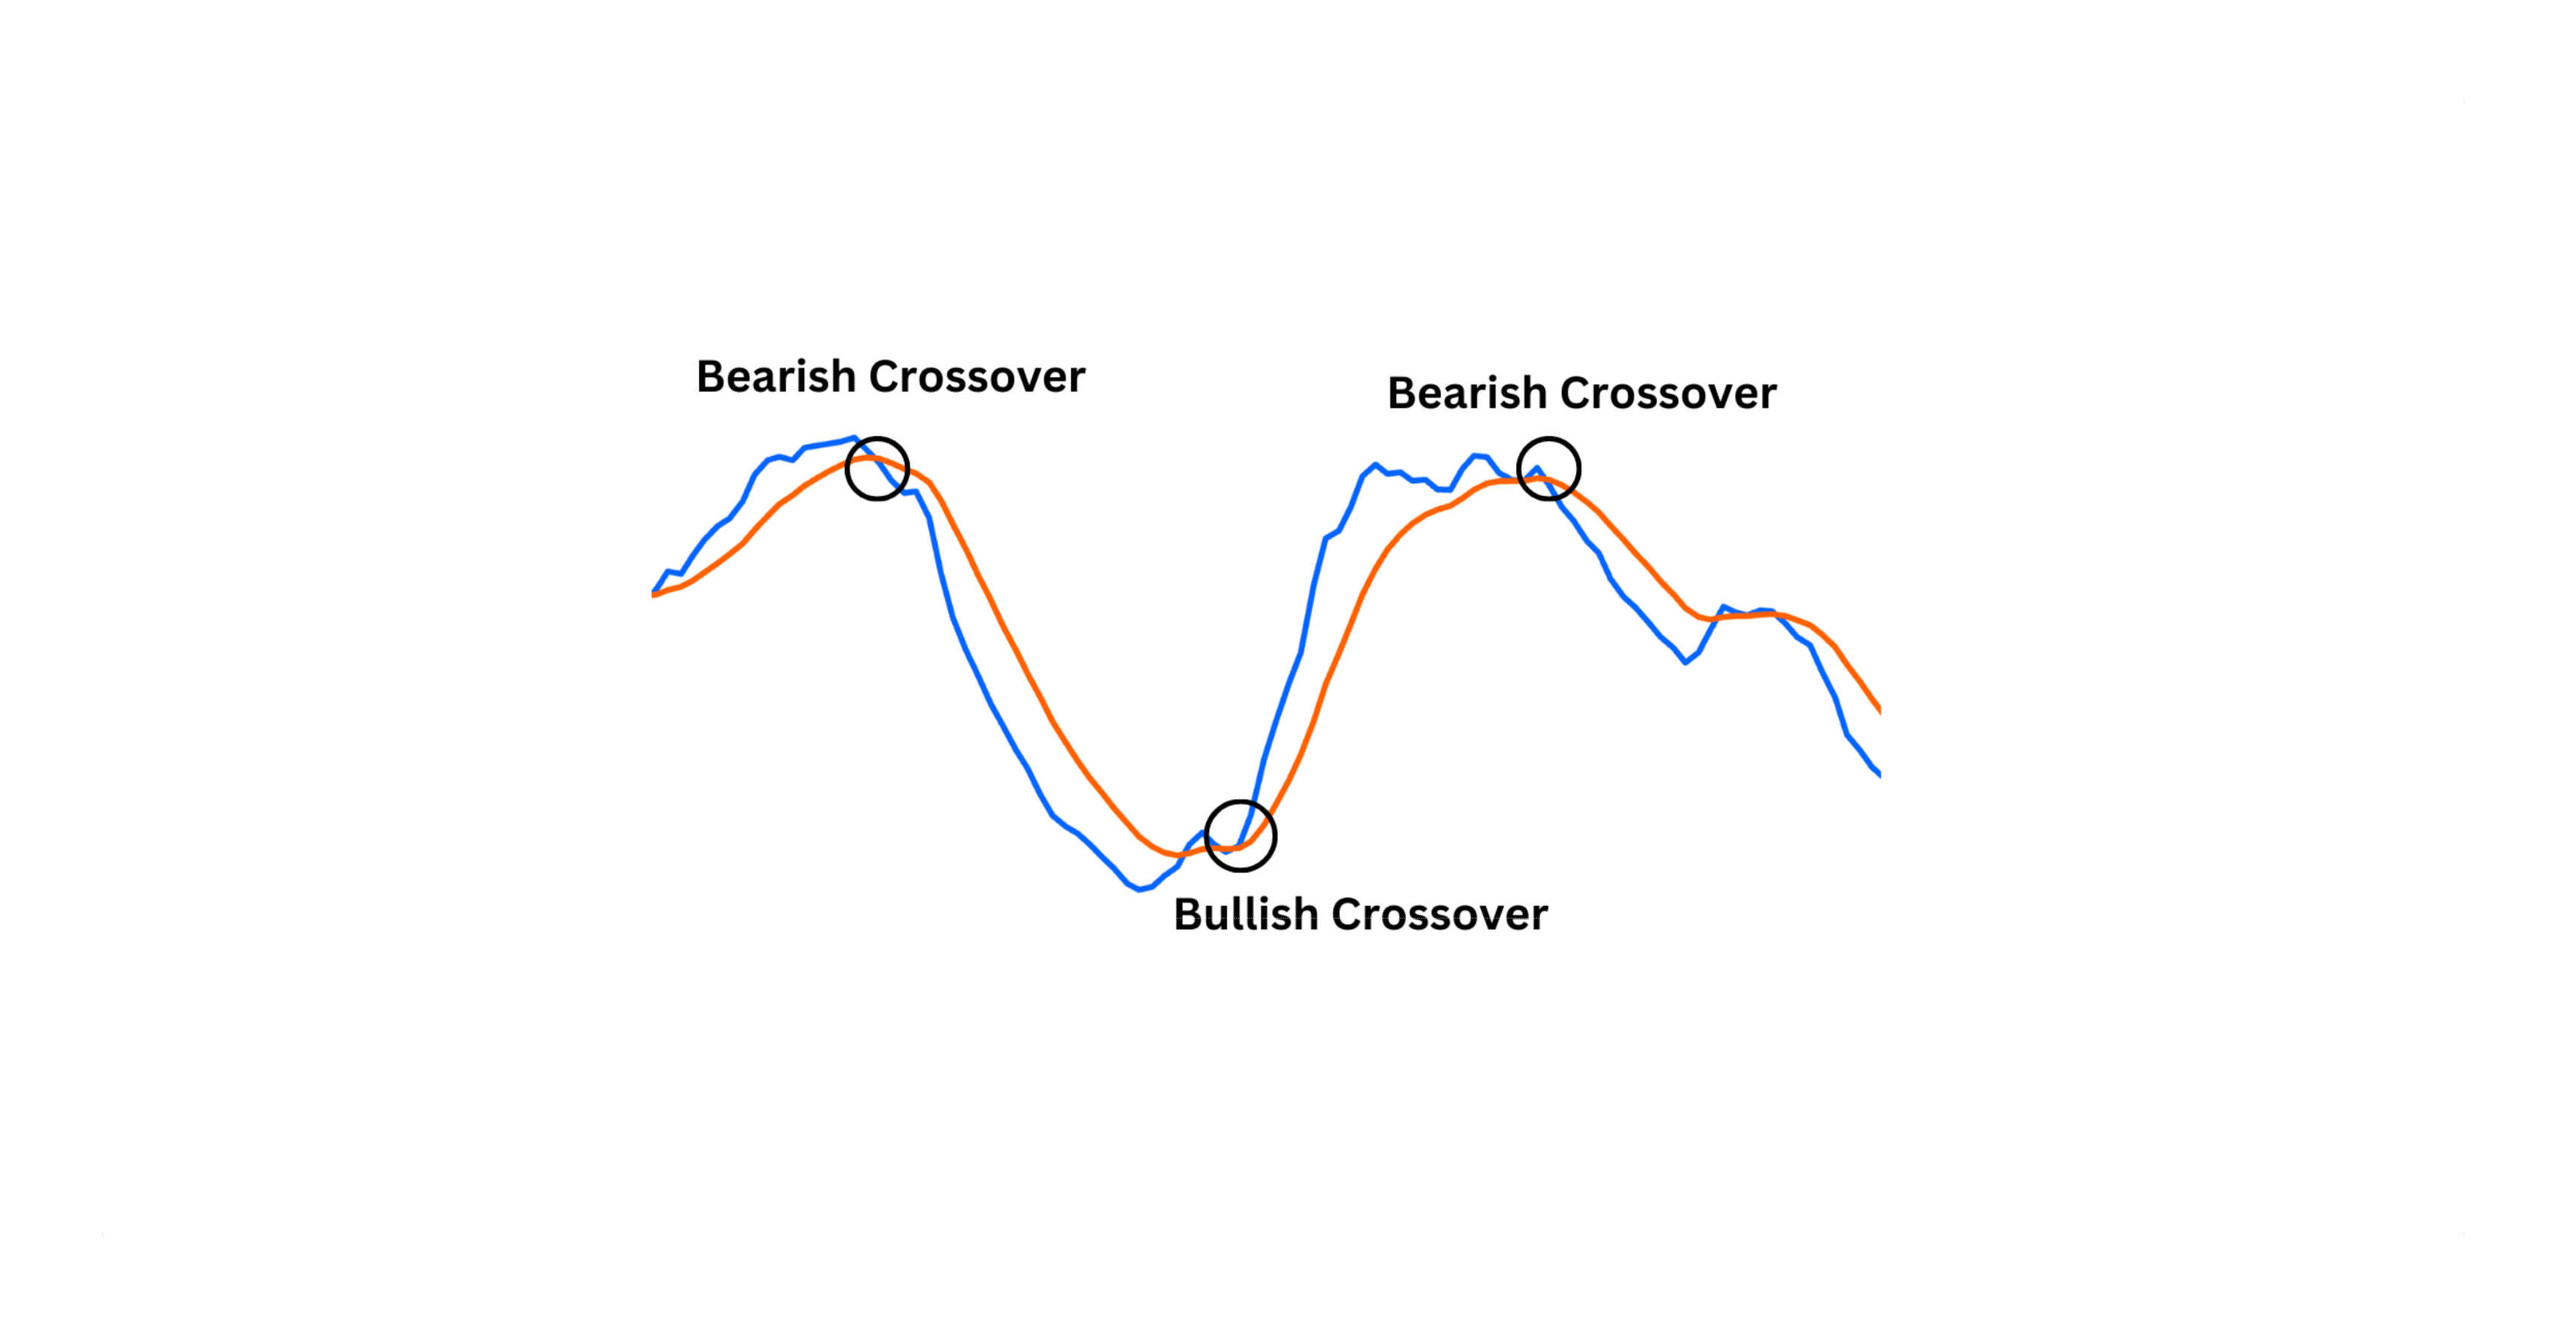
A crossover occurs when the MACD Line and Signal Line intersect:
- Bullish Crossover: When the MACD Line crosses above the Signal Line, it signals a potential uptrend and a buying opportunity.
- Bearish Crossover: When the MACD Line crosses below the Signal Line, it suggests a potential downtrend and a selling opportunity.
MACD Divergences
MACD Divergences
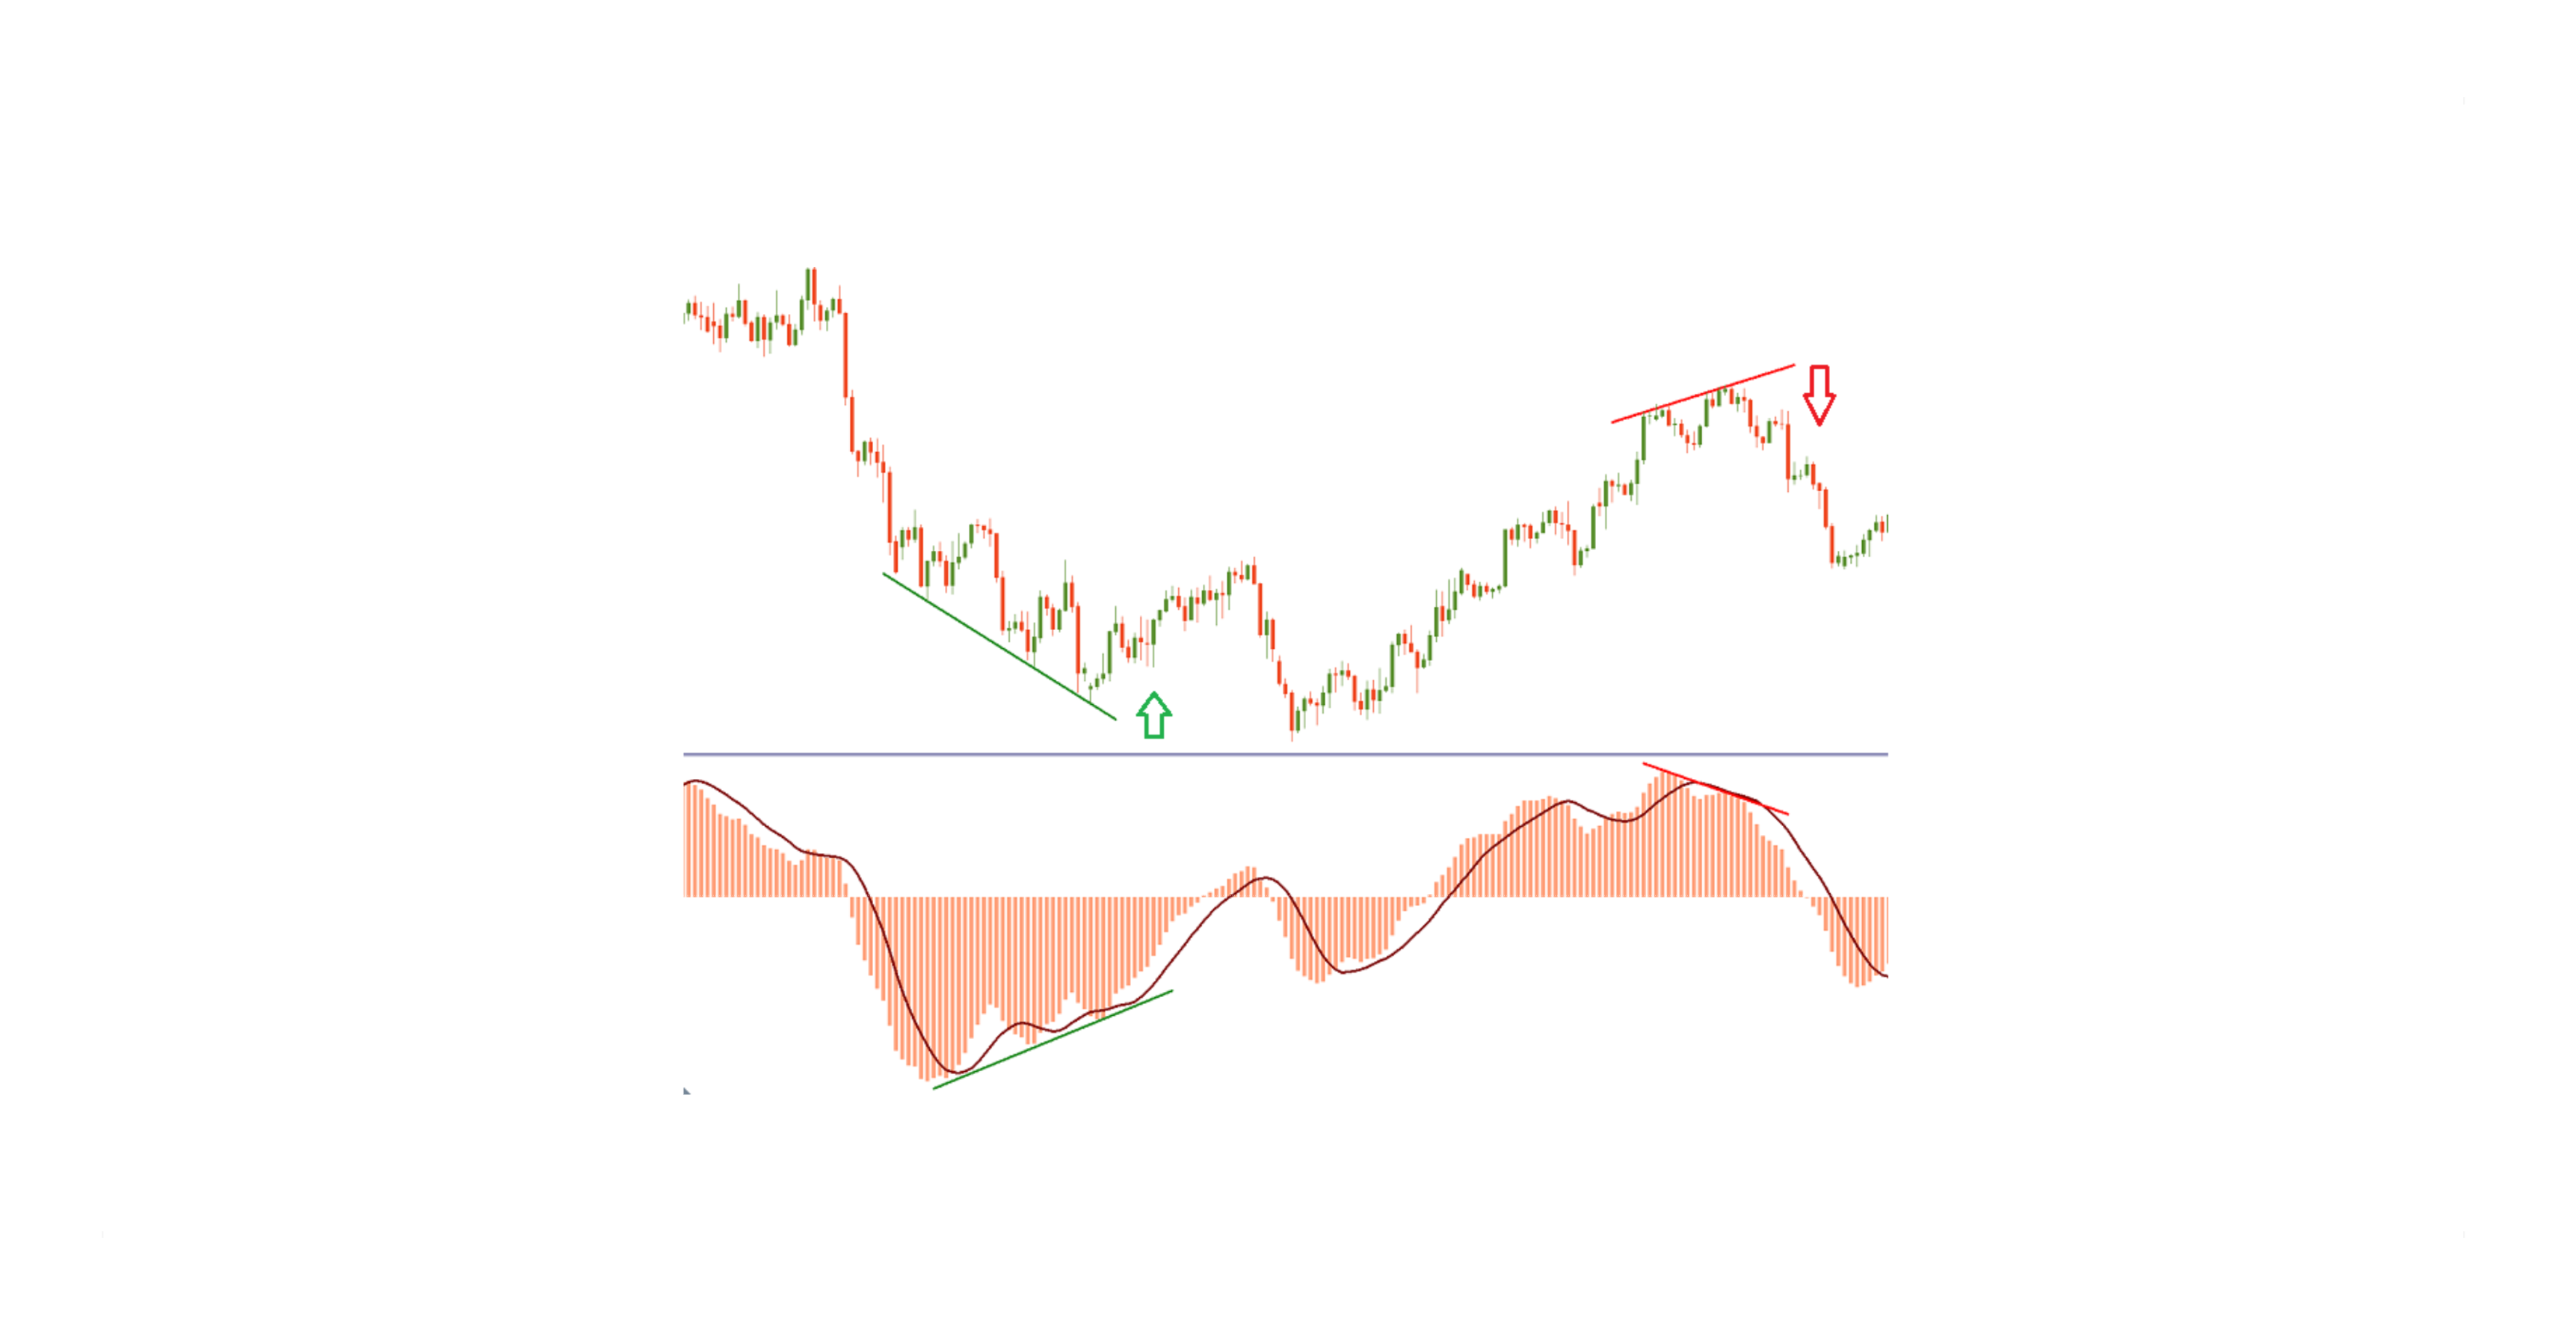
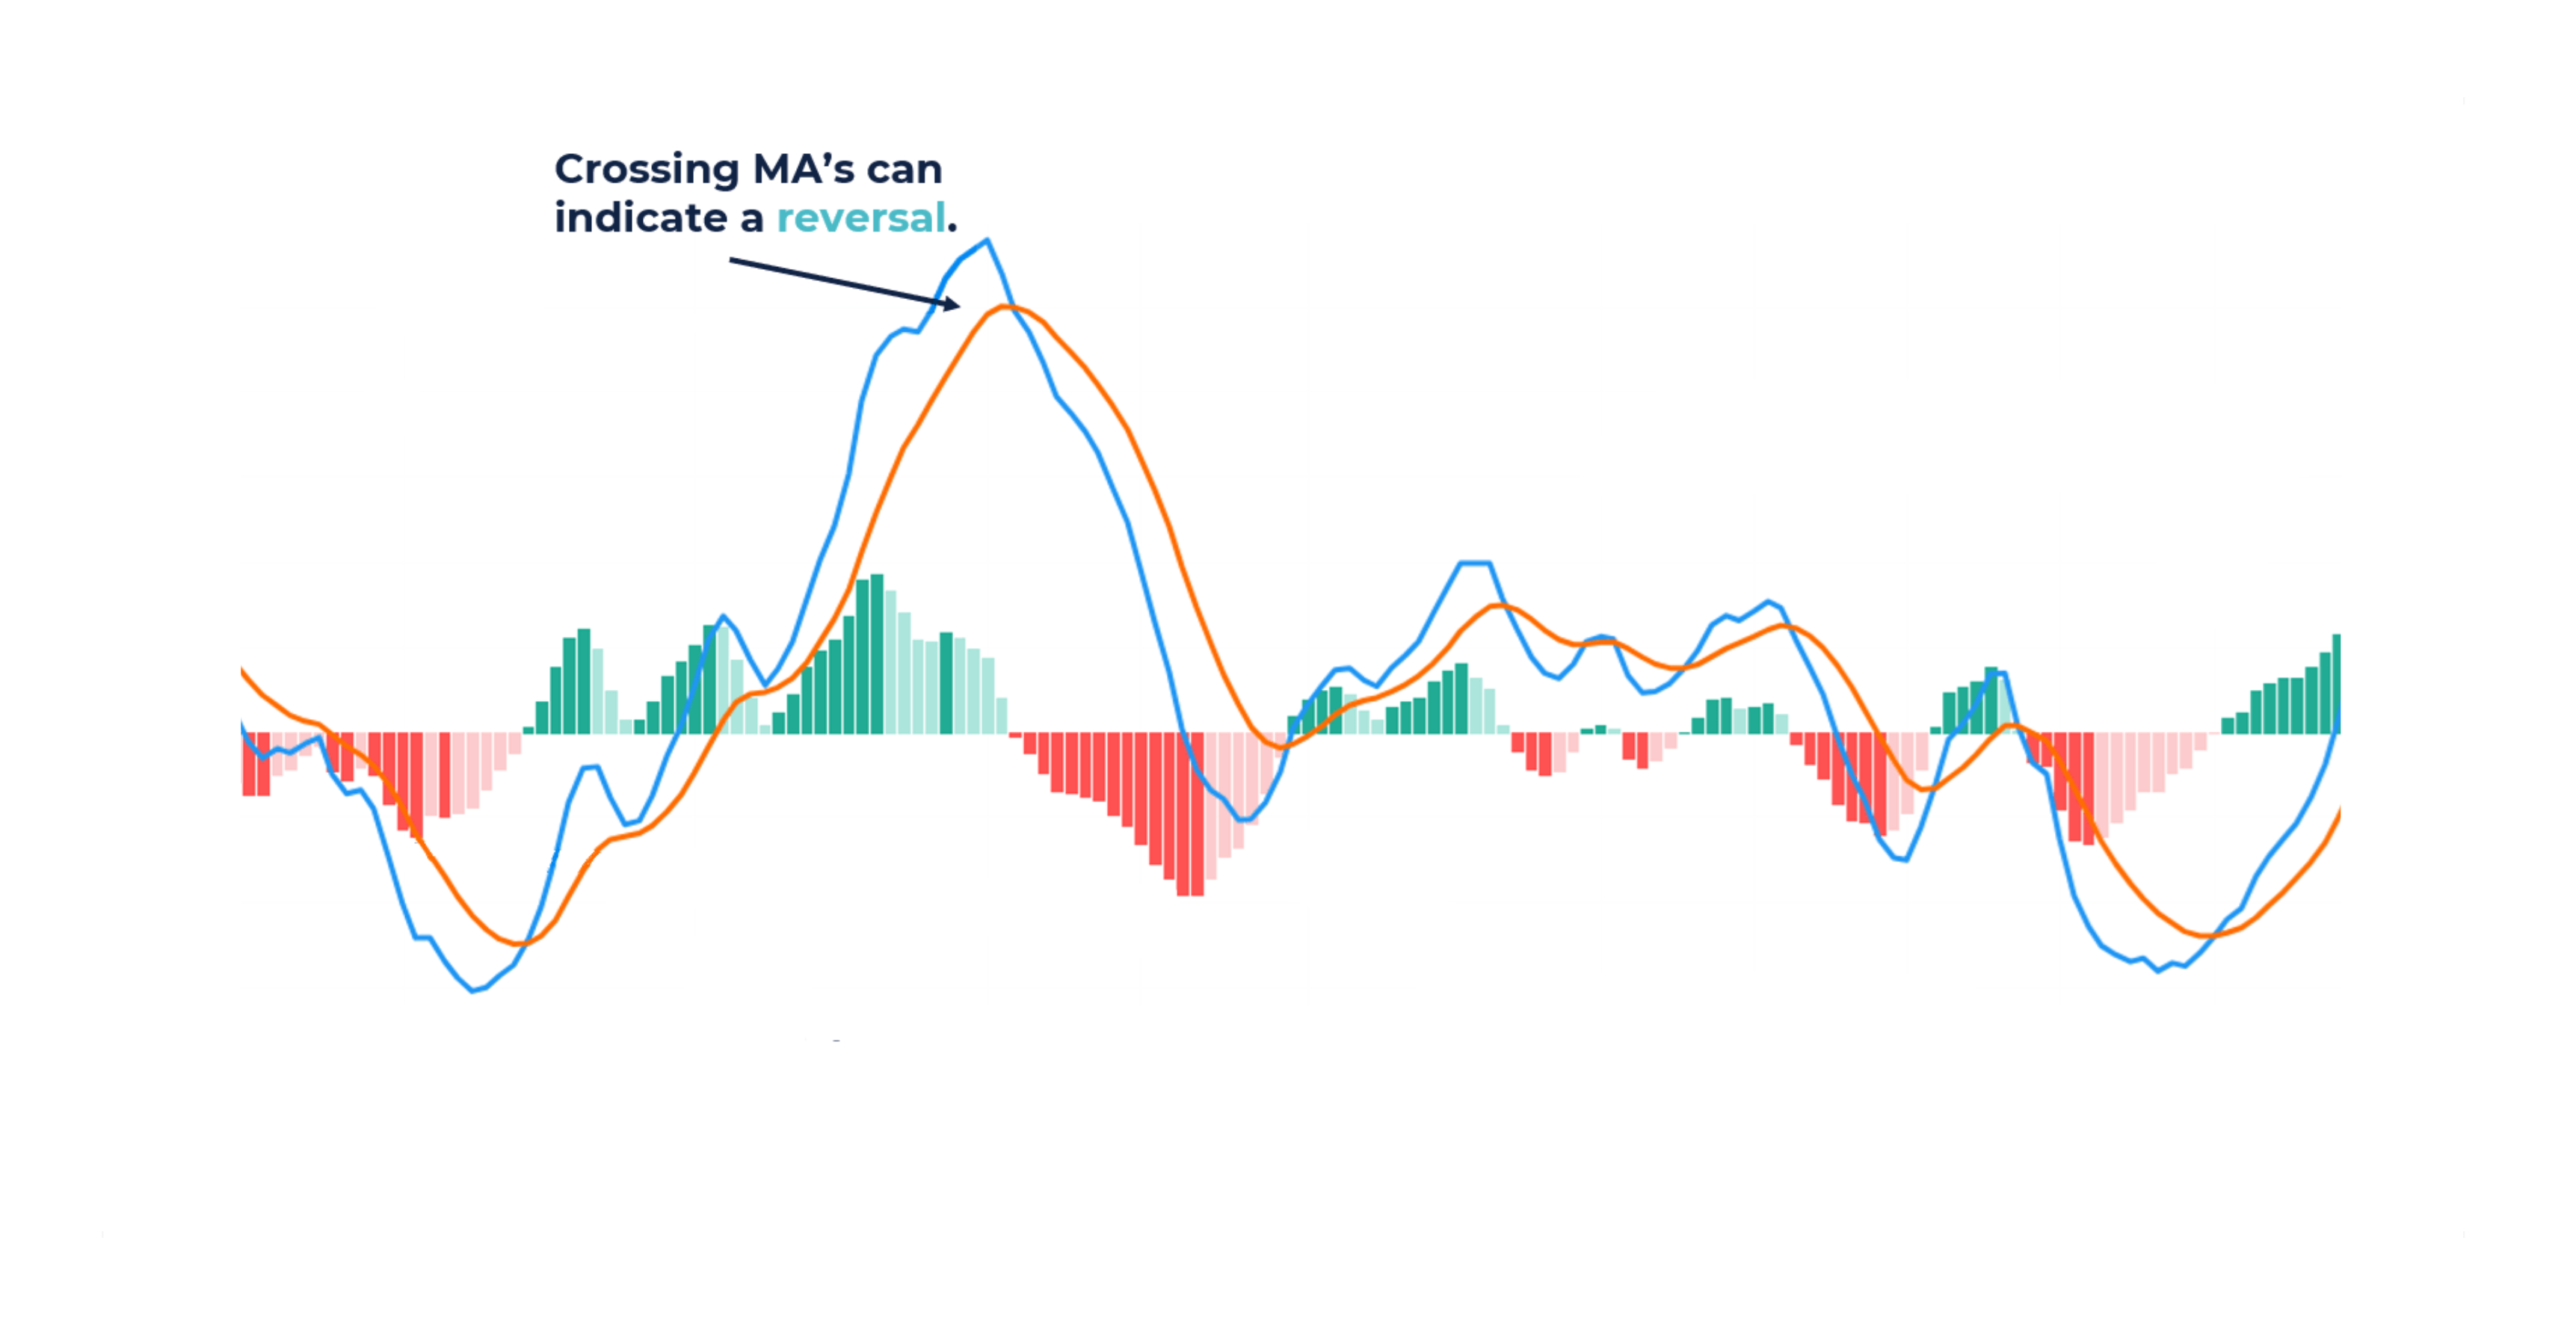
Divergences occur when MACD moves in the opposite direction of the price, signaling a potential reversal:
- Bullish Divergence: If price makes lower lows, but MACD makes higher lows, it suggests weakening downward momentum and a possible bullish reversal.
- Bearish Divergence: If price makes higher highs, but MACD makes lower highs, it signals weakening upward momentum and a potential bearish reversal.
Histogram Interpretation
Histogram Interpretation
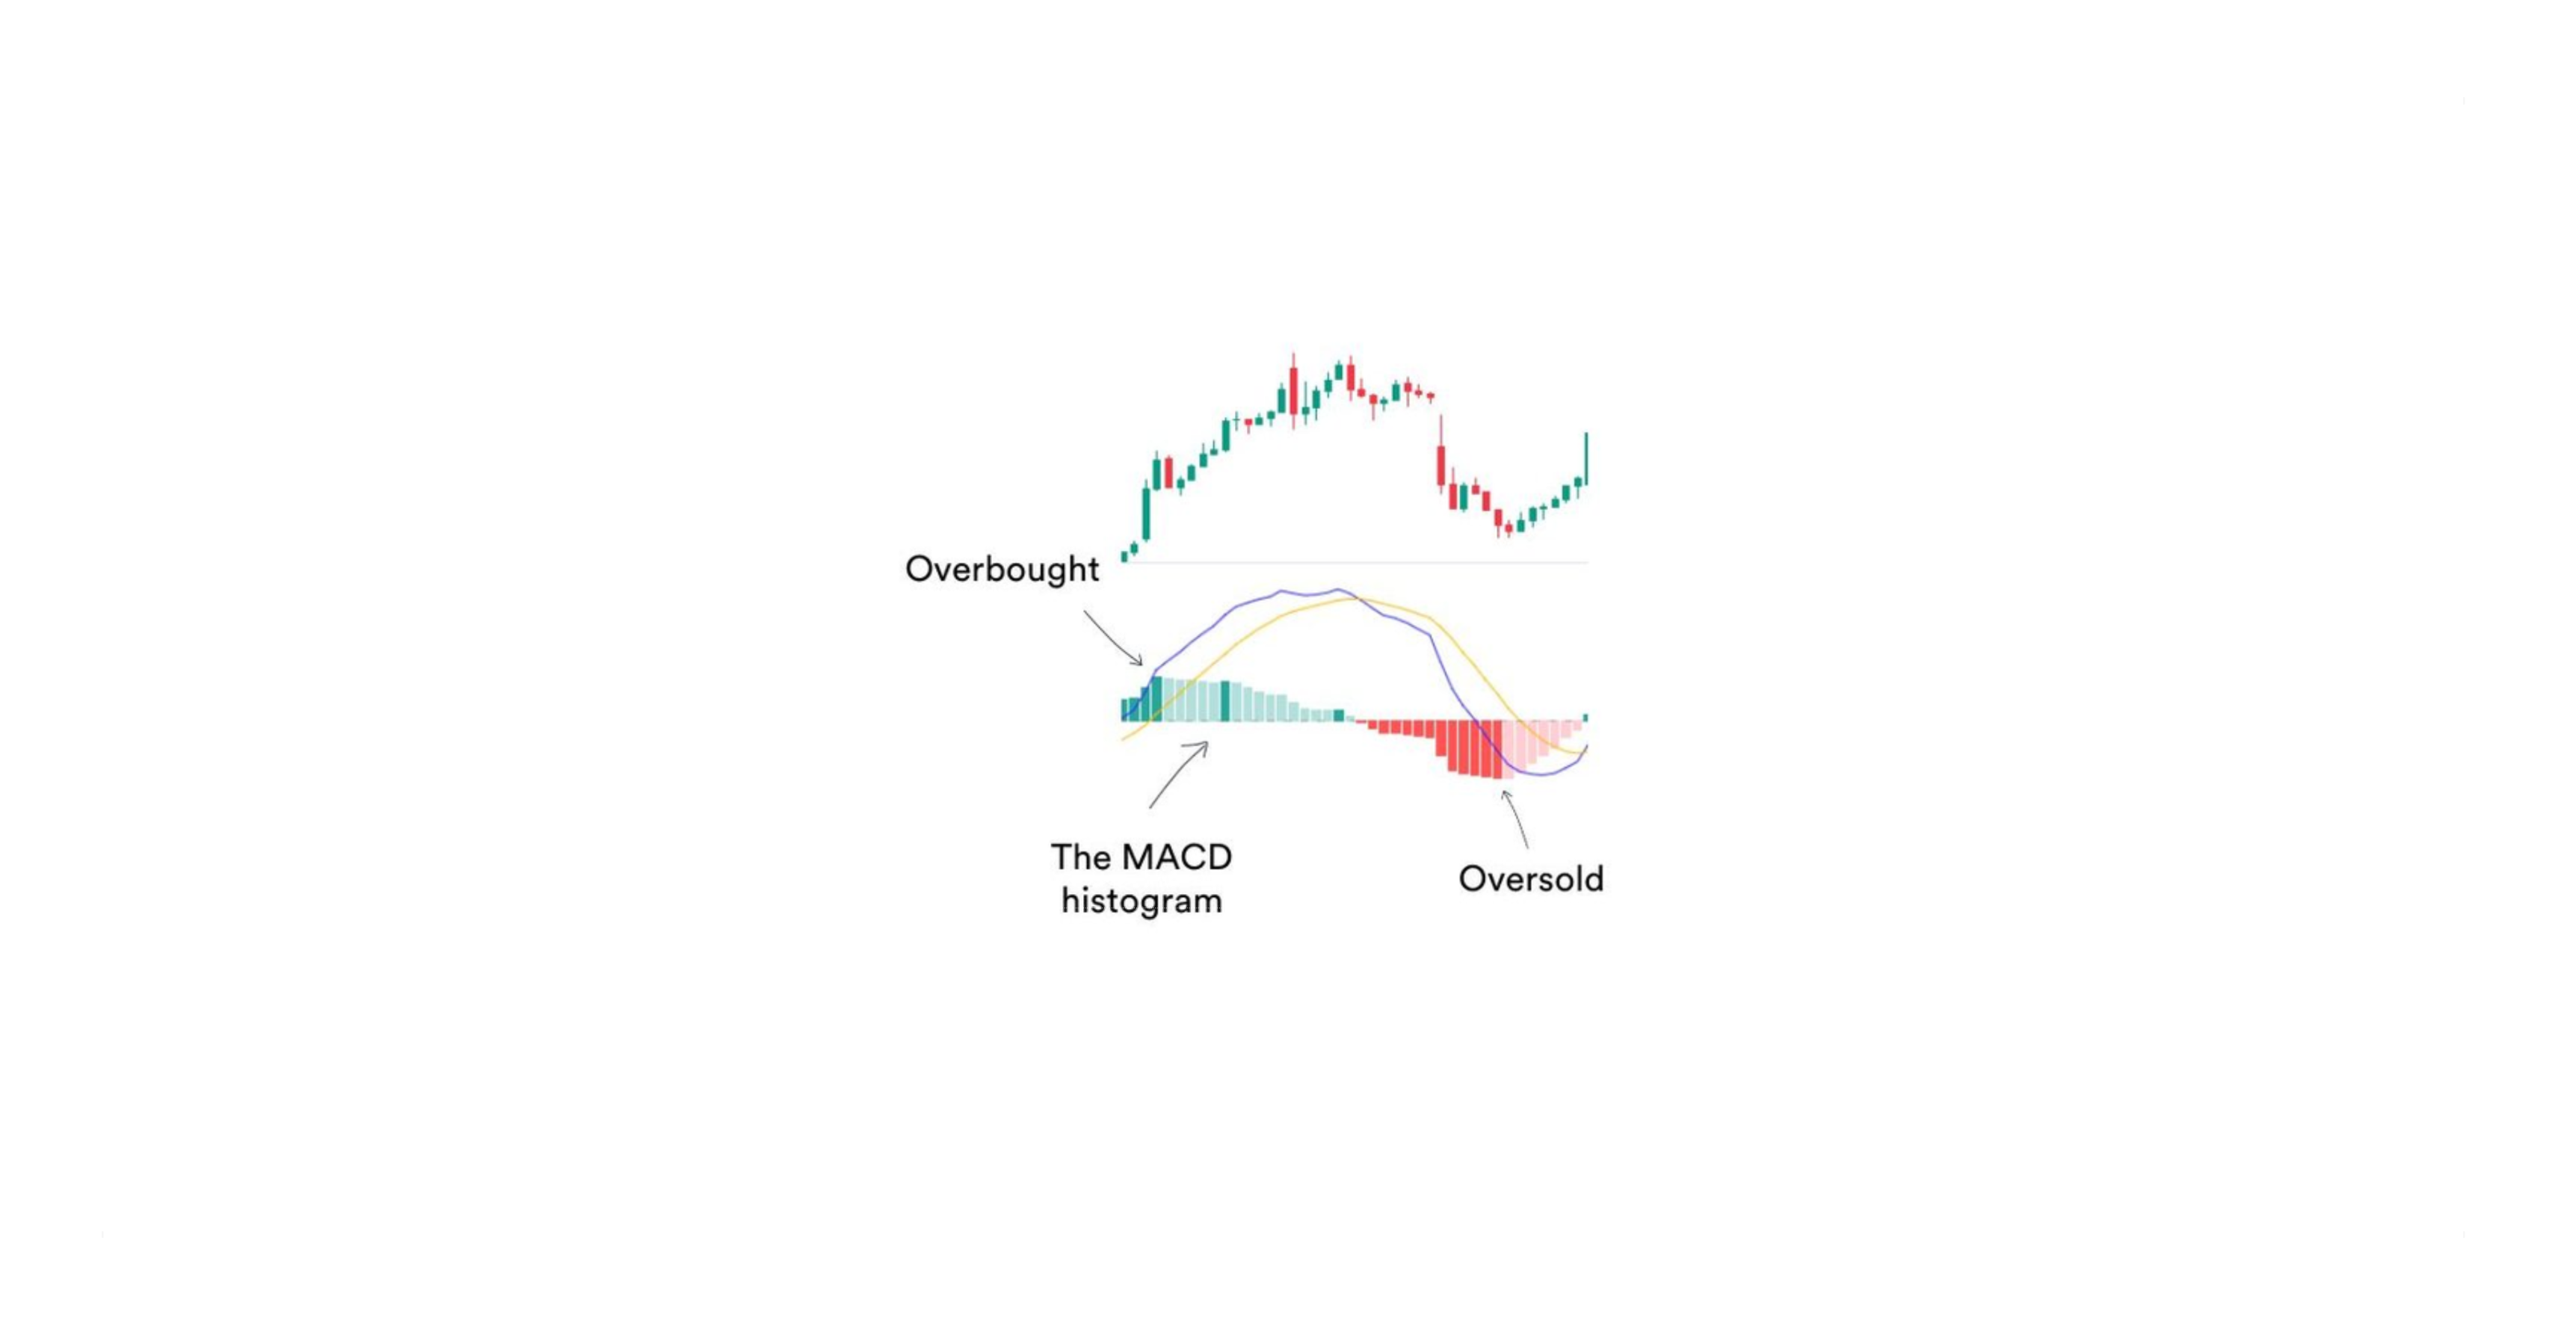
The MACD histogram visually represents momentum shifts:
- When bars are increasing in height, momentum is strengthening.
- When bars shrink, it suggests momentum is weakening.
Zero Line Crossings
Zero Line Crossings
The MACD crossing the zero line indicates momentum shifts:
- MACD crossing above zero → Bullish trend initiation.
- MACD crossing below zero → Bearish trend initiation.
5. Trend & Momentum Analysis
Traders use MACD to confirm trends and analyze market momentum:
- If MACD Line is above the Signal Line, an uptrend is in place.
- If MACD Line is below the Signal Line, a downtrend is dominant.
- A widening histogram confirms strong momentum in the trend's direction.
- A narrowing histogram warns of potential trend weakening.
MACD works best in trending markets and should be used cautiously in sideways markets.
6. MACD Based Trading Strategies
Entry Strategies
- Buy when MACD Line crosses above the Signal Line in an uptrend.
- Sell when MACD Line crosses below the Signal Line in a downtrend.
Exit Strategies
- Exit long trades when a bearish crossover occurs.
- Close short positions when a bullish crossover occurs.
Position Management
- If the histogram is expanding, traders can hold positions.
- If the histogram is contracting, it may signal weakening momentum.
7. Limitations of MACD
While MACD is a powerful tool, traders must consider:
- It lags behind price movements (since it is based on moving averages).
- It can generate false signals in choppy markets.
- Customization is required to suit different trading styles.
8. Optimization
Optimizing MACD for Different Market Conditions:
- Day Traders & Scalpers: Use faster settings like (5, 13, 6) for quick signals.
- Swing Traders: Stick with the default (12, 26, 9) setting for balanced signals.
- Long-Term Investors: Use slower settings like (24, 52, 18) for a broader market perspective.
9. Key Takeaways
- MACD is a momentum and trend-following indicator that helps traders identify market direction, strength, and potential reversals.
- Since MACD is a lagging indicator, it may generate false signals, especially in sideways markets.
- Combining MACD with RSI, moving averages, and volume indicators improves accuracy and reduces risk.
- MACD should be used alongside risk management strategies and other confirmation tools for best results.
MACD remains one of the most effective technical indicators, widely used across different markets. It helps traders identify trends, confirm momentum, and optimize trade entries and exits. However, it should always be used with additional tools to minimize false signals.