An institutional framework for reading where we are in the cycle — and where the money goes next
1. What a "Market Cycle" Actually Is
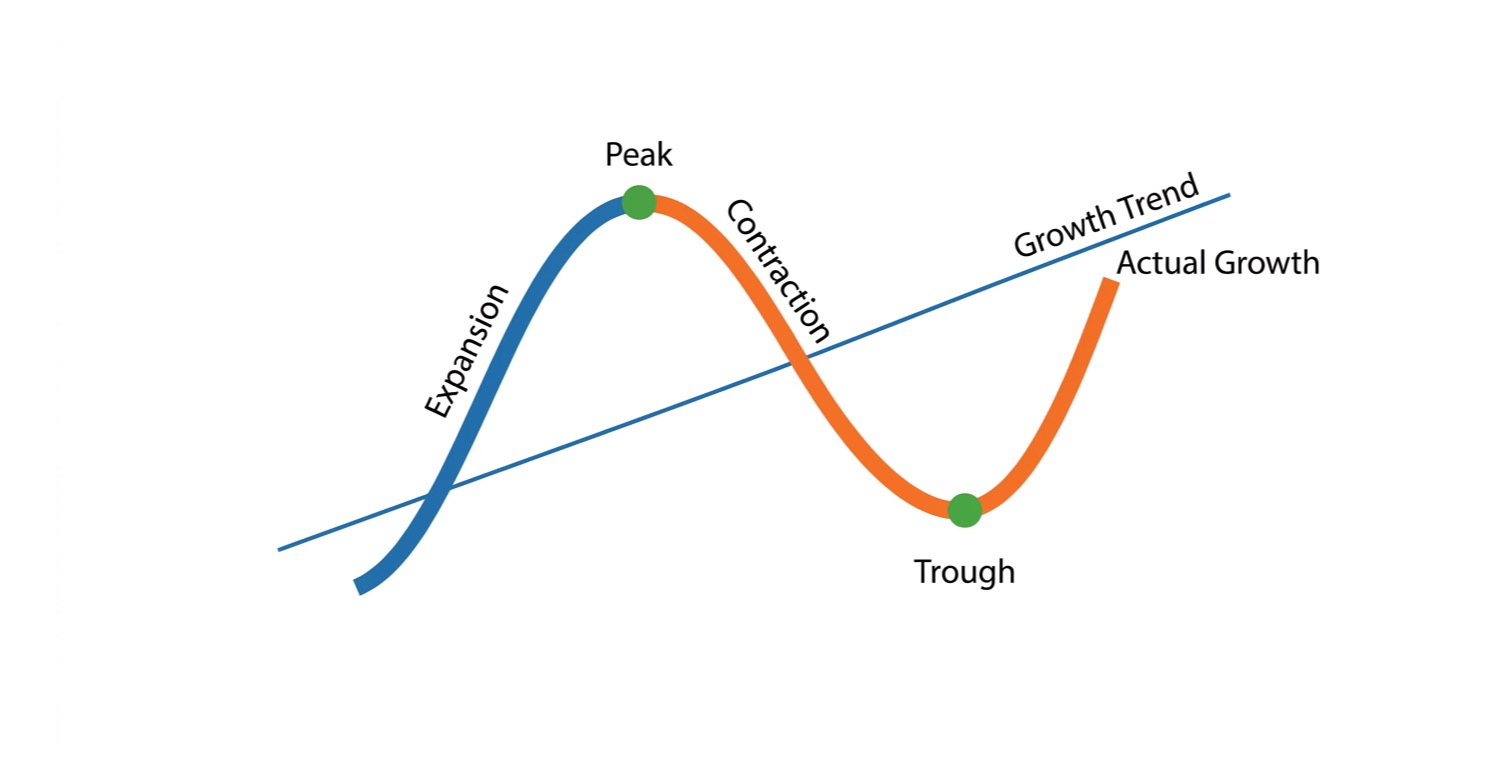
A market cycle is the recurring pattern of expansion and contraction in economic activity — GDP, employment, credit, corporate earnings — that repeats over multi-year periods. It is not a fixed-length clock; cycles can run 3 years or 12. What's consistent is the sequence: recovery → expansion → peak → contraction → trough → recovery again.
Two important distinctions to keep separate, because they don't move in lockstep:
- The economic cycle — GDP growth, employment, industrial production, credit conditions.
- The market cycle — equity prices, credit spreads, yield curves. Markets are forward-discounting mechanisms, so they typically lead the economy by 6–12 months. Stocks bottom before recessions end and top before recessions begin.
The reason this framework is useful for trading and allocation is simple: different sectors and asset classes have structurally different sensitivities to growth, inflation, and interest rates. As the macro backdrop shifts, capital rotates toward whatever the current environment rewards. This is "sector rotation," and it's one of the most persistent, well-documented patterns in markets — used by every major institutional asset allocator (Fidelity, State Street, S&P, Goldman Sachs) as a core positioning framework.
2. The Four Phases of the Business Cycle
The most widely used institutional model (Fidelity's Business Cycle Framework, and similar versions from State Street and NDR) splits the cycle into four phases, defined by the rate of change of economic growth (accelerating vs. decelerating) combined with the absolute level of activity (above or below trend).
Phase 1 — Early Cycle (Recovery)
- Where we are: Economy just exited recession. Growth is accelerating off a low base.
- Inflation: Low, often still falling.
- Fed policy: Accommodative — rates low or being cut, liquidity abundant.
- Yield curve: Steep (short rates low, long rates rising on growth optimism).
- Credit: Spreads compressing sharply as default fear recedes.
- Character: This is the highest-beta, highest-reward phase. Economically sensitive ("cyclical") assets post their best returns of the entire cycle, because they were priced for disaster and are now recovering off deeply depressed multiples.
Phase 2 — Mid Cycle (Expansion)
- Where we are: Growth is positive and broadening, but decelerating from the early-cycle sprint to a steadier, more moderate pace. This is usually the longest phase of the cycle.
- Inflation: Starting to firm as slack in the economy is absorbed.
- Fed policy: Shifts from accommodative toward neutral; the tightening cycle typically begins here.
- Yield curve: Begins to flatten.
- Credit: Spreads stabilize at tight levels.
- Character: Broad market participation, earnings growth is the primary driver (rather than multiple expansion), and leadership becomes less about "everything cyclical" and more selective.
Phase 3 — Late Cycle (Peak/Maturity)
- Where we are: Growth is still positive but decelerating toward trend or below; the expansion is mature.
- Inflation: Elevated, often the highest of the cycle, as capacity constraints bind (labor shortages, tight capacity utilization).
- Fed policy: Restrictive — rates high, sometimes still hiking into slowing growth (the classic "policy mistake" risk window).
- Yield curve: Flat or inverted (short rates above long rates) — the market's clearest recession warning signal.
- Credit: Spreads begin to widen as investors price rising default risk.
- Character: Volatility rises. Defensive positioning starts outperforming even while the index can still make new highs — late-cycle rallies are often narrow and led by pricing power / quality rather than cyclicality.
Phase 4 — Recession (Contraction)
- Where we are: Growth outright negative or sharply below trend; NBER-style broad-based decline across output, employment, income, sales.
- Inflation: Falling (demand destruction), unless it's a supply-shock recession.
- Fed policy: Shifts to easing — cuts begin, often aggressively once labor cracks.
- Yield curve: Steepens again as the curve "un-inverts" — historically this steepening, not the inversion itself, is the closer marker of imminent recession onset.
- Credit: Spreads widen sharply; this is where credit stress and equity drawdowns are most correlated.
- Character: Defensive assets outperform. Equities typically bottom before the recession officially ends, once the market starts discounting the next recovery.
Two caveats institutions always attach to this model: phases have no fixed duration, and cycles don't always progress in clean chronological order — you can get "rolling" mid-cycle resets without a full recession (this happened in 2022–2023 in parts of the US economy).
3. Sector Rotation: What Leads in Each Phase
This is the classic "sector clock," built from decades of relative-performance data (this specific version reflects the widely cited Fidelity/S&P sector cycle studies).
Early Cycle — Cyclicals and Financials Lead
- Financials (banks, regional banks): Steep yield curve = wide net interest margins; credit losses are falling from recession peak; loan growth resumes.
- Consumer Discretionary: Pent-up demand releases; consumer confidence and employment inflecting up.
- Industrials / Small Caps: Operating leverage is highest here — small revenue increases flow disproportionately to earnings after cost-cutting during the recession; small caps are highest-beta to domestic growth.
- Real Estate / Homebuilders: Falling/low rates + pent-up household formation.
Mid Cycle — Technology and Broad Cyclicals
- Technology: Capex cycle resumes as corporates gain confidence; earnings growth (not multiple expansion) becomes the driver, and tech typically has the highest structural earnings growth.
- Industrials: Broadening capital investment, order backlogs building.
- Communication Services: Advertising and consumer spending normalize.
- Consumer Discretionary (select): Still positive but less dominant than early cycle as the "surprise" element fades.
Late Cycle — Inflation Hedges and Pricing Power
- Energy: Tight capacity, strong demand, inflation running hot — energy is the classic late-cycle outperformer as commodity prices spike.
- Materials: Same commodity/inflation dynamic; input costs are rising and passed through.
- Healthcare: Defensive characteristics start to matter again; inelastic demand.
- Consumer Staples: Pricing power on necessities becomes valuable as discretionary spending slows.
Recession — Defensives and Bonds
- Utilities: Bond-proxy characteristics, regulated/inelastic demand, benefits from falling rates.
- Consumer Staples: Non-discretionary demand holds up regardless of the cycle.
- Healthcare: Inelastic demand persists through downturns.
- Long-duration Treasuries: Flight to quality + Fed cutting rates = bond prices rally hardest here.
4. Where the Money Actually Flows — Cross-Asset View
Sector rotation inside equities is only one layer. The bigger, cross-asset flow-of-funds picture looks like this:
Early Cycle
- Flow: out of cash/bonds → into equities (especially small-cap/cyclical) and credit (especially high yield)
- High yield spreads compress fastest here — it's the highest-returning fixed income asset class of the whole cycle.
- Commodities begin bottoming as demand expectations improve, but often lag equities.
- Currency: risk-on flows tend to favor higher-beta, commodity-linked, and emerging-market currencies as global risk appetite returns.
Mid Cycle
- Flow: broad participation — equities remain the preferred asset class, but flows within equities rotate from small/value cyclicals toward large-cap growth and quality as the "easy" recovery trade matures.
- Investment-grade credit still attractive; high yield spreads stabilize near cycle-tight levels.
- Real assets (commodities, real estate) participate as capacity utilization rises.
Late Cycle
- Flow: equities → commodities / real assets / inflation-protected securities (TIPS).
- Gold typically starts to work here as a hedge against both inflation and the eventual policy-mistake/recession risk.
- Credit spreads bottom and begin widening — smart money starts de-risking credit books before equities top.
- Cash allocations begin rising (yields are attractive with high policy rates, and it's optionality for the drawdown ahead).
- The yield curve inversion itself represents capital preferring the safety and yield-lock-in of long-duration bonds even at yields below short rates — a direct signal of demand for future rate cuts.
Recession
- Flow: risk assets → government bonds (especially long duration) and cash, then, ahead of the trough, back into equities as markets start pricing the next recovery.
- Gold tends to perform well into and through the early part of recessions.
- Credit spreads peak (maximum stress) typically coincident with or slightly before the equity market bottom.
- The US Dollar frequently strengthens in the acute phase of a global recession/deleveraging (flight to the world's reserve funding currency), even though the Fed is cutting — this is a common source of confusion, since intuitively "Fed cutting" should weaken the dollar, but global demand for dollar liquidity in a deleveraging event dominates.
5. The Indicators That Tell You Where You Are
- Yield curve (10Y–2Y or 10Y–3M)
- What to watch: Inversion, then re-steepening
- Signal: Inversion = late cycle warning; re-steepening after inversion = recession imminent/underway
- ISM Manufacturing PMI
- What to watch: Above/below 50
- Signal: Below 50 and falling = contraction; troughing and turning up = early cycle
- Credit spreads (HY OAS)
- What to watch: Direction of change
- Signal: Widening = late cycle/recession; tightening = early/mid cycle
- Conference Board LEI
- What to watch: 6-month annualized rate, diffusion index
- Signal: Persistent decline below threshold historically precedes recession by ~7 months
- Initial jobless claims
- What to watch: Trend, not level
- Signal: Sustained upturn from a low base is one of the most reliable early recession signals
- Fed policy stance
- What to watch: Hiking vs. cutting, real rates
- Signal: Restrictive real rates = late cycle; first cut = transition signal (though the first cut can occur either as "mid-cycle insurance" or as recession onset — context matters)
- Copper/Gold ratio
- What to watch: Directional trend
- Signal: Rising = growth optimism (early/mid); falling = defensive/late-cycle positioning
No single indicator is reliable alone — institutions triangulate across growth, inflation, credit, and labor data simultaneously.
6. Where We Are Right Now (August 2026) — A Live Case Study
As of early August 2026, the data paints a genuinely mixed picture — useful precisely because it shows how messy real-time cycle-reading is compared to the clean textbook phases:
- Growth: Real GDP is running near trend (~2% annualized), with Q2 2026 growth of roughly 1.5% annualized but firming underlying private demand — consumer spending and business investment both accelerating.
- Inflation/Fed: Notably, forecasters are pricing a possible 25bp hike in September 2026 rather than a cut — an unusual, late-cycle-esque signal, though it's being characterized as an incremental adjustment rather than a new tightening campaign.
- Labor market: This is the most fragile piece of the picture. Hiring has slowed and unemployment risk is seen as more elevated than at any point in this expansion, even though layoffs remain historically low (a "low-hire, low-fire" labor market) — an atypical pattern that has made this cycle unusually difficult to date using historical rules of thumb (e.g., the Sahm Rule).
- Leading indicators: The Conference Board's Coincident Index has continued expanding through H1 2026, and the Lagging Index turned positive again in H1 — not signals typically associated with imminent recession.
- Cross-currents: Tariff-driven cost pressure is fading as supply chains adapt, new tax incentives are expected to boost both consumer and business balance sheets, and AI-related capex continues to be a major independent growth driver — but AI-valuation-bubble concern is one of the most cited macro risks for the back half of 2026.
Read-through: This looks most like a mid-to-late-cycle economy — growth near trend, labor market cooling but not breaking, inflation sticky enough that the Fed is debating a hike rather than cuts, and structural risk concentrated in two places: the labor market's fragility and AI-capex valuation risk. It is not a classic late-cycle picture (there's no yield curve inversion currently signaling imminent recession, and coincident data is still expanding), but it's also well past "early cycle" — this is a mature expansion with idiosyncratic support from AI infrastructure spending and fiscal tailwinds.
For a systematic framework like your Oracle Model, this kind of "textbook doesn't quite fit" environment is exactly where relying on a single macro regime label breaks down — it argues for weighting the labor-market trend data (claims, hiring rate) and credit spread behavior more heavily than the curve shape alone, since curve shape is currently a weak/absent signal in a cycle where the Fed itself is uncertain about direction.
7. Practical Framework Summary
- Early Phase:
- Best Equity Sectors: Financials, Discretionary, Industrials, Small Caps
- Best Asset Classes: Equities, High Yield Credit
- Fed Stance: Accommodative
- Curve Shape: Steep
- Mid Phase:
- Best Equity Sectors: Technology, Industrials, Communication Services
- Best Asset Classes: Equities (broad), IG Credit
- Fed Stance: Neutral → Tightening
- Curve Shape: Flattening
- Late Phase:
- Best Equity Sectors: Energy, Materials, Healthcare, Staples
- Best Asset Classes: Commodities, TIPS, Gold, Cash
- Fed Stance: Restrictive
- Curve Shape: Flat/Inverted
- Recession:
- Best Equity Sectors: Utilities, Staples, Healthcare
- Best Asset Classes: Long Treasuries, Gold, Cash
- Fed Stance: Easing
- Curve Shape: Inverted → Re-steepening
Core takeaway: the money doesn't disappear during a downturn — it rotates. Understanding which phase you're in, using a triangulation of growth, inflation, credit, and labor data rather than any single indicator, is what lets capital (and a systematic model) get ahead of the rotation rather than reacting to it after the sector leadership has already changed.
Note: This is a general macro/educational framework, not investment advice. Cycle phases are historical tendencies, not guarantees — every cycle has idiosyncratic drivers (in this case, AI capex and an unusually resilient low-hire/low-fire labor market) that can distort the textbook pattern.