The Money Flow Index (MFI) is a volume-weighted oscillator that blends price and volume to show where real buying or selling pressure is building. By comparing positive vs. negative money flow from the Typical Price and volume, MFI acts like a volume-aware RSI.
Traders use it to spot overbought/oversold zones, confirm trend regimes, and catch divergences that often precede reversals. It’s simple, fast, and works across stocks, crypto, and FX—best used with a clear market structure and disciplined risk management.
1. Why is MFI Important in Trading?
MFI blends price and volume into a single oscillator, helping you spot exhaustion, confirm trends, and catch divergences earlier than price-only tools. Think of it as a volume-weighted RSI that validates whether a move is backed by real participation.
- Captures “true” buying/selling pressure via volume.
- Flags overbought/oversold zones more selectively than RSI.
- Great for divergences, regime reads, and pullback timing.
2. MFI Components
Let’s outline the moving parts you’ll work with:
- Typical Price (TP): (High + Low + Close) / 3
- Raw Money Flow (RMF): TP × Volume
- Positive/Negative MF: Sum RMF on up-TP vs down-TP bars
- Money Flow Ratio (MFR): PMF / NMF
- MFI Line (0–100): RSI-style transform of MFR
- Default length: 14 (common, tweakable)
3. The MFI Formula
Understanding the math helps you verify your platform's calculations. Here is a Pine Script representation of the MFI logic:
//@version=5
// Formula sketch
TP_t  = (high + low + close) / 3
RMF_t = TP_t * volume

// Over N bars:
PMF = sum( RMF_t where TP_t  > TP_{t-1} )
NMF = sum( RMF_t where TP_t  < TP_{t-1} )
// If TP_t == TP_{t-1}, ignore bar

MFR = PMF / NMF
MFI = 100 - (100 / (1 + MFR))
4. Interpreting MFI Signals
Reading the MFI line requires looking at specific zones and patterns.
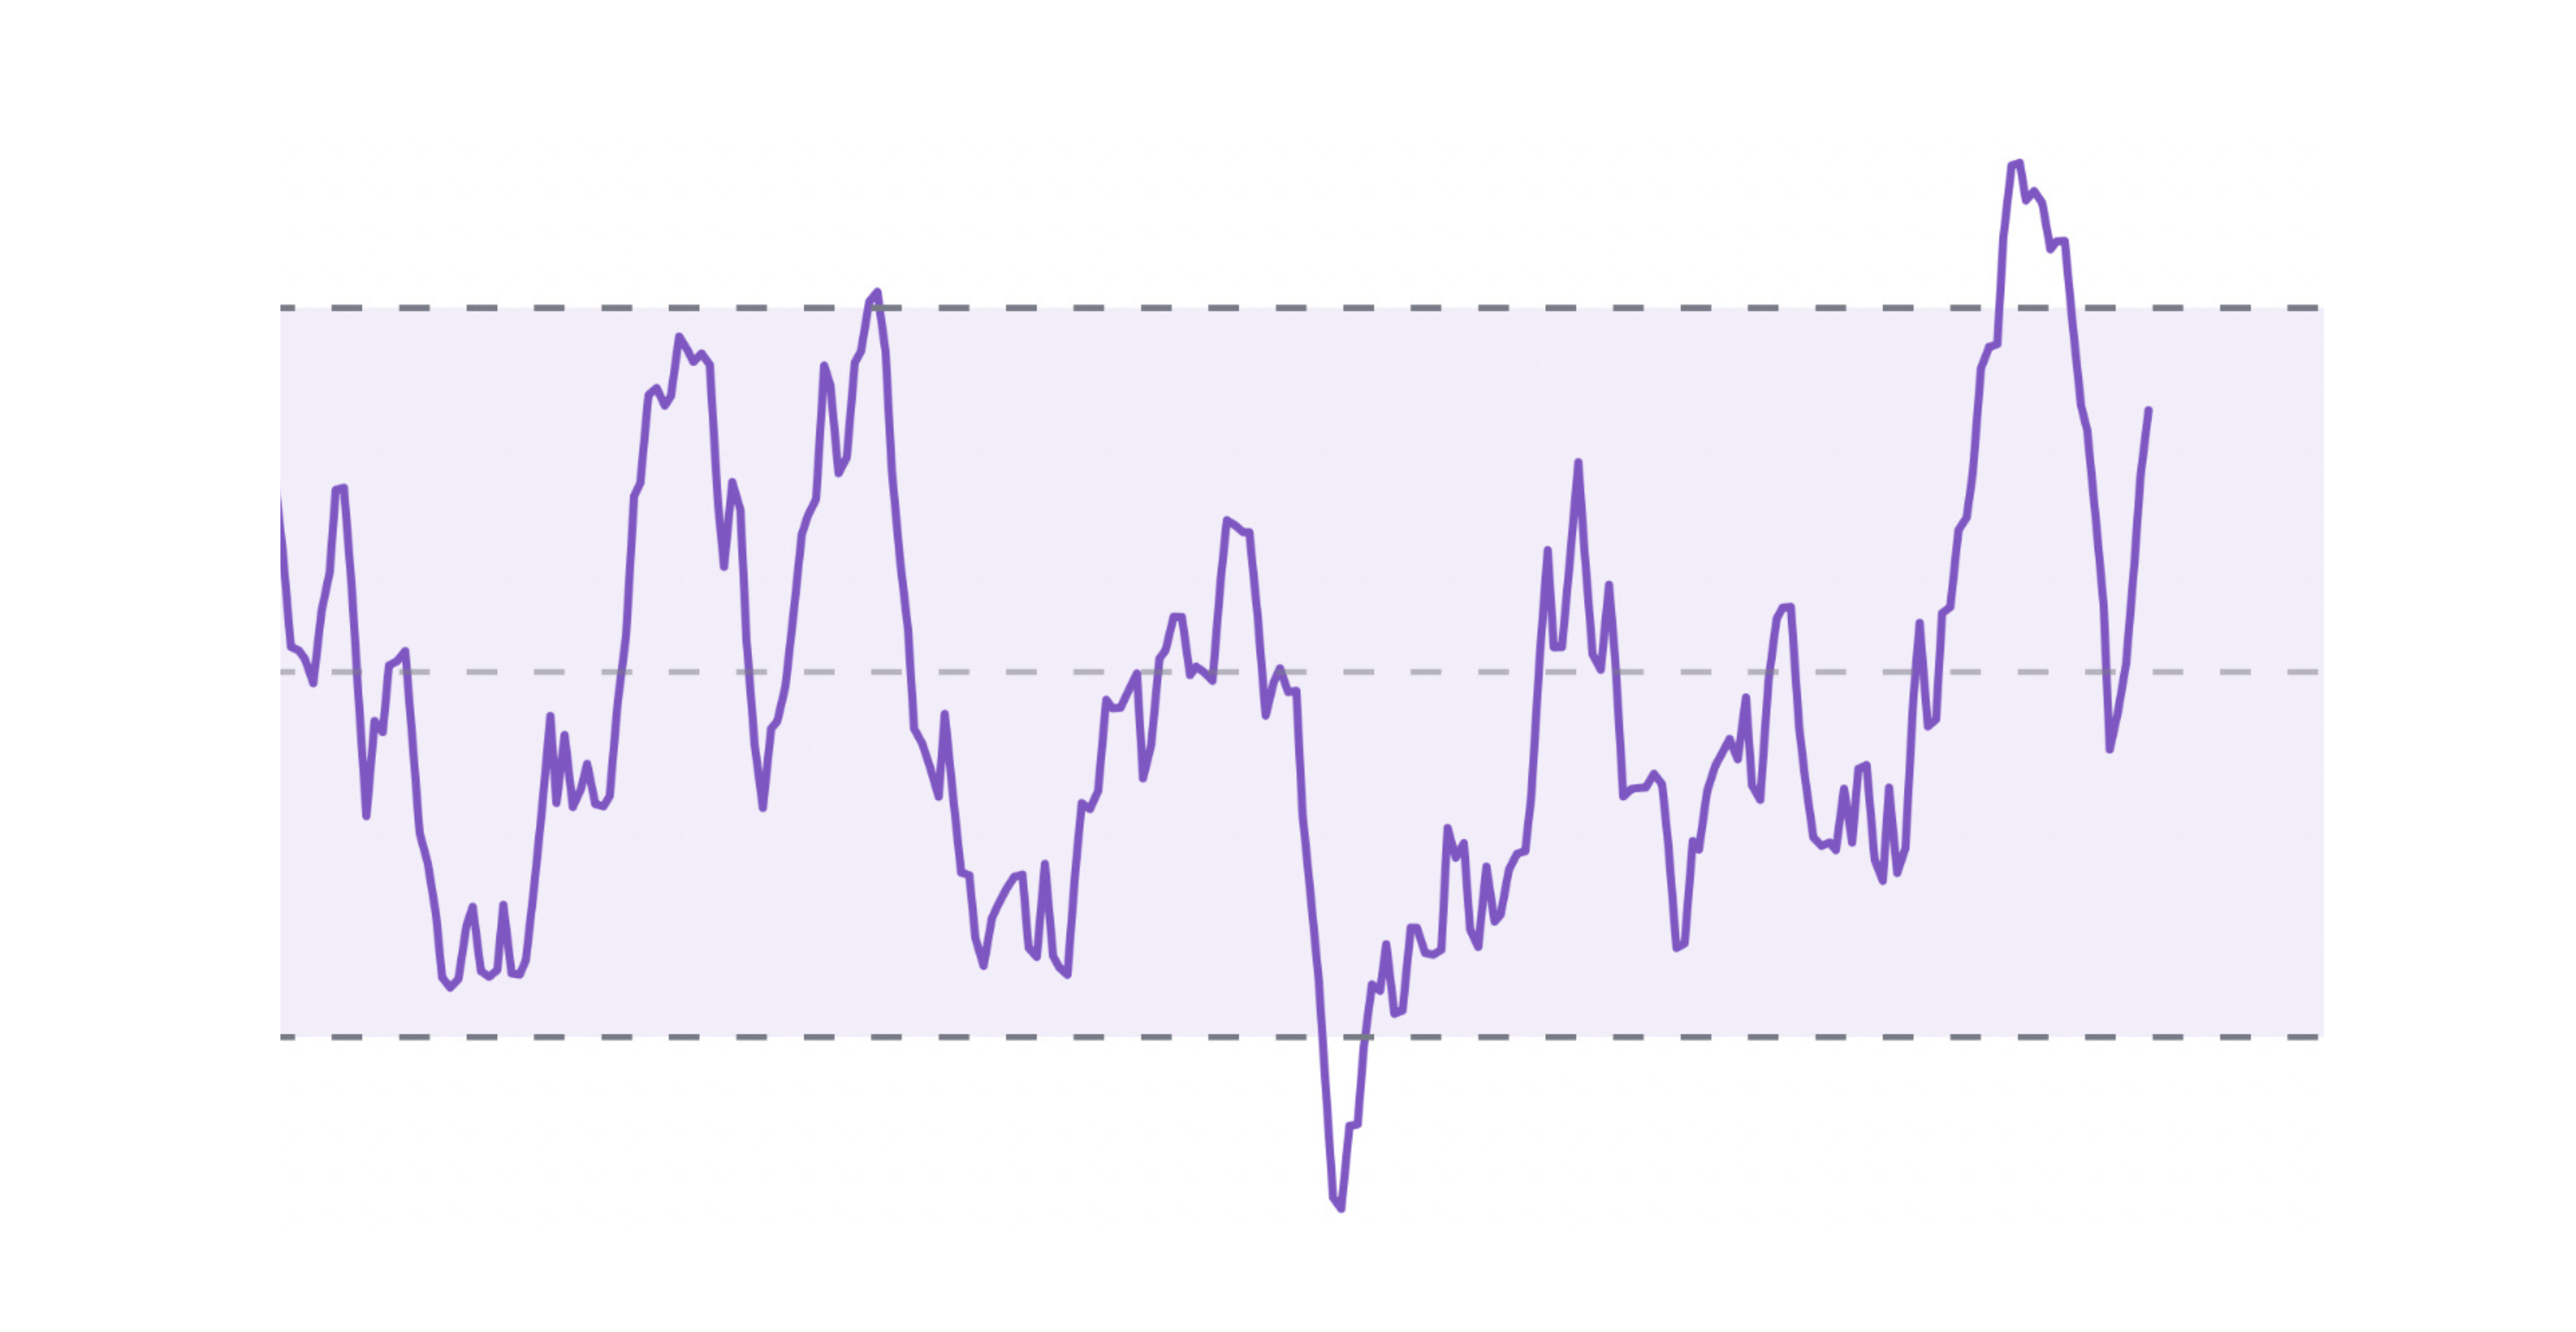
- Zones: Overbought > 80 (extreme > 90), Oversold < 20 (extreme < 10).
- Divergences:
- Bearish: Price makes a Higher High while MFI makes a Lower High.
- Bullish: Price makes a Lower Low while MFI makes a Higher Low.
- Midline/Regimes: Above 50 favors bulls; below 50 favors bears.
- Failure Swings: When MFI enters an overbought zone, pulls back, and then makes a lower high while price retests its peak, caution is warranted.
Example of MFI overbought and oversold zones.
MFI Zones and Signals
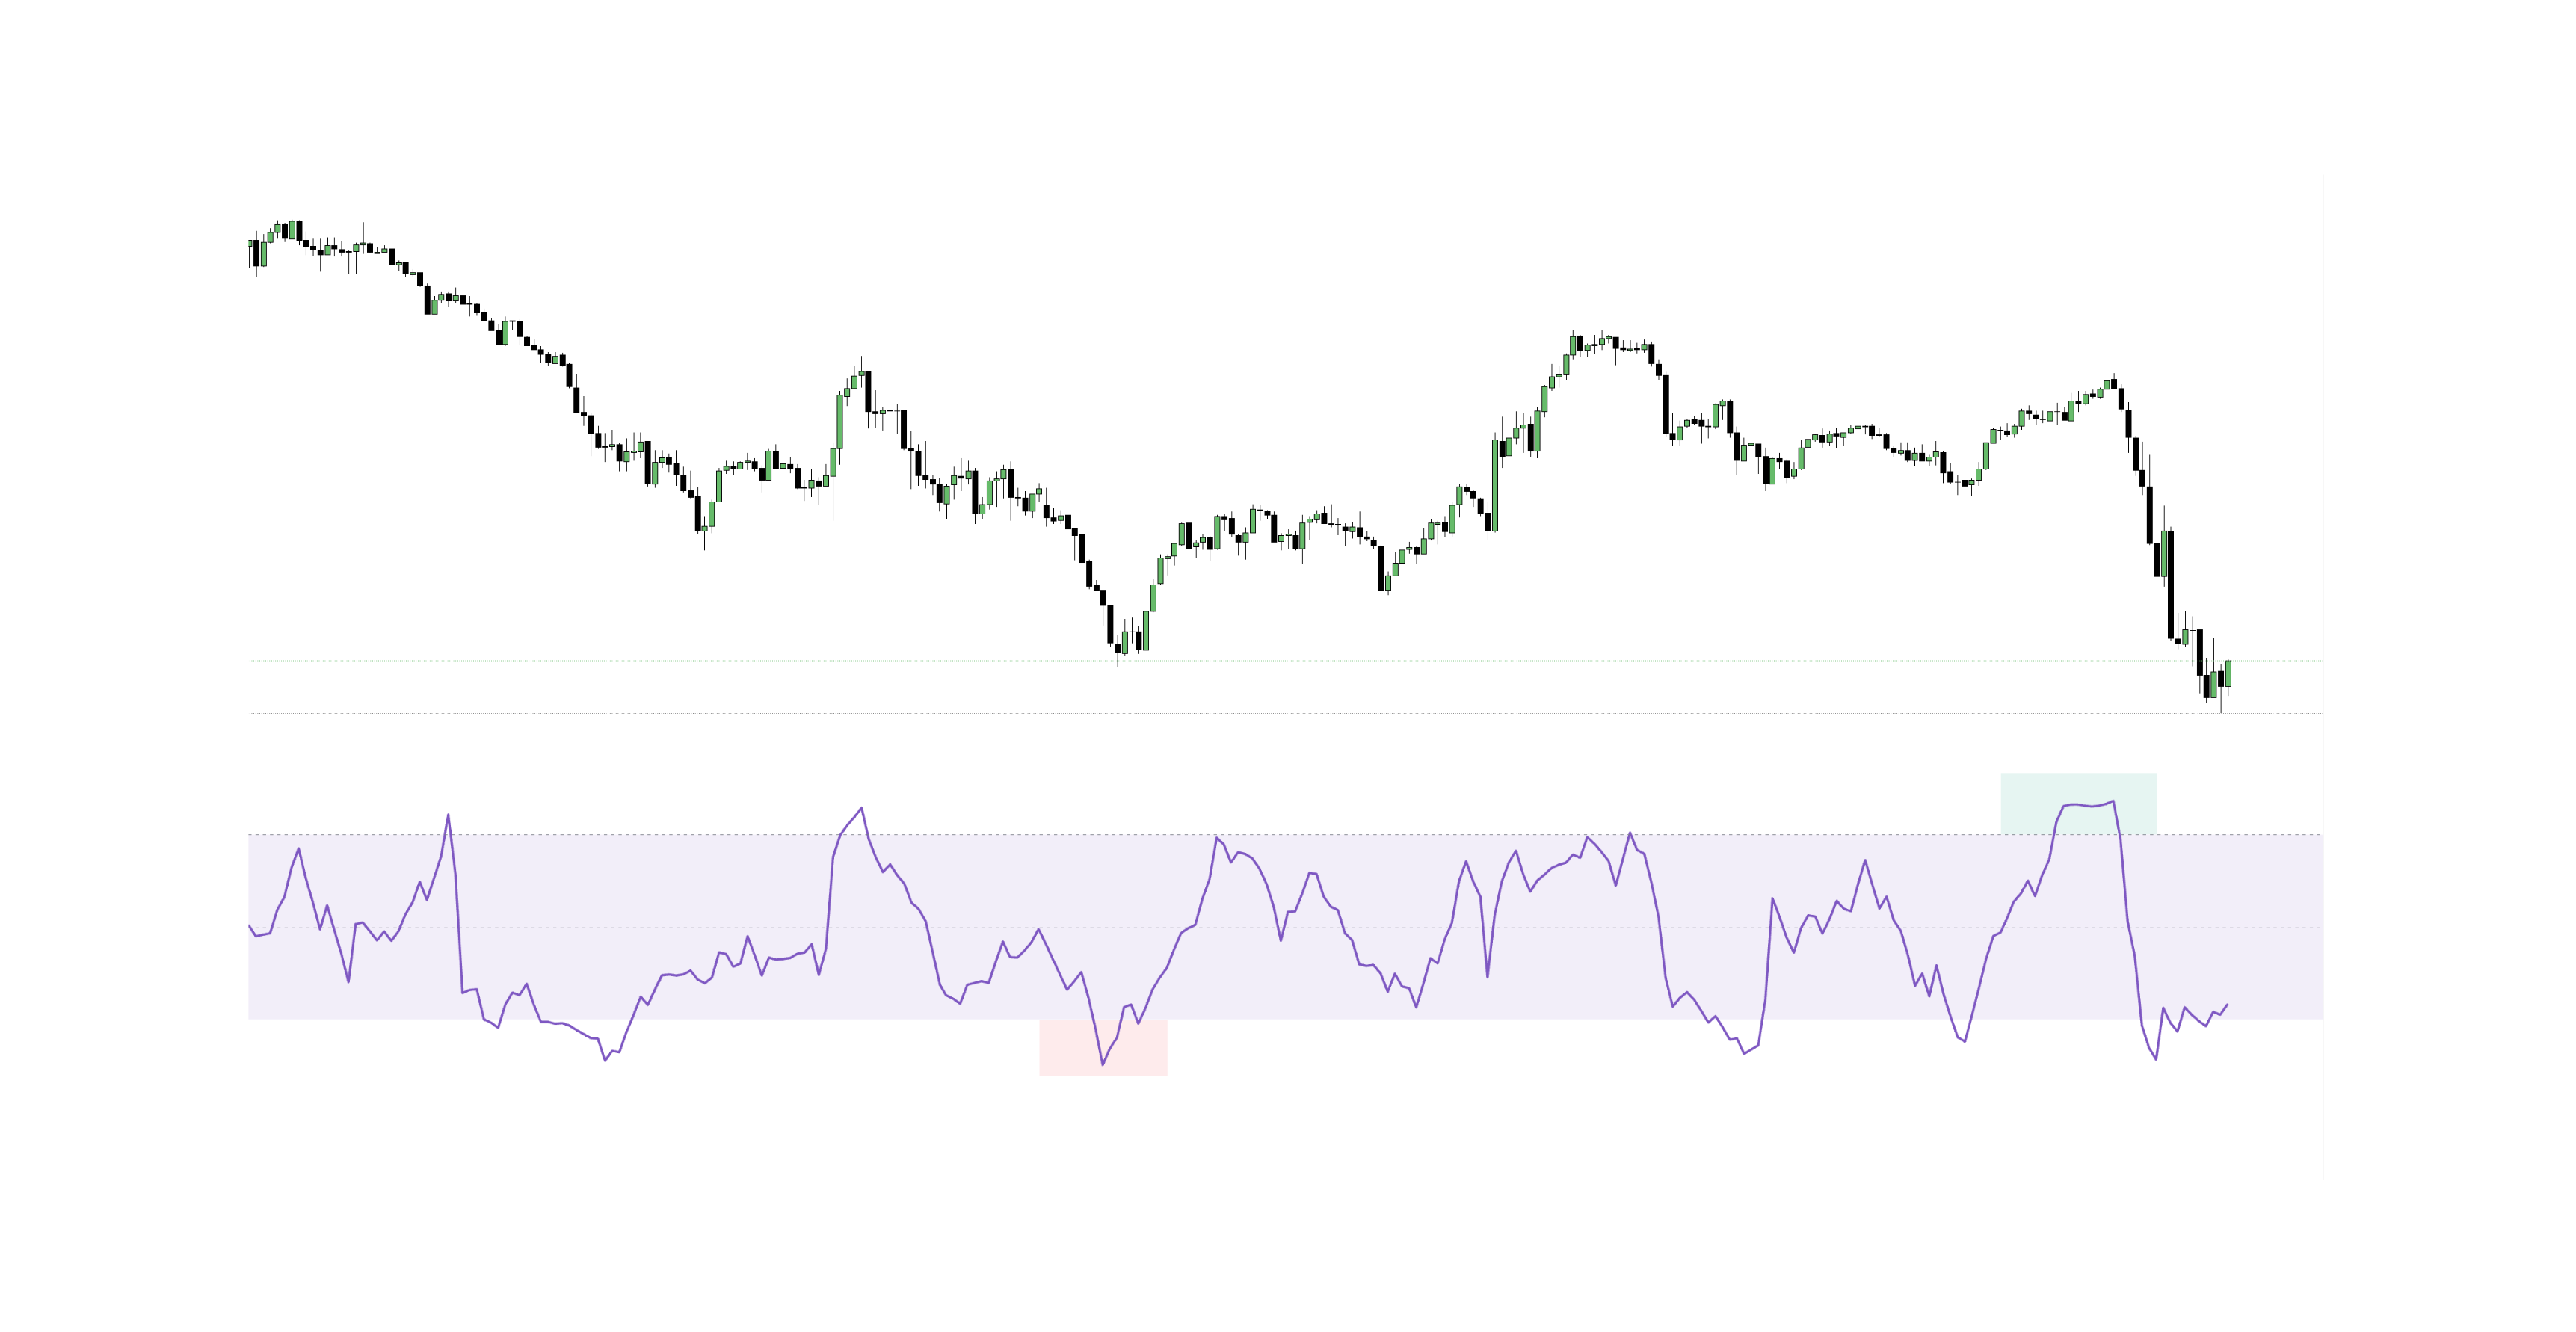
Visualizing bullish and bearish divergences with MFI.
MFI Divergence Example
5. Trend & Momentum Analysis
Use MFI to confirm trend strength and quality.
- Bullish Ranges: In strong uptrends, MFI often oscillates between 40–90, with the 50 line frequently holding as support on dips.
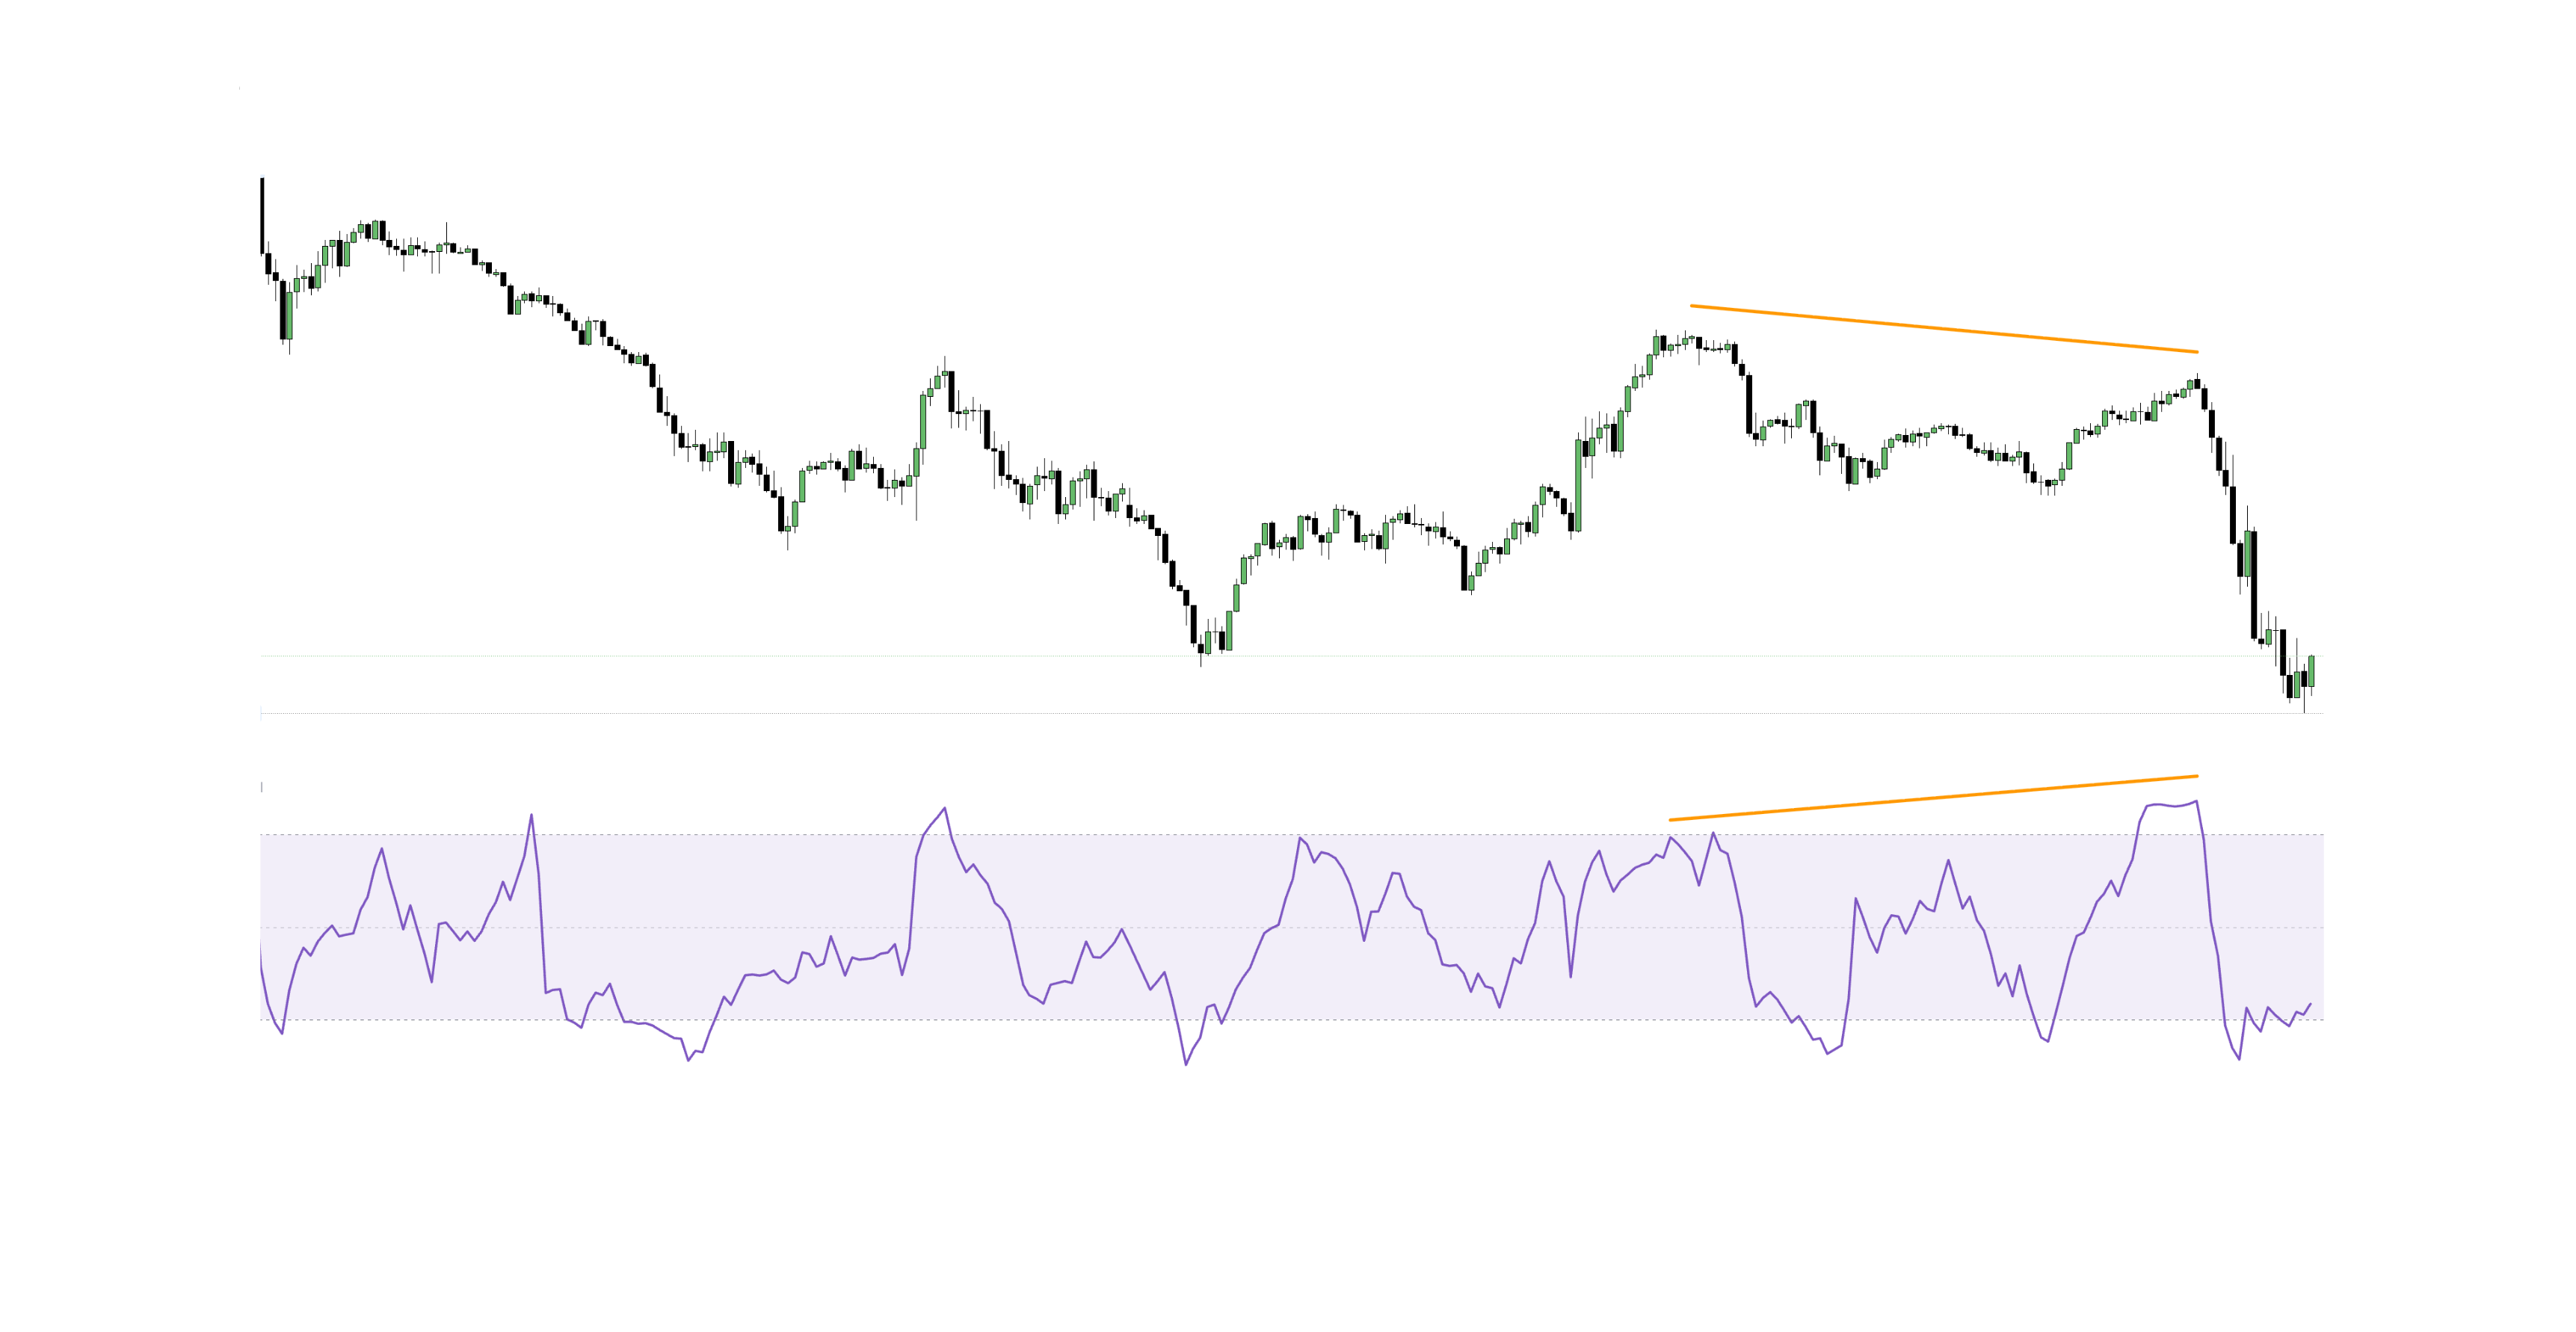
- Bearish Ranges: In downtrends, MFI typically oscillates between 10–60, with rallies often stalling near the 50–60 area.
- Momentum Bursts: Fast pushes into the 80–90 range after a period of consolidation often precede powerful breakouts.
- Multi-Timeframe: Align your higher-TF MFI regime (e.g., 1D) with your lower-TF entries (e.g., 1H) for higher probability setups.
MFI Bullish Trend
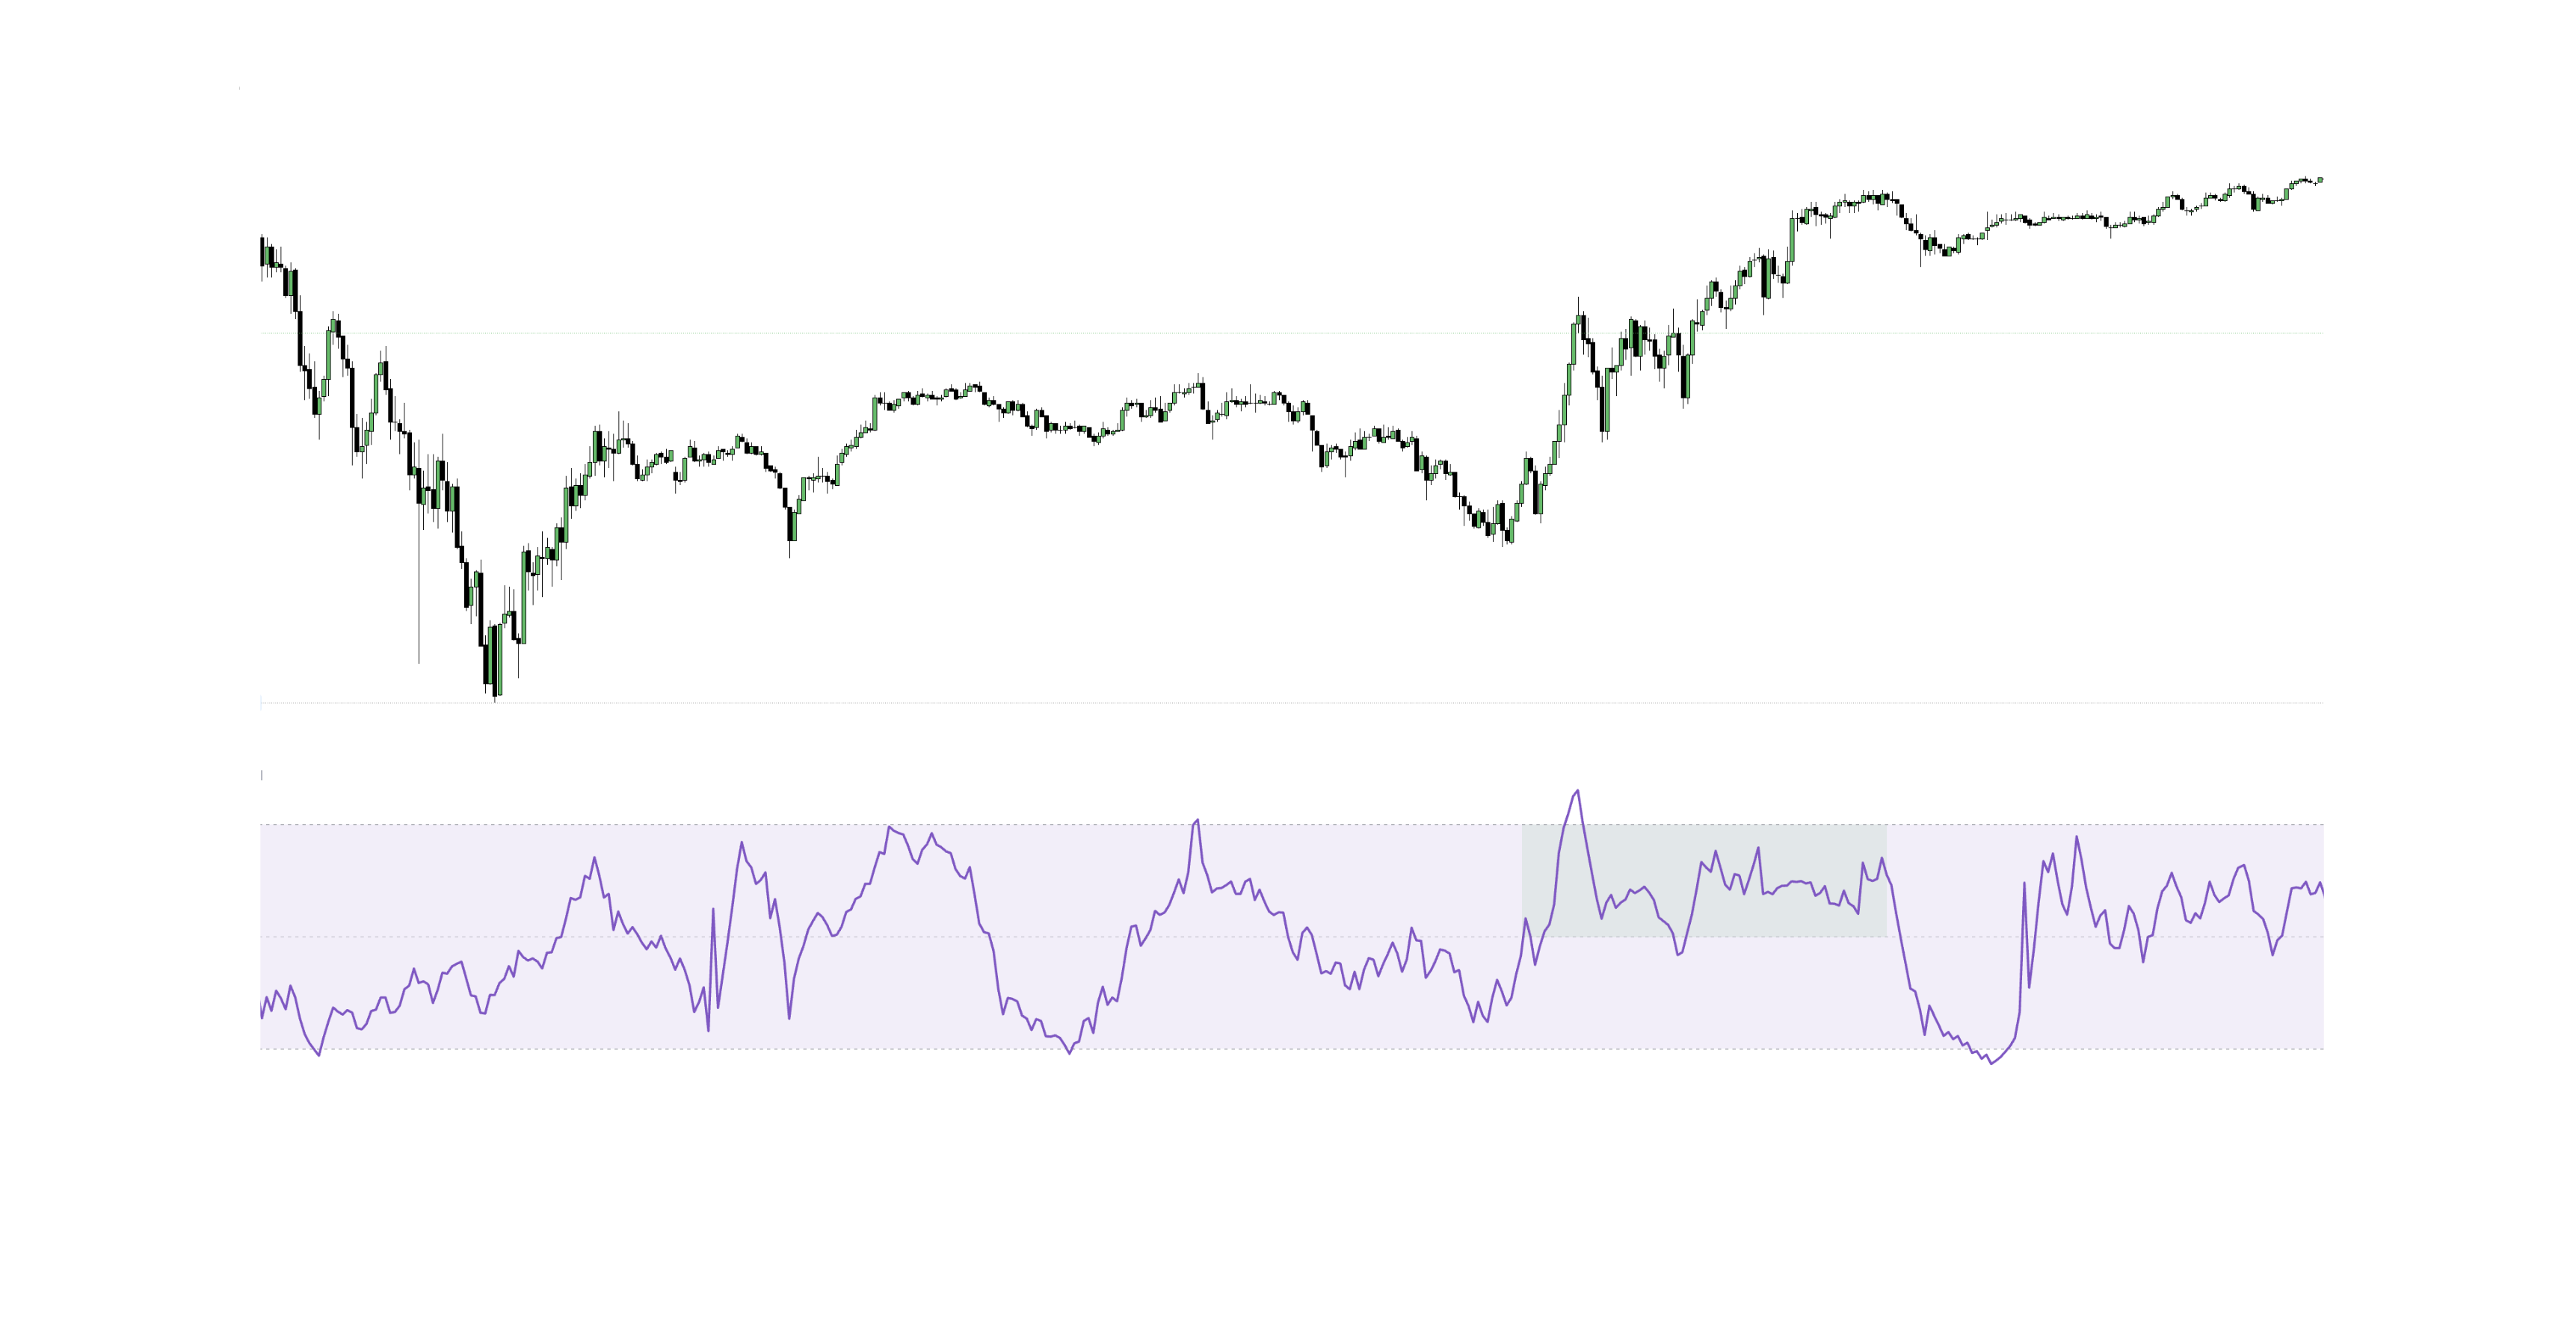
MFI behavior during a sustained bullish trend.
MFI Bearish Trend
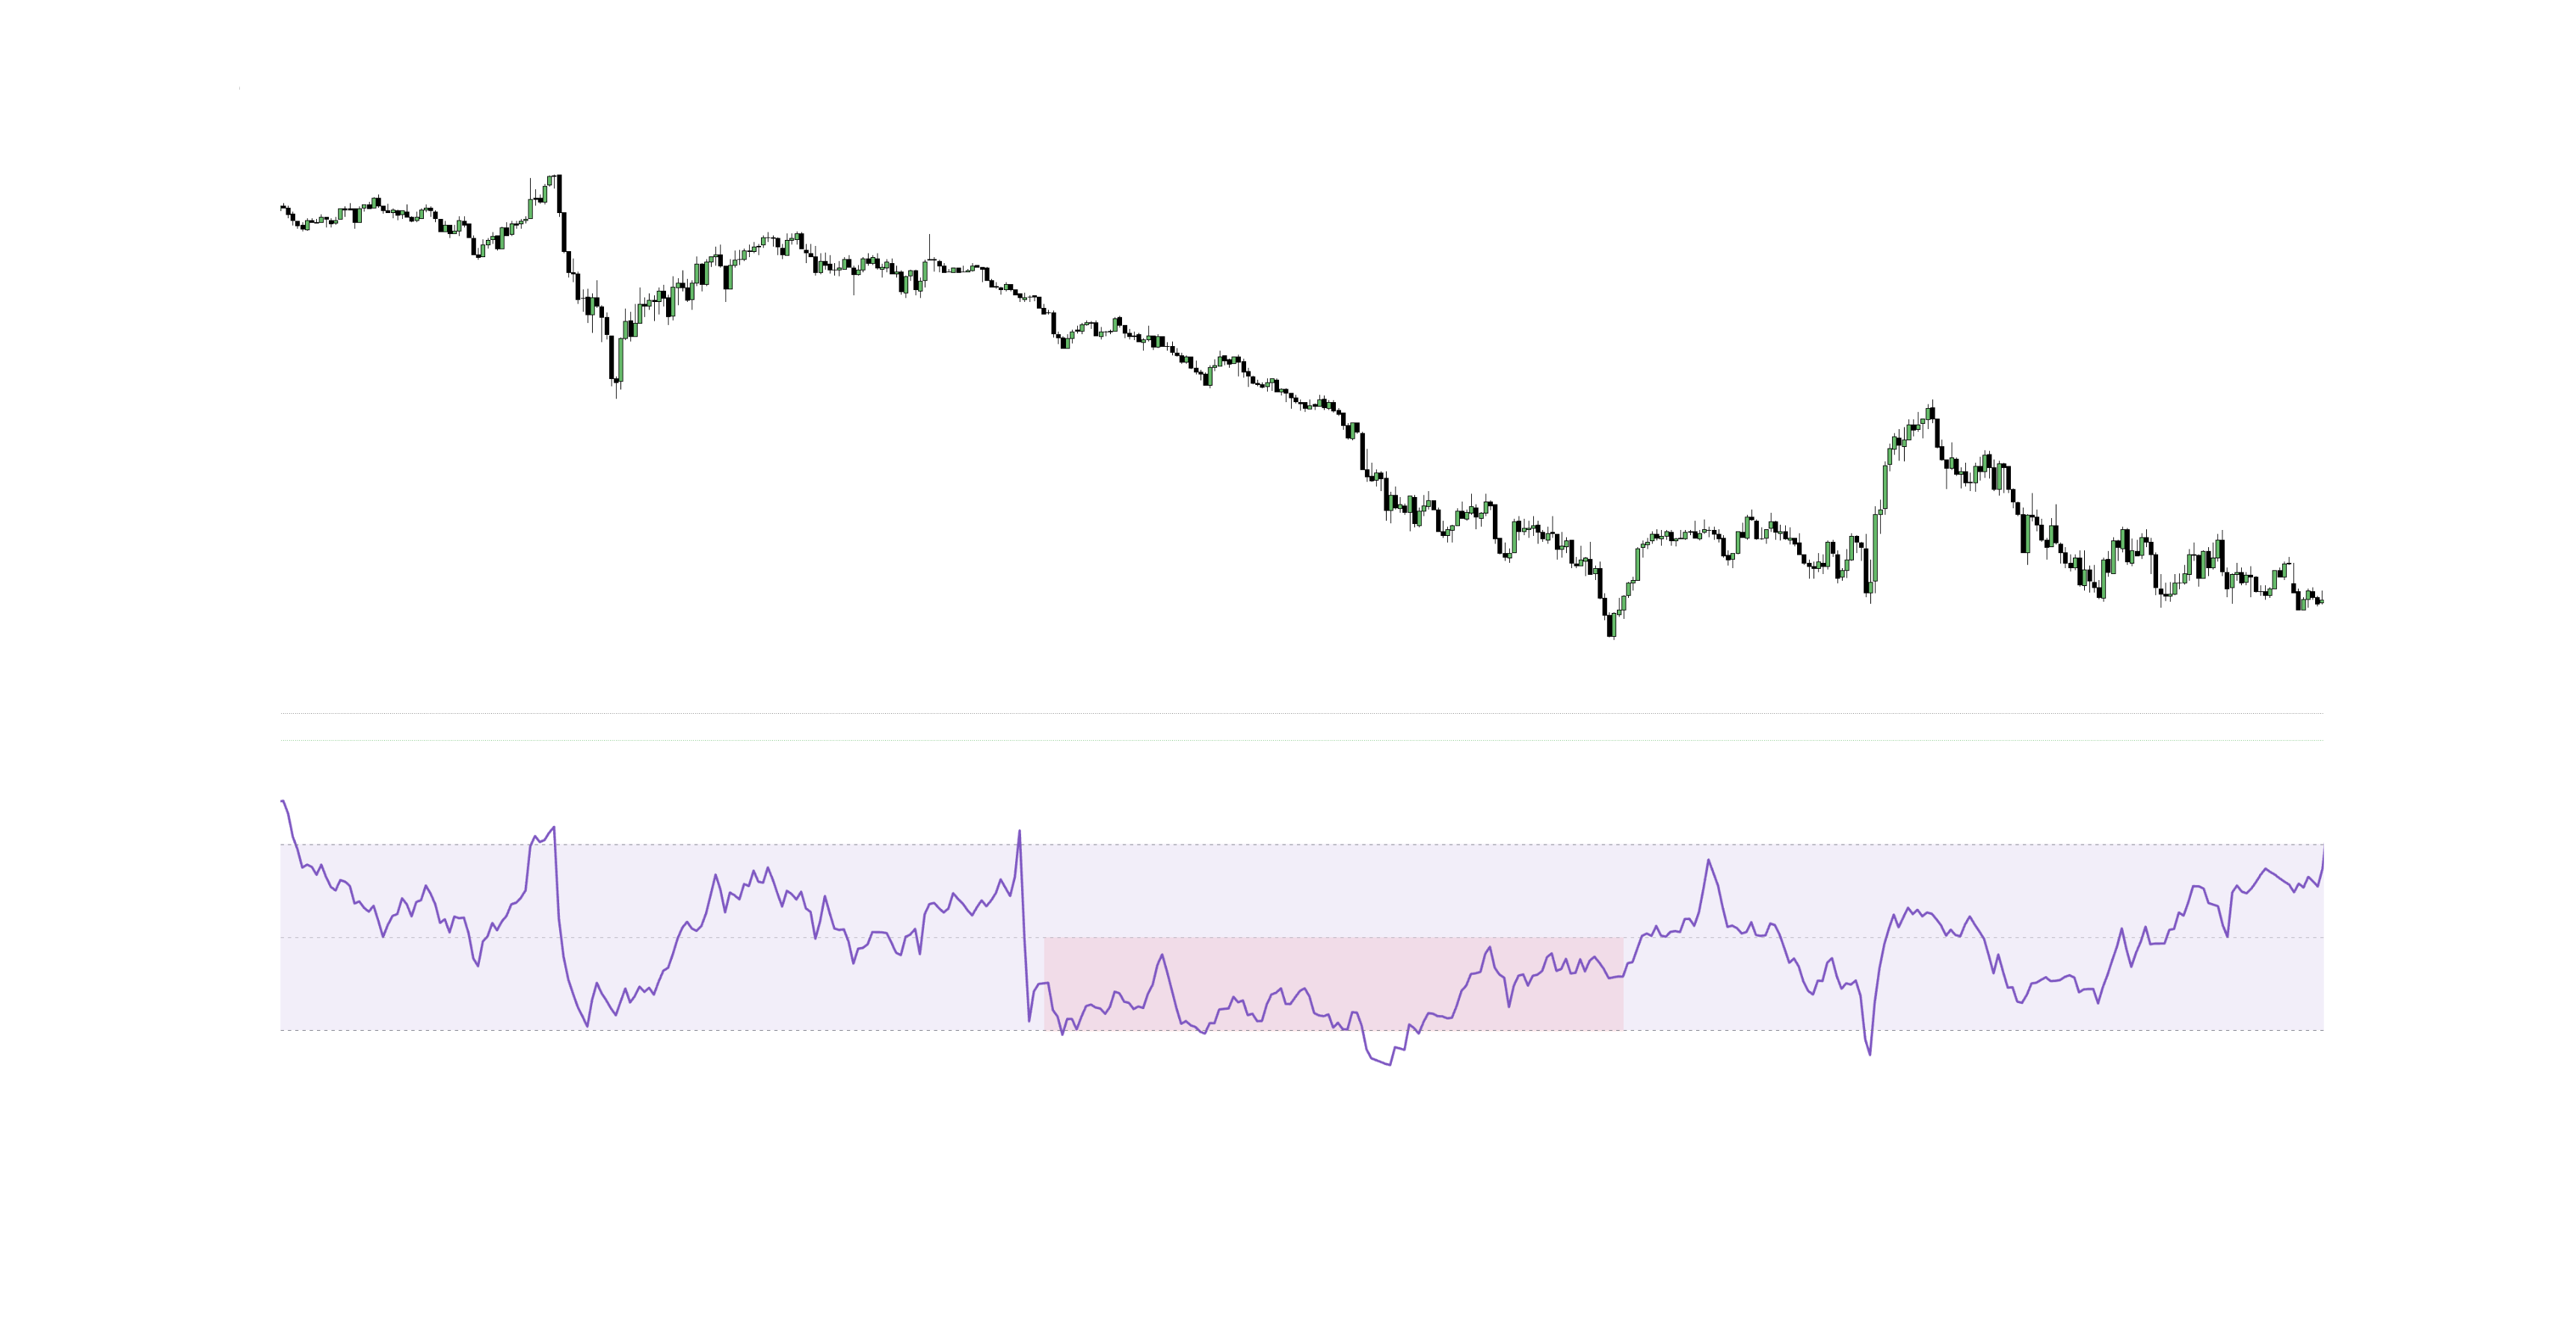
MFI behavior during a sustained bearish trend.
6. MFI-Based Trading Strategies
A) Mean Reversion (Counter-Trend)
- Entry: MFI < 20 followed by a bullish reversal candle or a break of a minor swing high.
- Invalidation: Below the setup candle’s low or the last swing low.
- Exits: MFI returning to the 50–60 zone, or a retest of VWAP/mid-channel.
B) Breakout Confirmation
- Precondition: Sideways range with contracting volatility.
- Trigger: Price closes outside the range AND MFI > 55–60 (or a sharp spike > 80).
- Exits: Trail stops behind structure or ATR; take partials at the measured move of the range.
C) Trend Pullback Buy
- Context: An established uptrend with MFI mostly staying above 50.
- Entry: A pullback drives MFI into the 40–50 area, followed by a curl back up; enter on a higher high close.
- Exits: Prior high, Fibonacci extensions, or when MFI loses the 50 level again.
D) Divergence Reversal
- Trigger: A clear price/MFI divergence combined with a break of a micro trendline or the last swing.
- Risk: Tight stop placed just past the origin of the divergence.
- Targets: Midline 50 as the first target, then the opposing extreme (80 or 20).
Confluence Tip: Pair MFI with RSI, OBV, Bollinger Bands, or Volume Profile for better accuracy.
7. Limitations & Optimization
Know the Limitations
- Pinned Extremes: In very strong trends, MFI can stay overbought or oversold for a long time.
- Volume Quality: The quality of volume data varies (tick volume vs. centralized exchange volume).
- Parameter Sensitivity: A length that is too short creates noise; one that is too long creates lag.
Smart Tweaks for Live Markets
- Dynamic Zones: Replace fixed 80/20 levels with rolling percentiles (e.g., the 90th and 10th percentiles of the last 252 bars).
- Adaptive Length: Tie MFI length to volatility (ATR) to reduce whipsaws in choppy markets.
- Session Filters: Only take signals during liquid market sessions (avoid lunch hours or illiquid opens).
- Walk-Forward Testing: Validate your settings across different market regimes to avoid overfitting.
9. Key Takeaways
- MFI is a volume-aware oscillator that improves on RSI in participation-heavy moves.
- Use the 50 line as a regime filter and 80/20 (or dynamic zones) for an edge.
- The best signals come from divergences, trend-pullback resets, and breakouts with an MFI thrust.
- Respect market structure and use clear risk controls, as trends can "pin" MFI at extremes.
- Optimize your approach with percentile zones and session filters for better performance.