
Moving Averages (MAs) are among the most foundational, versatile, and enduring tools in technical analysis. Whether you are scalping intraday price swings or positioning for multi-month market cycles, moving averages provide an essential statistical framework for filtering market noise, defining trend bias, and pinpointing high-probability trade locations. By smoothing price fluctuations over defined time horizons, moving averages translate complex price action into clear, actionable technical insights.
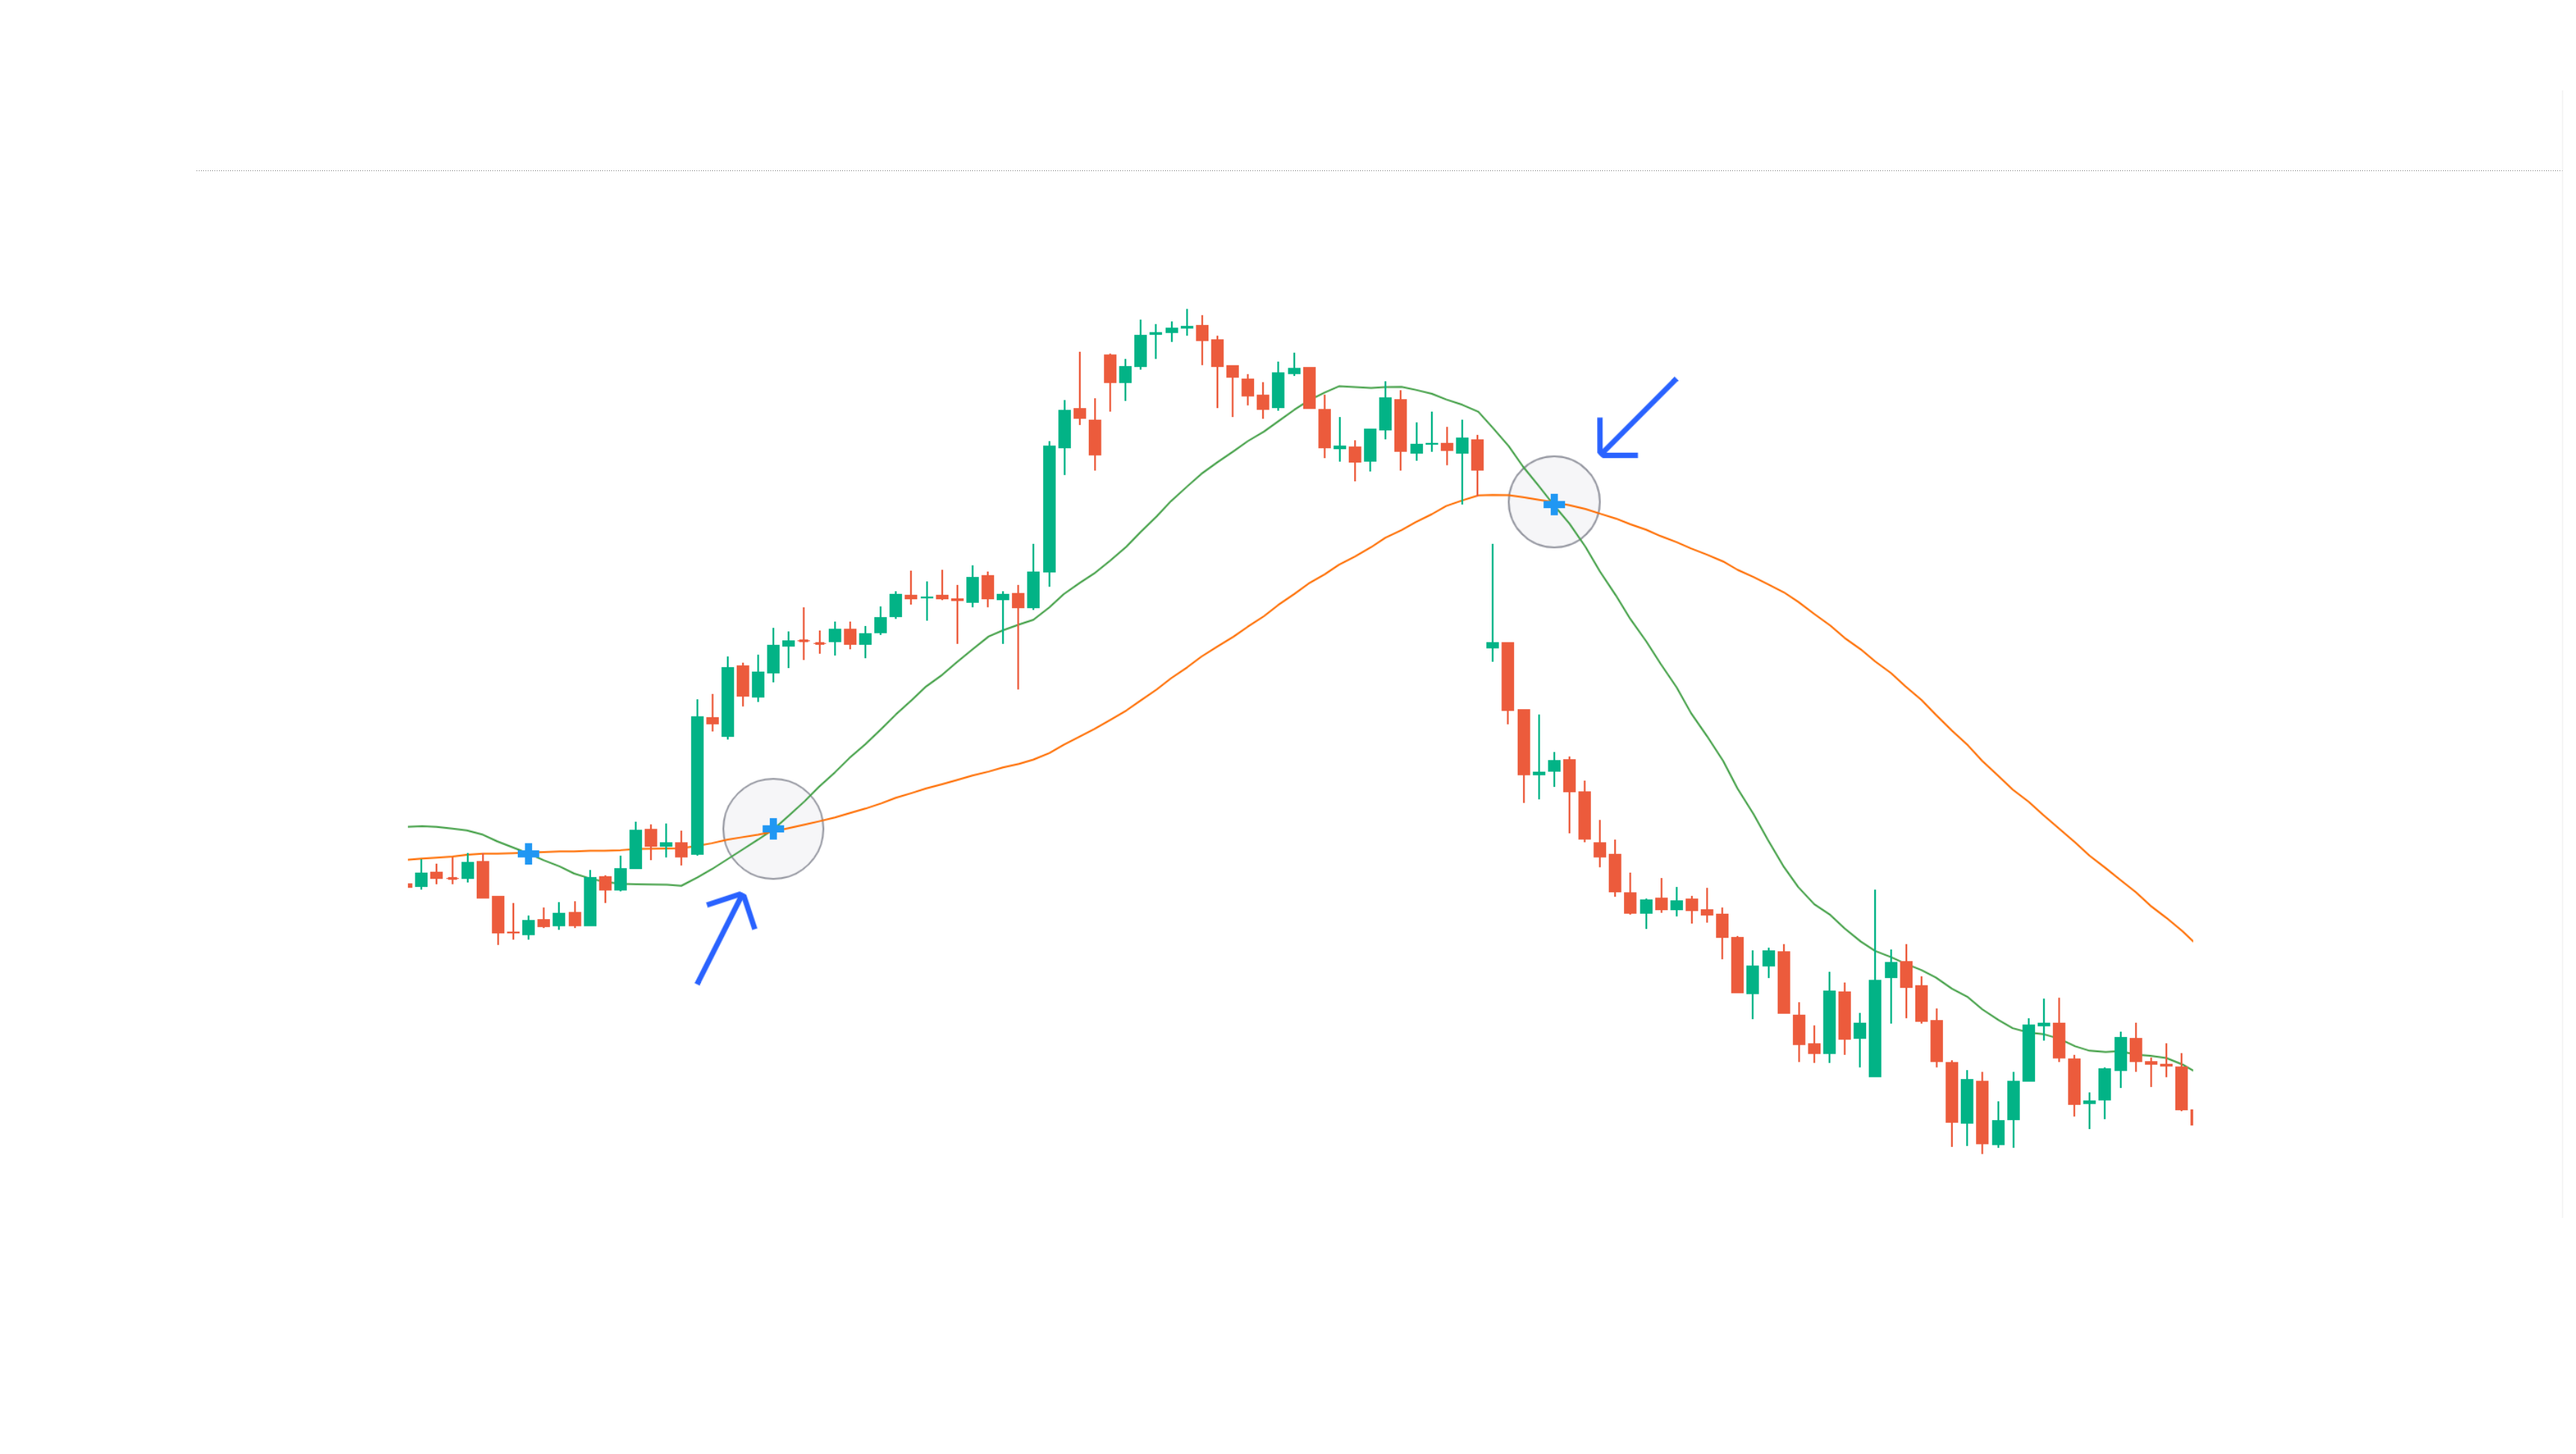
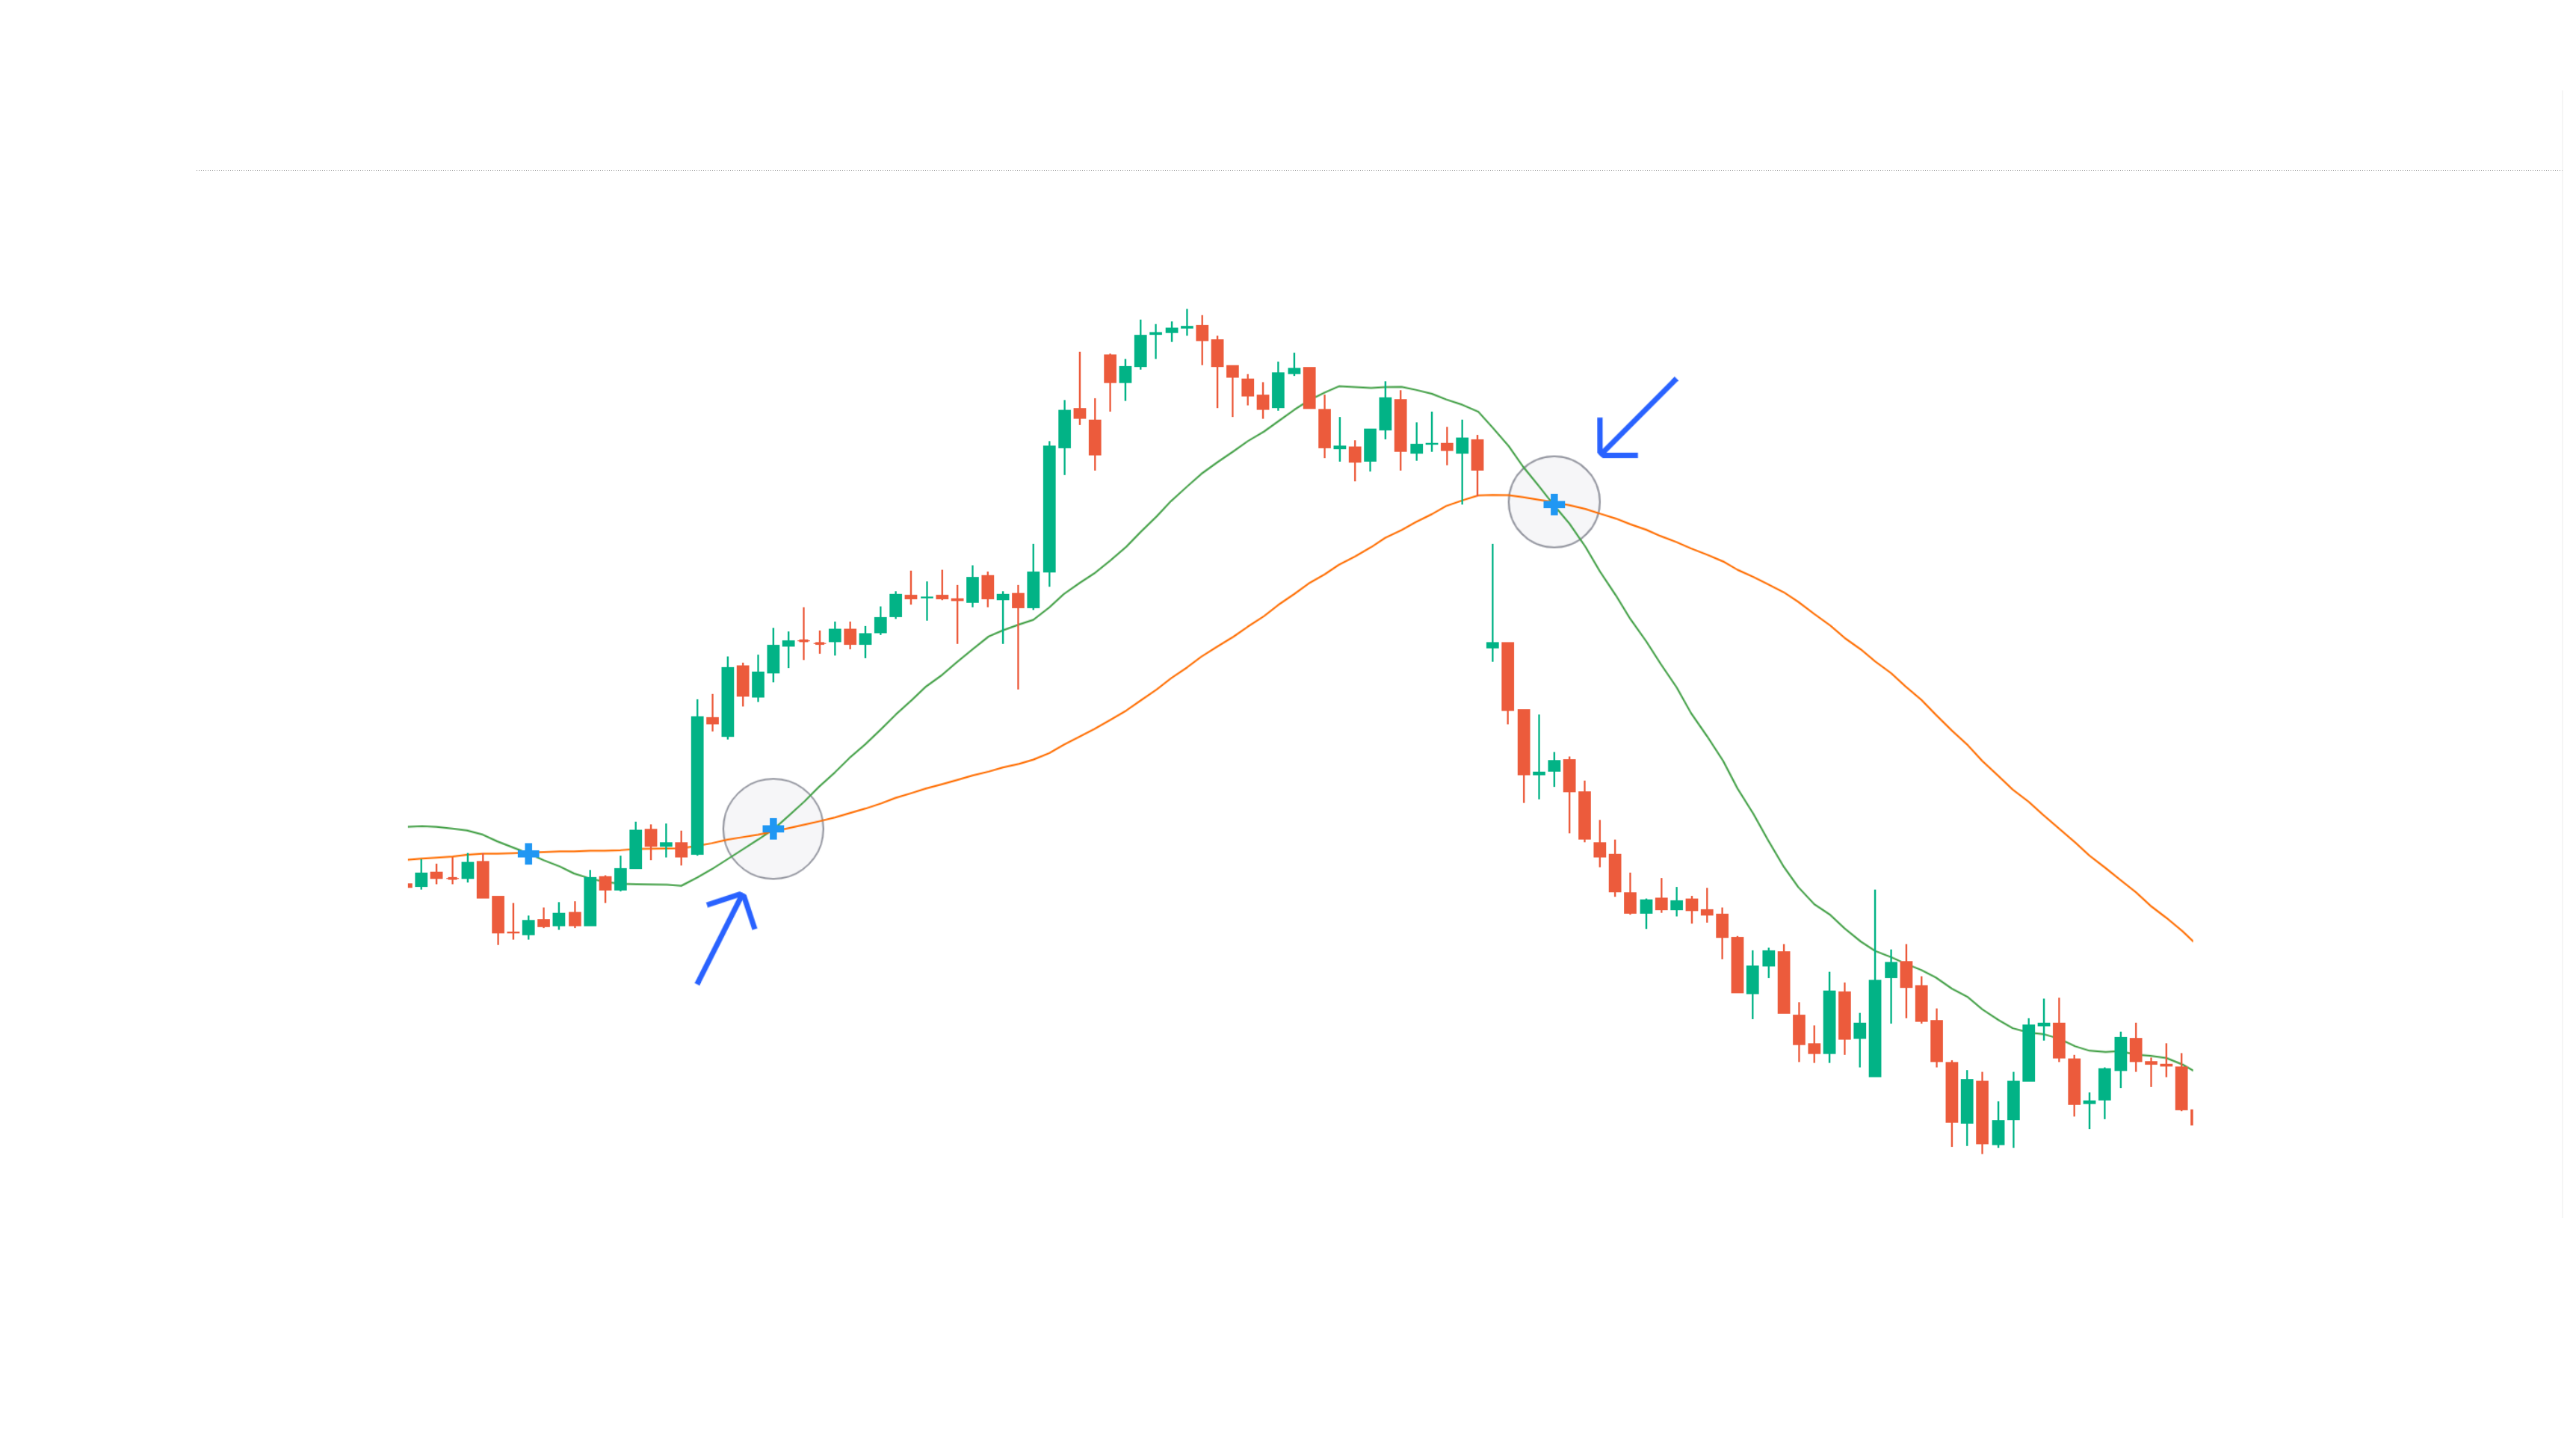
Moving Average Crossover Concept
1. What are Moving Averages?
A Moving Average is a continuous mathematical calculation that averages an asset's price over a specified number of periods. As new price candles close, the calculation drops the oldest data point and incorporates the latest closing price, creating a dynamic line that flows alongside market action.
Rather than predicting future prices out of context, moving averages quantify market equilibrium and trend momentum, helping traders distinguish genuine trend direction from temporary market noise.
2. Why Moving Averages Matter
Moving averages form the backbone of institutional trading algorithms, trend-following models, and systematic risk management frameworks. Key functions include:
- Trend Direction Identification: Instantly establishes market bias. Price maintaining above a rising moving average confirms bullish control; price holding below a declining average confirms bearish control.
- Dynamic Support & Resistance: Key benchmarks—such as the 20 EMA, 50 SMA, and 200 SMA—act as dynamic reaction zones where institutional orders accumulate.
- Trend Reversals & Crossovers: Detects accelerating momentum shifts when short-term averages cross long-term baselines (e.g., Golden Cross and Death Cross setups).
- Momentum Measurement: The steepness of an MA slope directly reflects trend velocity and directional conviction.
3. Types of Moving Averages
While all moving averages smooth price data, different mathematical weighting formulas tailor each MA to specific trading needs:
- Simple Moving Average (SMA): Assigns equal weight to all data points across the selected lookback period.
- Exponential Moving Average (EMA): Applies exponential weighting to recent prices, significantly reducing lag and offering fast momentum responsiveness.
- Weighted Moving Average (WMA): Uses linear weighting to prioritize recent close prices while providing a smooth slope transition.
- Hull Moving Average (HMA): Employs weighted averages of square roots to virtually eliminate lag while maintaining exceptional smoothness.
- Volume-Weighted Moving Average (VWMA): Weights price data by volume, giving greater structural emphasis to high-volume expansion candles.
- Smoothed Moving Average (SMMA) & Triangular Moving Average (TMA): Double-smoothed indicators designed for macro trend filters and volatility smoothing.
- Adaptive Moving Averages (KAMA / FRAMA / ALMA): Dynamically adjust sensitivity based on market noise and fractal efficiency ratios.
4. How Moving Averages are Calculated
Understanding the underlying mathematics allows traders to select the right tool for their strategy:
a. Simple Moving Average (SMA)
Calculates the arithmetic mean of closing prices over $n$ periods.
SMA = (P1 + P2 + ... + Pn) / n
- Lag: Moderate to High (equal weighting creates delayed reactions).
- Best For: Identifying macro market trends and institutional support/resistance levels (e.g., 50-day and 200-day SMAs).
sma = ta.sma(close, length)
b. Exponential Moving Average (EMA)
Applies a multiplier $\alpha$ to prioritize recent price changes.
EMA(t) = (P(t) * alpha) + EMA(t-1) * (1 - alpha)
Where alpha = 2 / (n + 1)
- Lag: Low (rapid response to recent price spikes).
- Best For: Intraday trading, active trend-following, and trailing stop management (e.g., 9 EMA and 21 EMA).
ema = ta.ema(close, length)
c. Weighted Moving Average (WMA)
Assigns linearly decreasing weights to older prices.
WMA = [(P1 * 1) + (P2 * 2) + ... + (Pn * n)] / (1 + 2 + ... + n)
- Lag: Lower than SMA, smoother than EMA.
- Best For: Short- to medium-term momentum strategies.
wma = ta.wma(close, length)
5. Choosing the Right MA for Your Strategy
Selecting the ideal moving average depends directly on your trading horizon and execution style:
Short-Term Traders (Scalpers & Day Traders)
- 9 EMA & 20 EMA: Rapidly track immediate trend momentum and offer tight dynamic support/resistance for aggressive trade entries.
- Hull Moving Average (HMA): Minimizes lag during fast volatility spikes without generating excess false noise.
Medium-Term Traders (Swing Traders)
- 20 EMA & 50 SMA: Define multi-day trend channels. Pullbacks into the 20 EMA or 50 SMA provide high-reward re-entry opportunities.
- Volume-Weighted Moving Average (VWMA): Confirms whether swing moves are backed by institutional volume participation.
Long-Term Traders & Investors
- 100 SMA & 200 SMA: The industry-standard macro trend benchmarks. Major bull/bear market regimes are defined by price interacting with the 200-day SMA.
6. How to Use Moving Averages in Trading
1. Trend Direction & Baseline Bias
- Bullish Regime: Price trading consistently above rising moving averages. Look exclusively for long entry signals.
- Bearish Regime: Price trading consistently below declining moving averages. Focus on short entry setups.
- Consolidation / Chop: Flat, horizontal moving averages weaving through price indicate range-bound conditions where trend strategies should stand down.
2. Dynamic Support & Resistance
In established trends, moving averages behave as dynamic floors or ceilings. Rather than static horizontal levels, the moving average line moves alongside price, offering repeatable bounce entries on pullbacks.
7. The Golden Cross & Death Cross
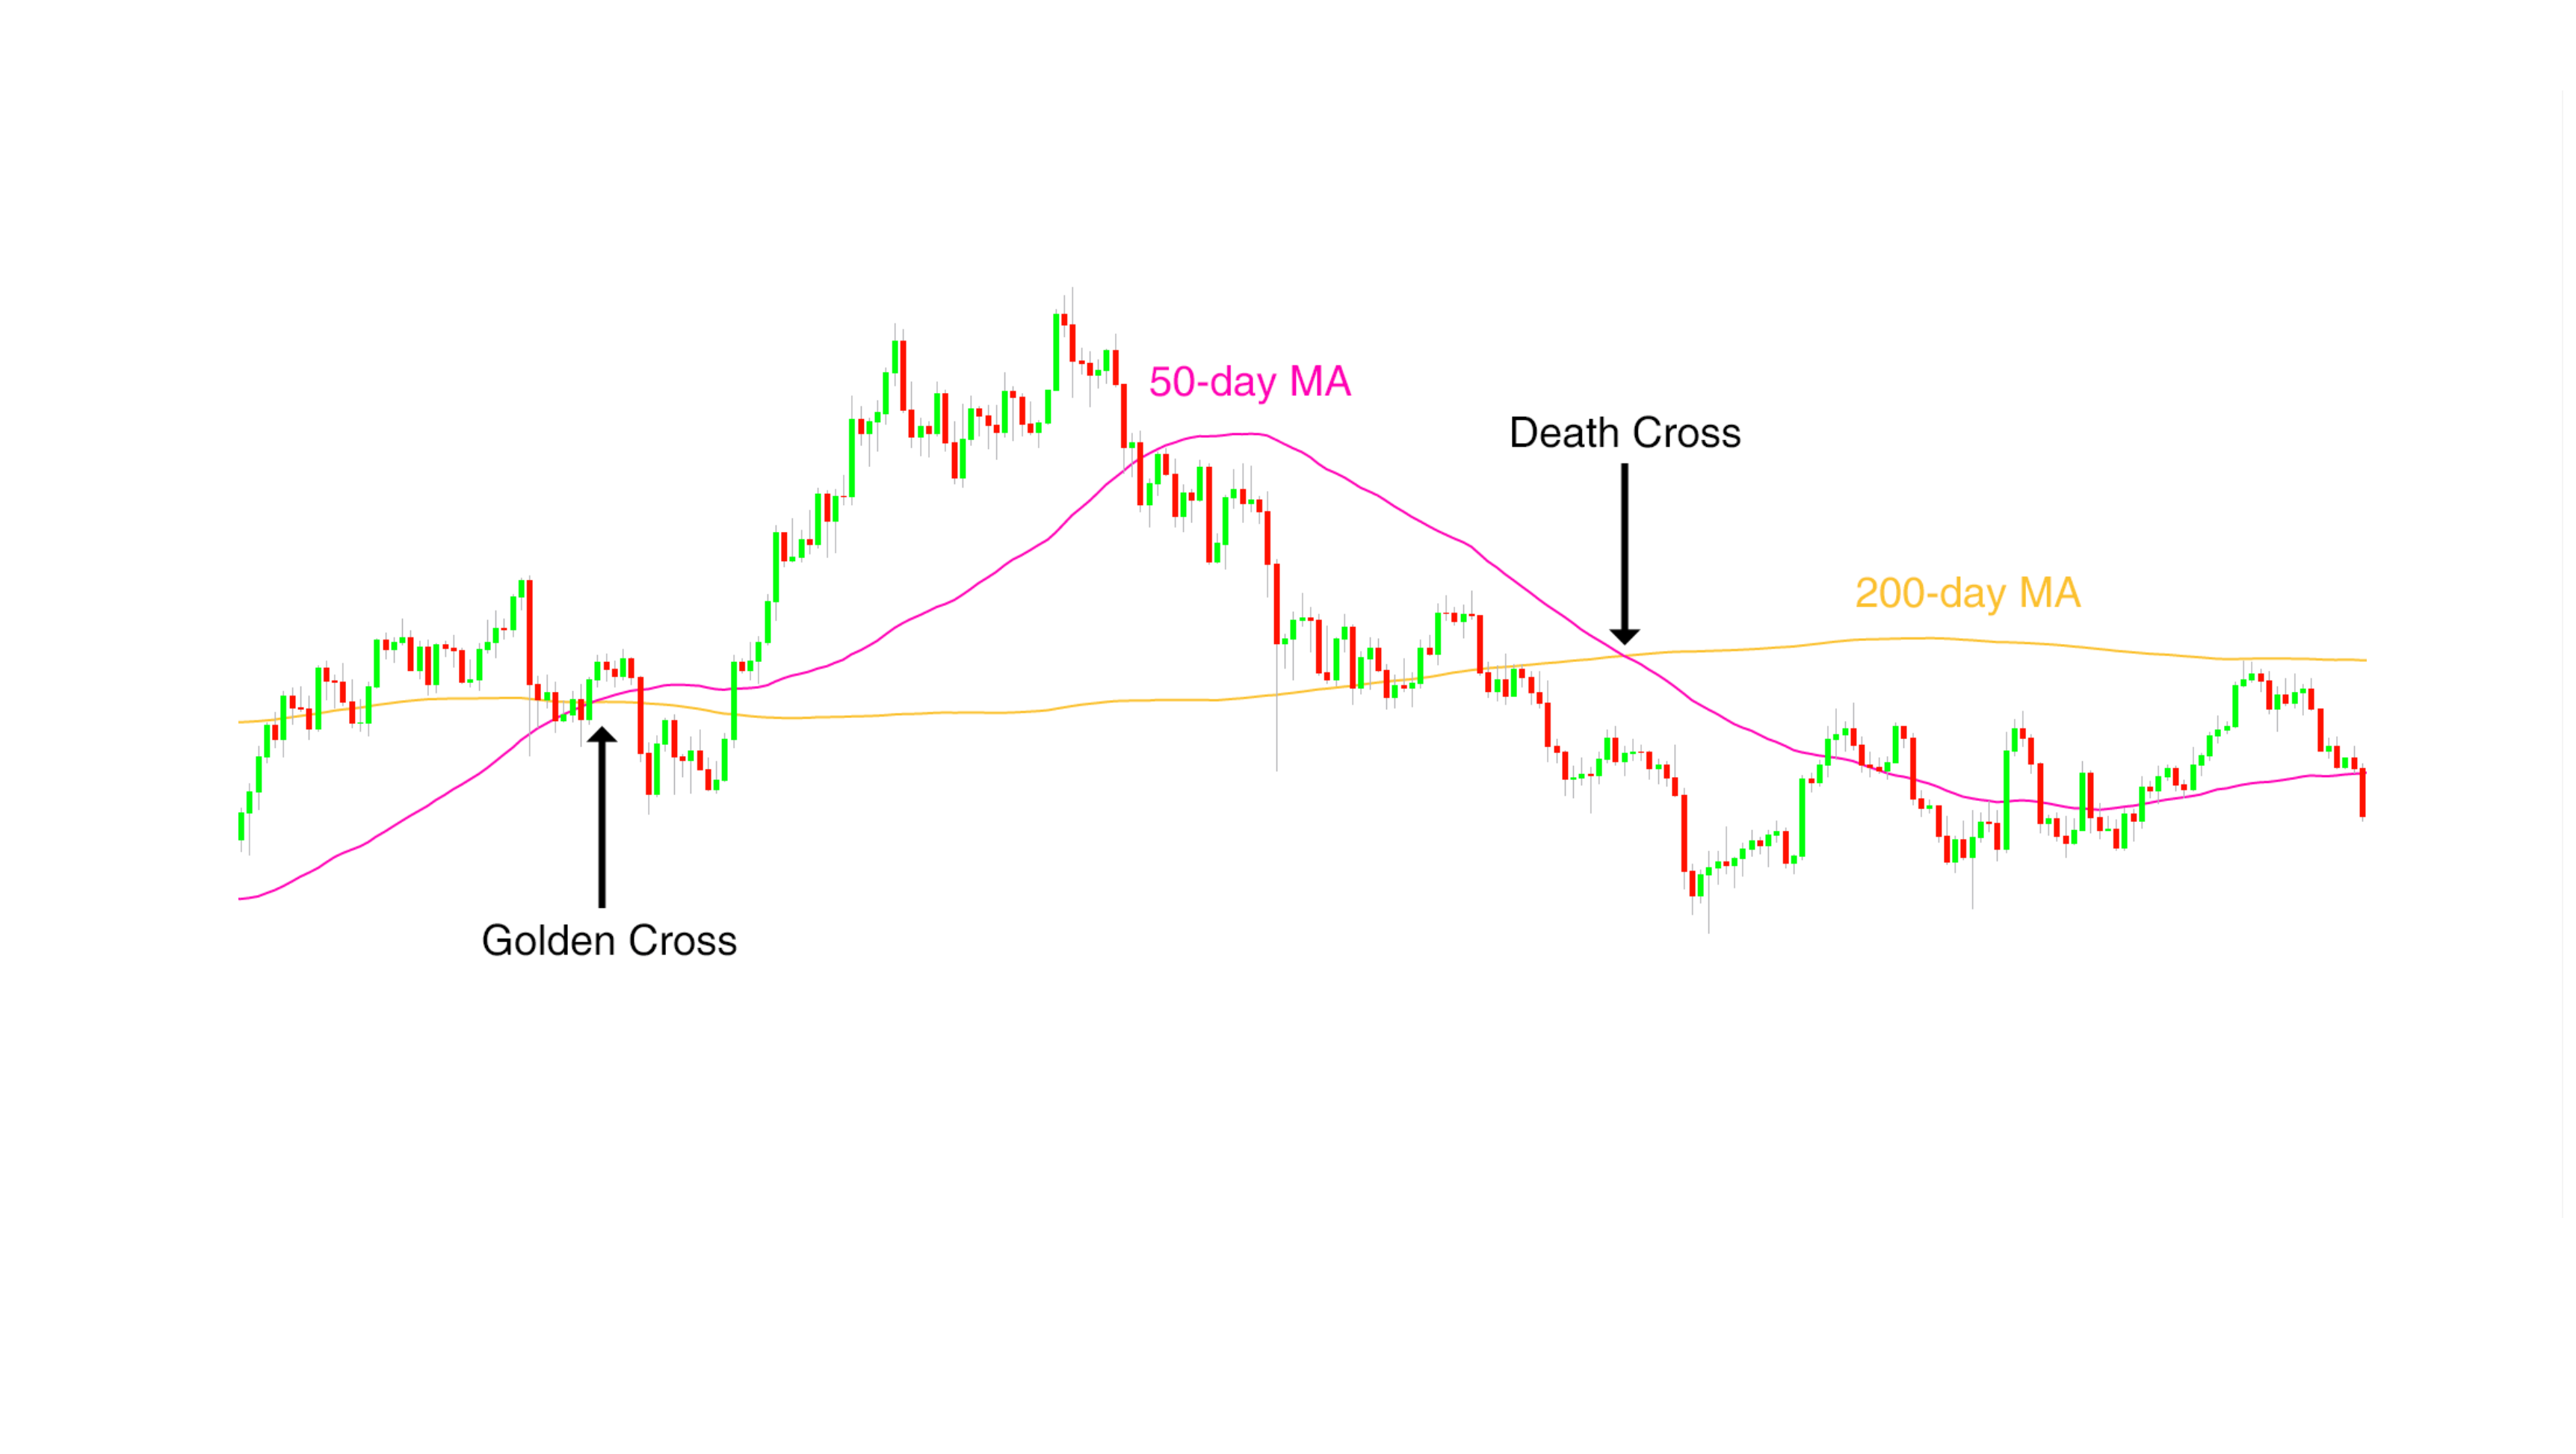
Moving average crossovers provide macro structural signals widely monitored by retail and institutional markets alike.
Moving Average Crossovers Overview
The Golden Cross (Bullish Signal)
Occurs when a short-term moving average (typically the 50-day SMA) crosses above a long-term baseline (the 200-day SMA).
The Golden Cross Setup
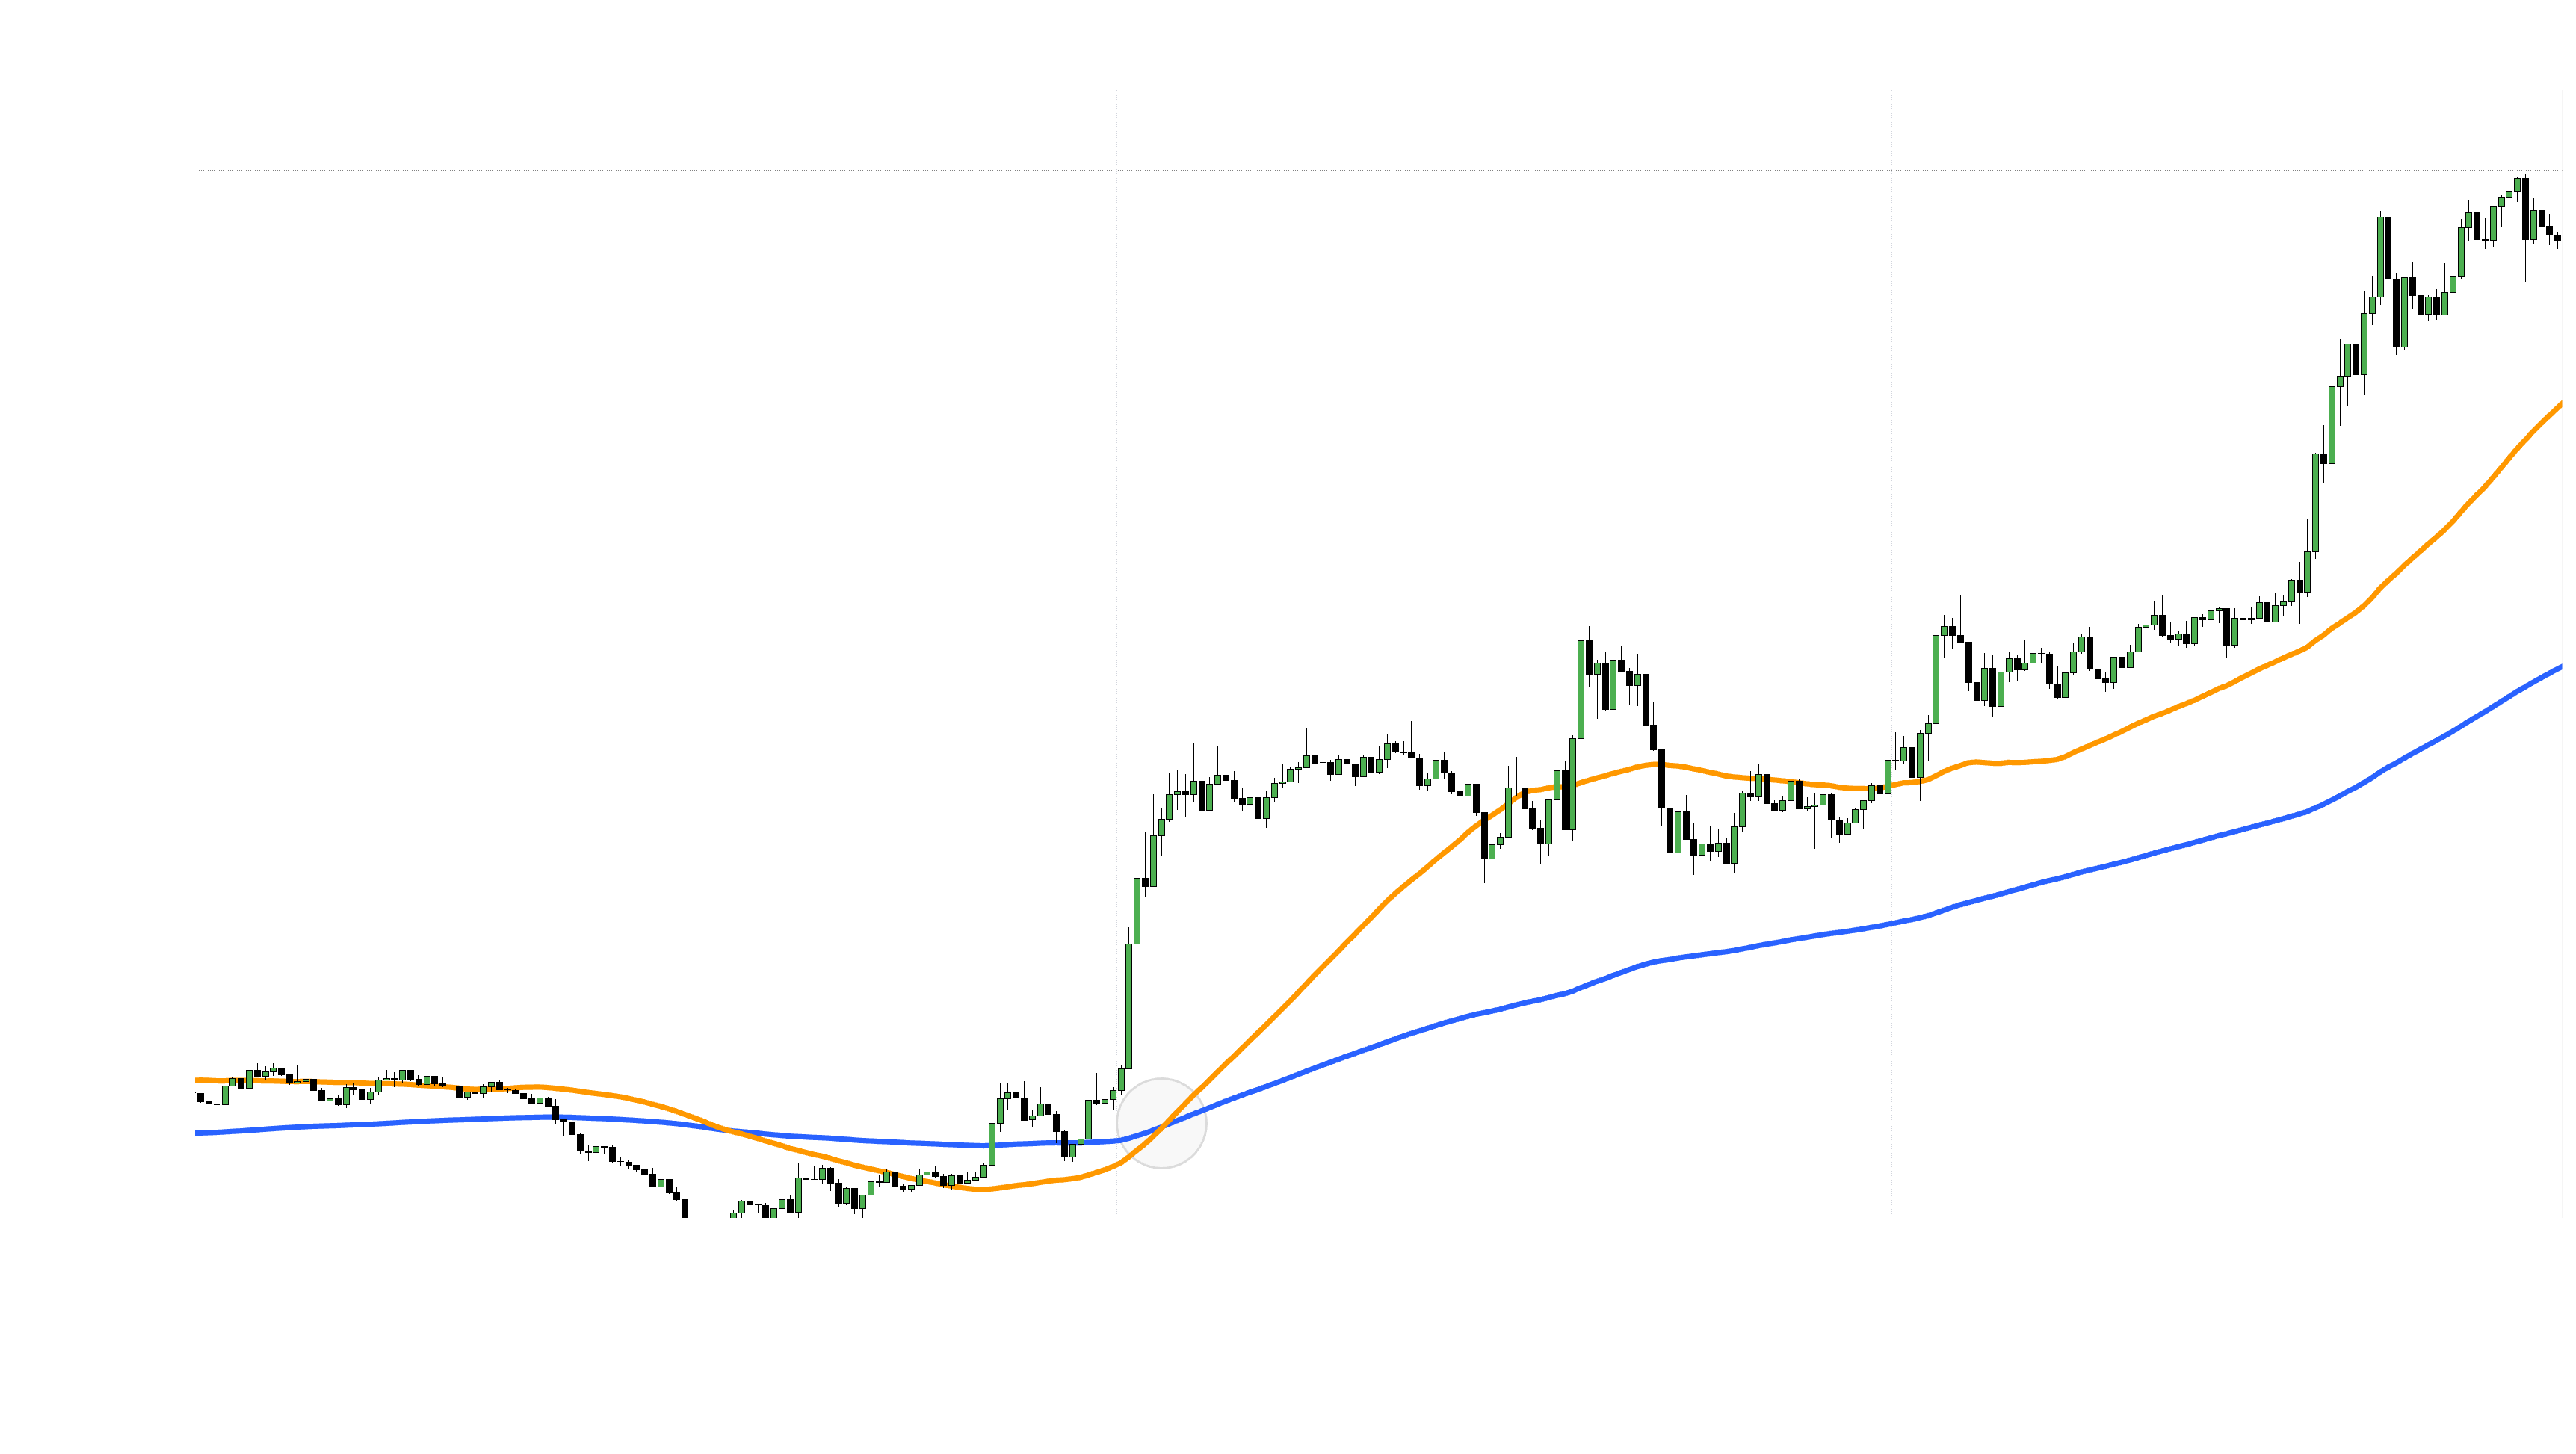
- Market Meaning: Signals that short-term buying momentum has surpassed long-term average equilibrium, confirming the inception or continuation of a major bull market.
- Trading Approach: Look to buy initial pullbacks following the confirmed cross.
The Death Cross (Bearish Signal)
Occurs when a short-term moving average (the 50-day SMA) crosses below a long-term baseline (the 200-day SMA).
The Death Cross Setup
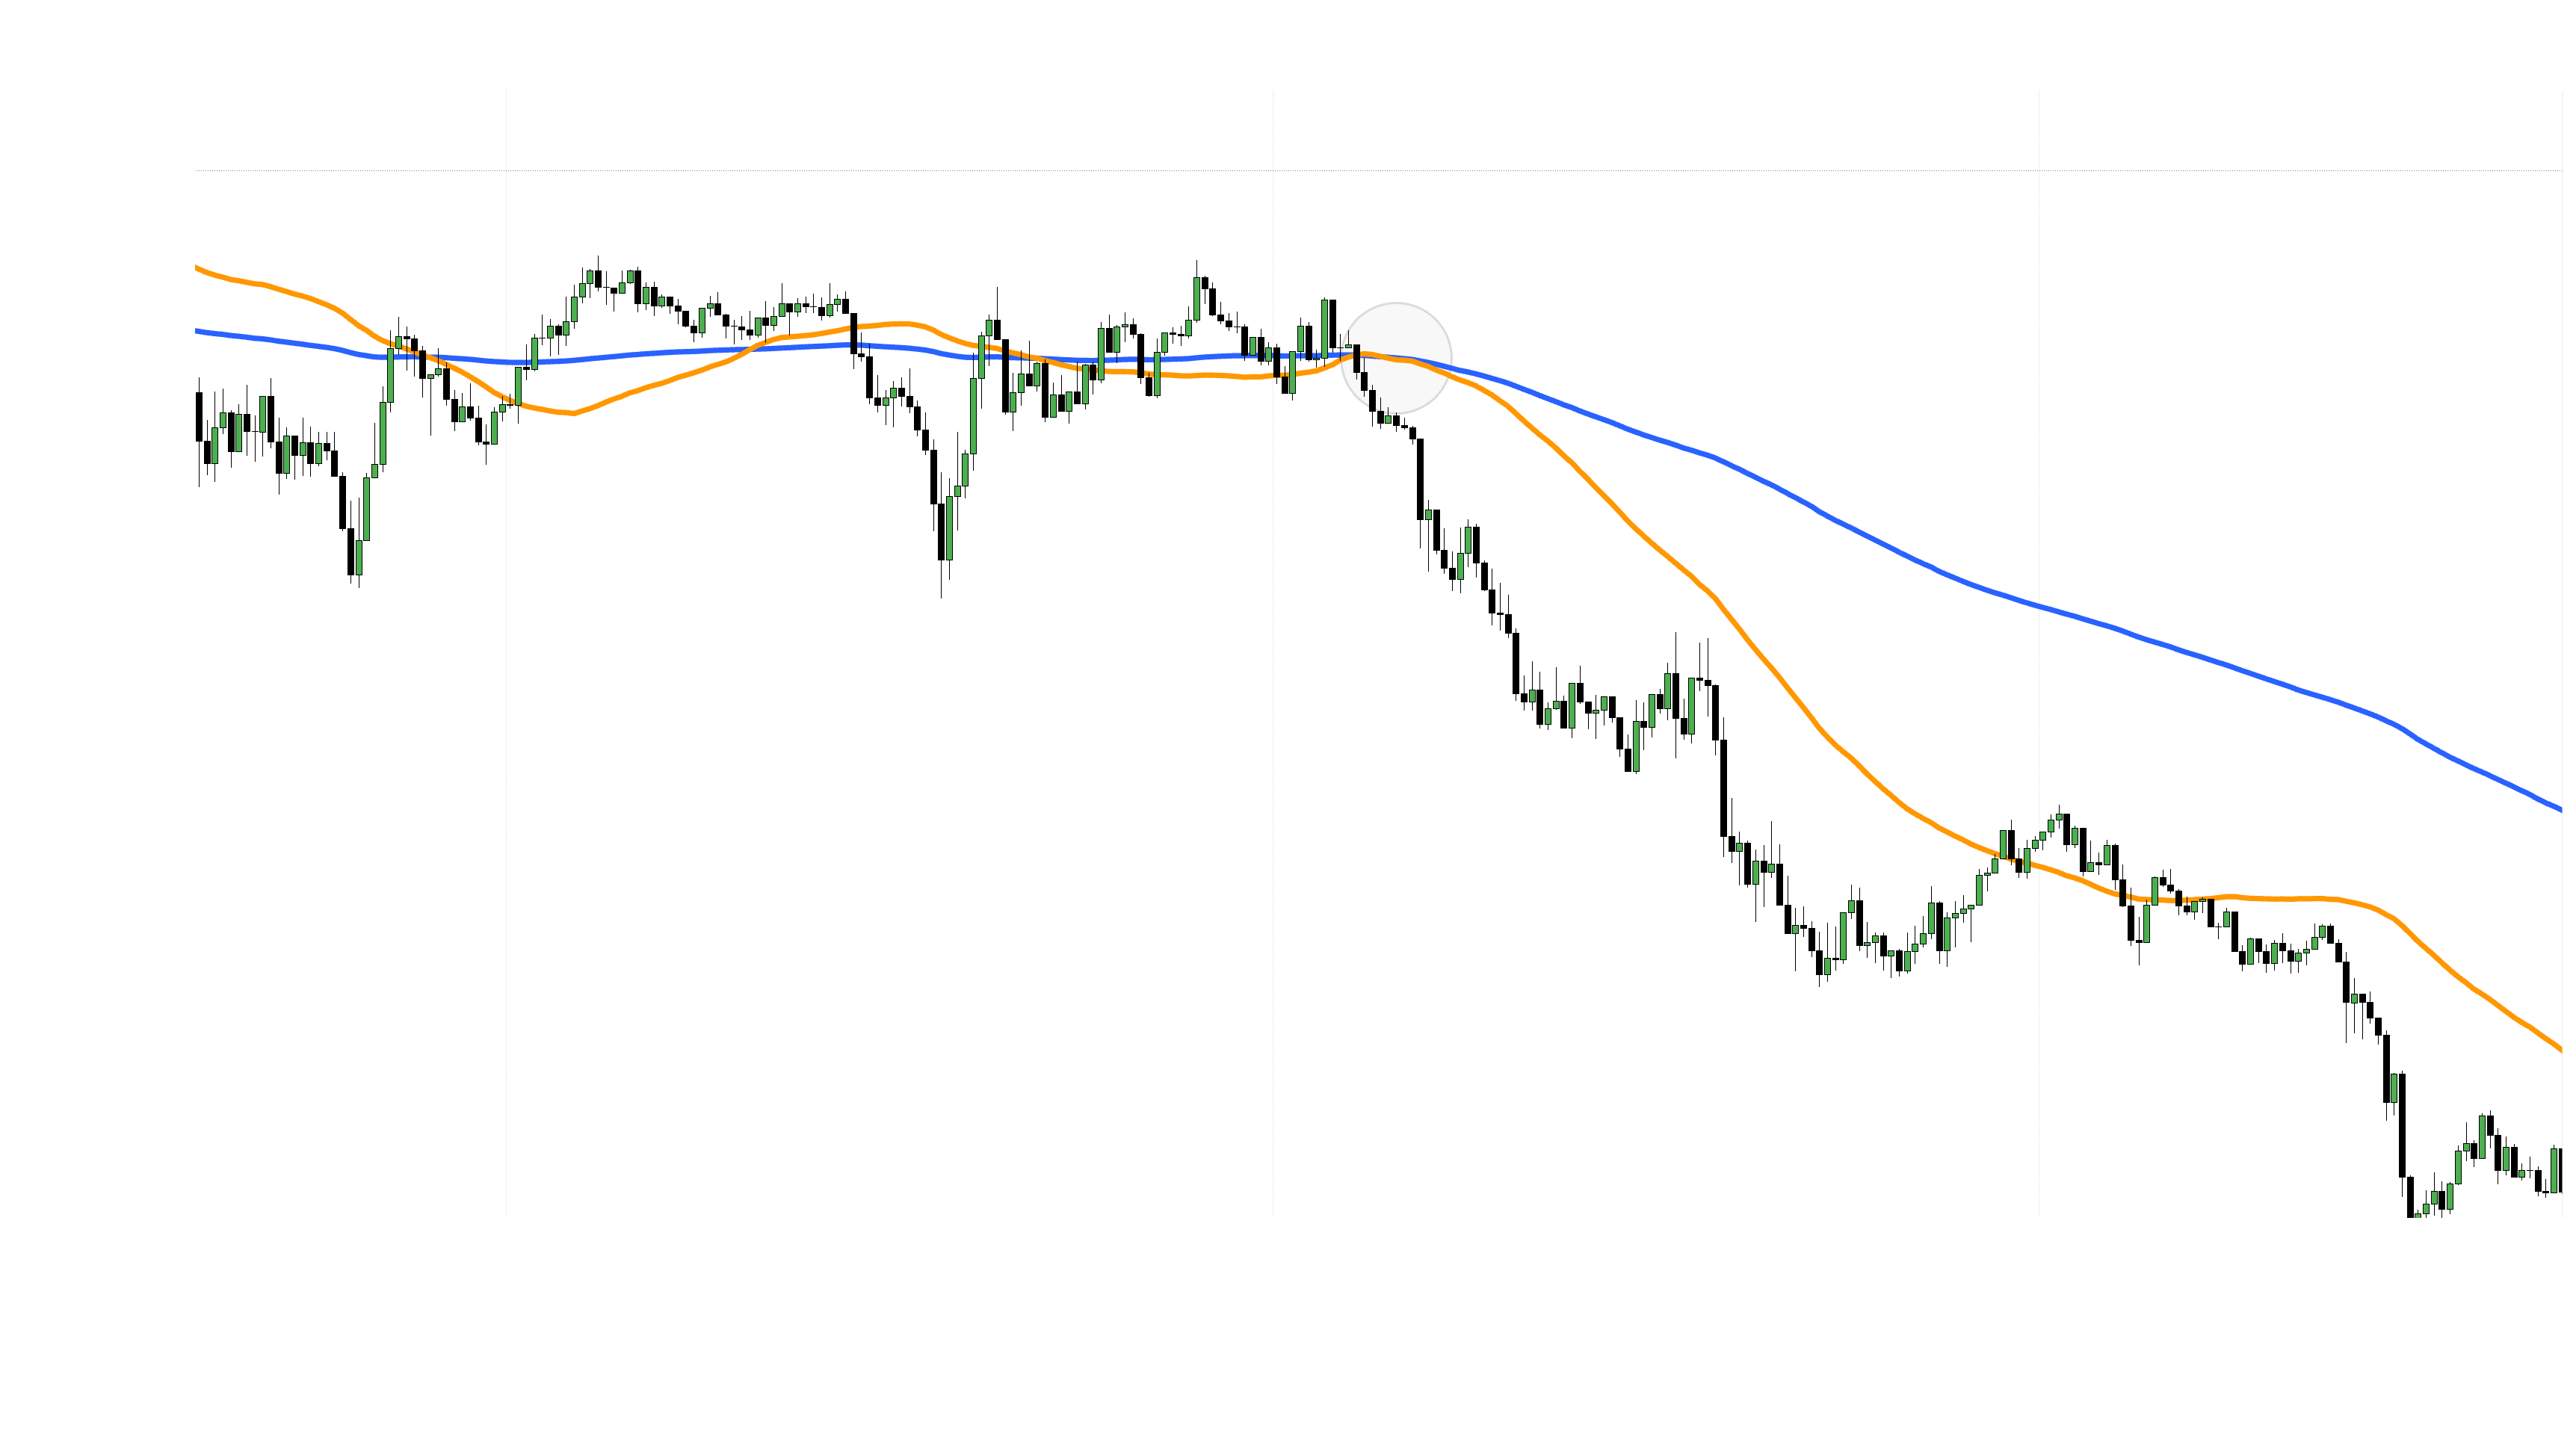
- Market Meaning: Reflects accelerating downside pressure and warns of systemic weakness or bear market cycles.
- Trading Approach: De-risk long positions, tighten stop-losses, or seek short opportunities on corrective bounces.
8. Powerful Moving Average Strategies
Strategy 1: The MA Pullback Entry
In a strong trend, wait for price to retrace back into a key moving average (e.g., the 20 EMA or 50 SMA). Enter upon candlestick confirmation (engulfing candle or pin bar) rejecting the MA line, placing protective stops beyond structural swing extremes.
Strategy 2: Dual EMA Momentum Cross (9 / 21 EMA)
Active traders utilize the 9 EMA / 21 EMA crossover to capture fast momentum shifts on intraday charts:
- Buy Trigger: 9 EMA crosses above 21 EMA while price holds above both lines.
- Sell Trigger: 9 EMA crosses below 21 EMA while price breaks below both lines.
Strategy 3: Mean Reversion to the Baseline
When price expands rapidly away from a long-term moving average (becoming overextended), momentum slows and price statistically reverts back toward its average baseline. Traders fade extreme extensions using volatility tools like Bollinger Bands in tandem with MAs.
9. Key Takeaways & Trading Checklist
- Always trade with bias: Use higher-timeframe MAs (50/200 SMA) to establish directional bias before taking trades.
- Match MA to timeframe: Use fast EMAs (9/20) for day trading and robust SMAs (50/200) for position trading.
- Never trade MAs in isolation: Combine moving averages with price action, market structure, volume, and momentum oscillators (RSI / MACD) for multi-factor confluence.
- Respect consolidation: Avoid trading MA crossover signals in sideways, non-trending markets where false whipsaws are common.