
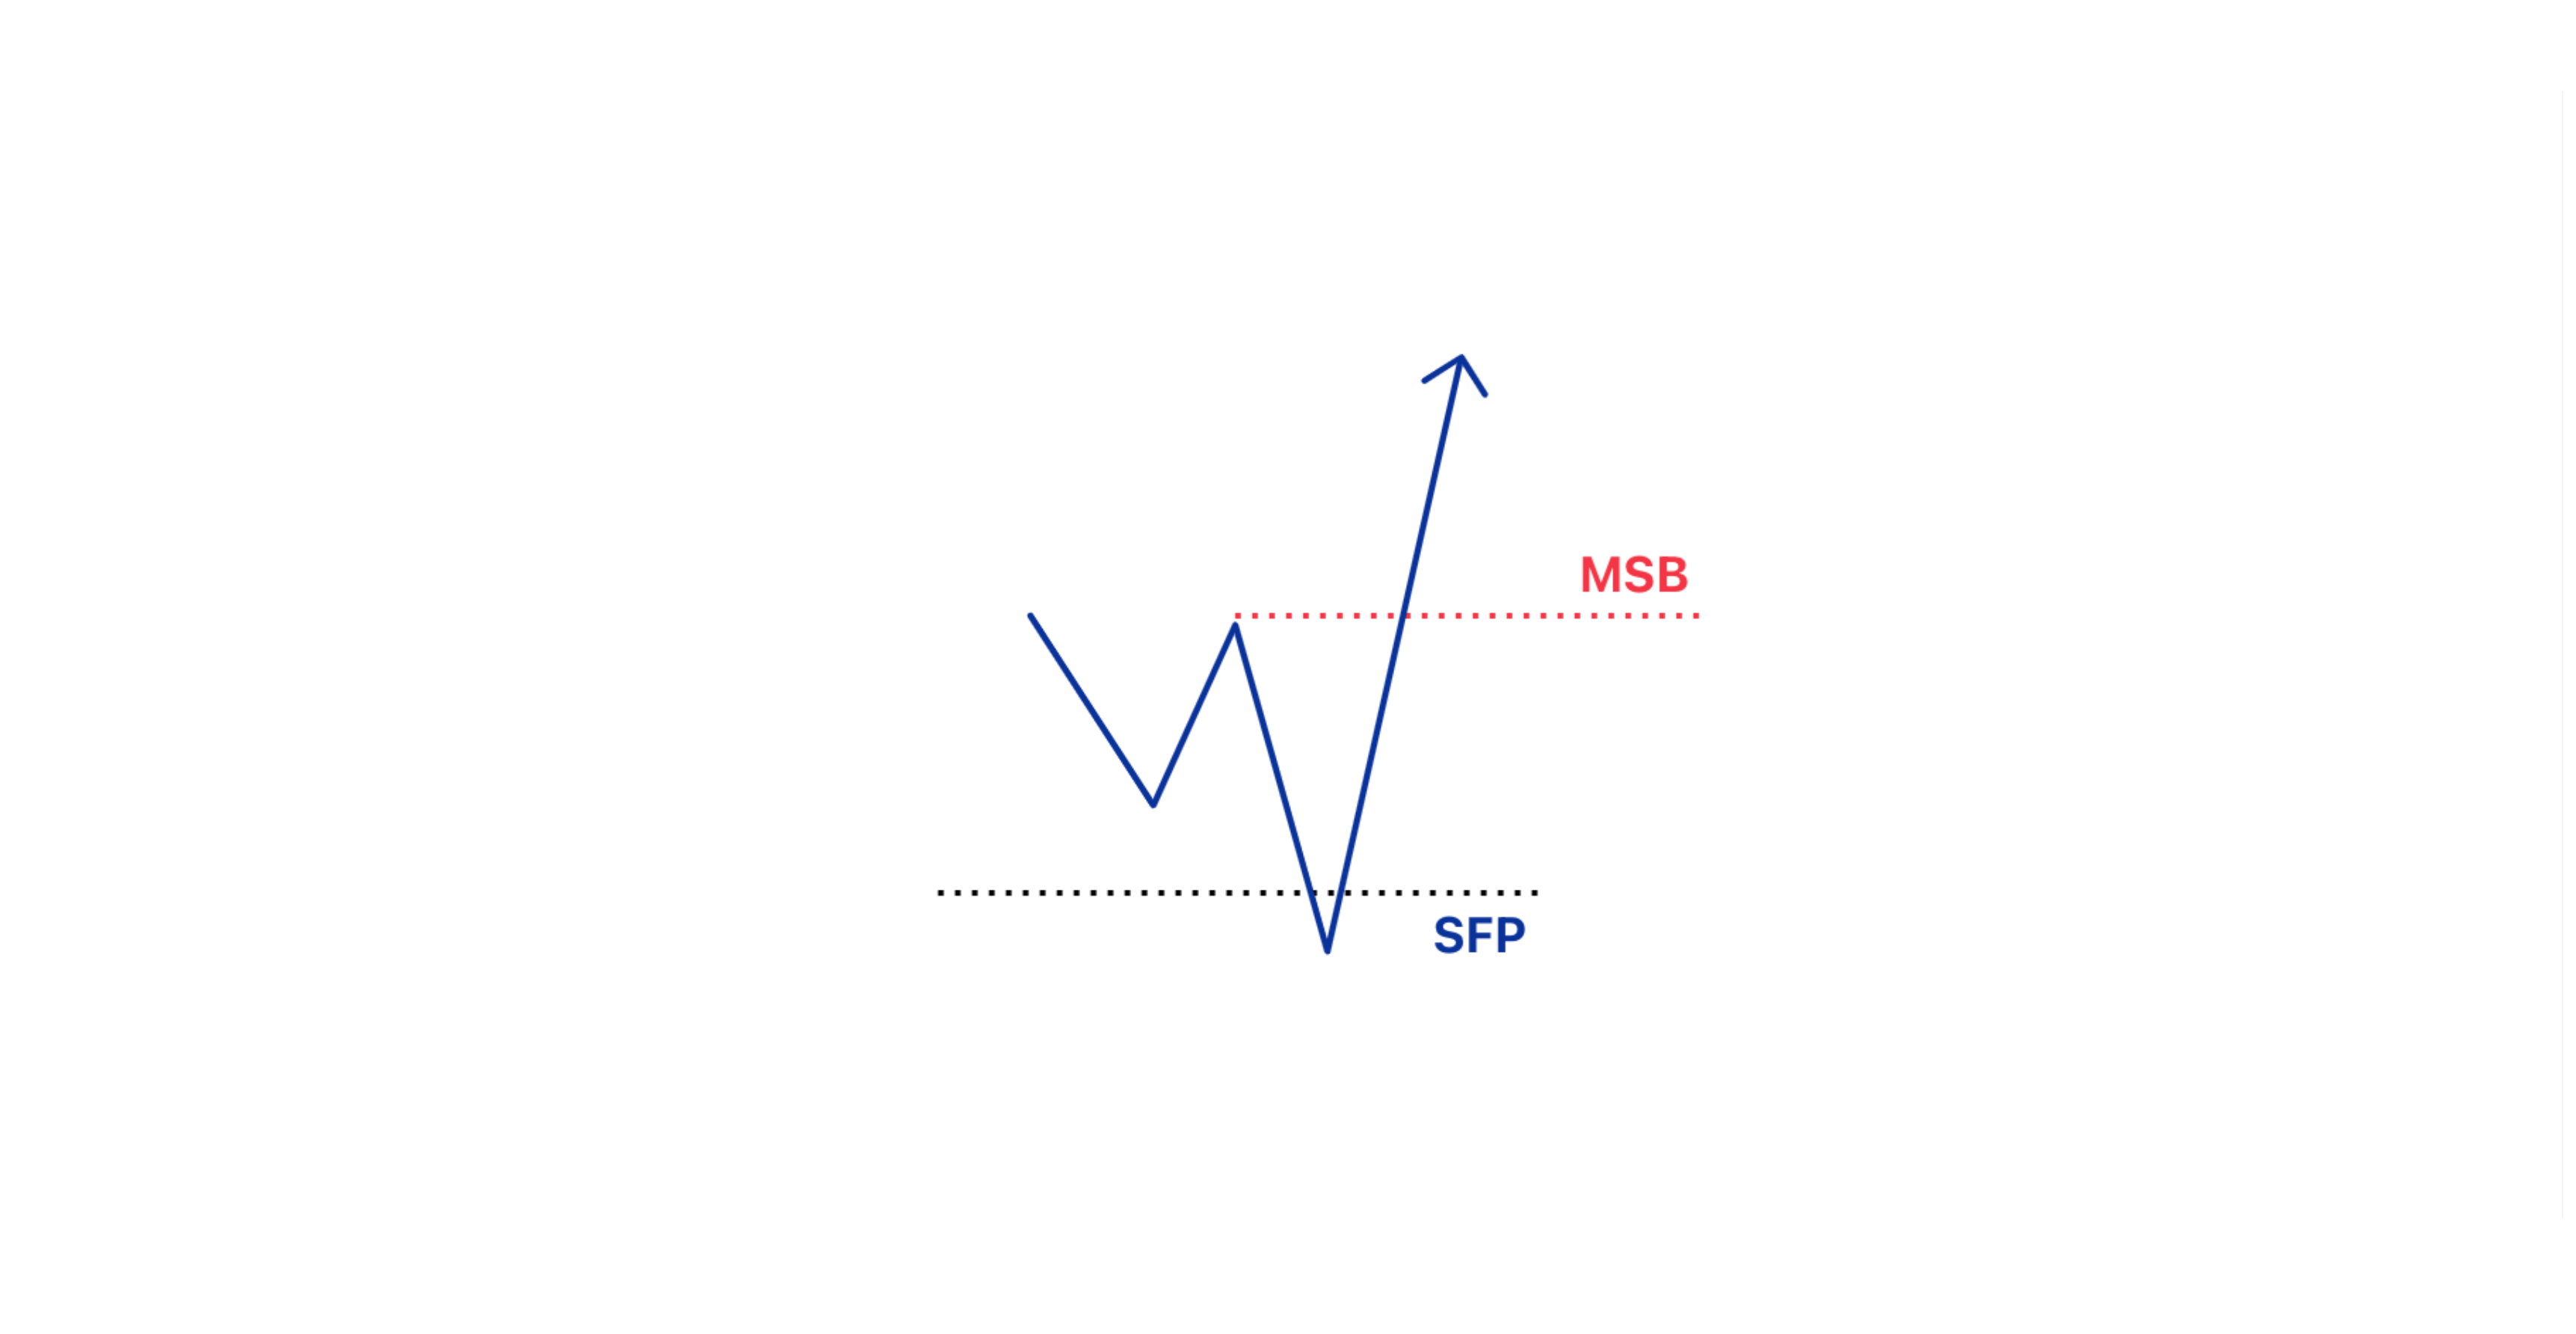
A Swing Failure Pattern (SFP) is one of the most reliable and powerful price action setups in technical analysis. It occurs when price temporarily breaks past a major swing high or swing low to trigger accumulated liquidity, but immediately fails to sustain momentum and sharply reverses back into the prior range.
By understanding the mechanics behind SFPs, traders learn to identify institutional manipulation, avoid retail bull/bear traps, and enter high-probability trades alongside smart money algorithms.
Swing Failure Pattern Concept
1. What is a Swing Failure Pattern (SFP)?
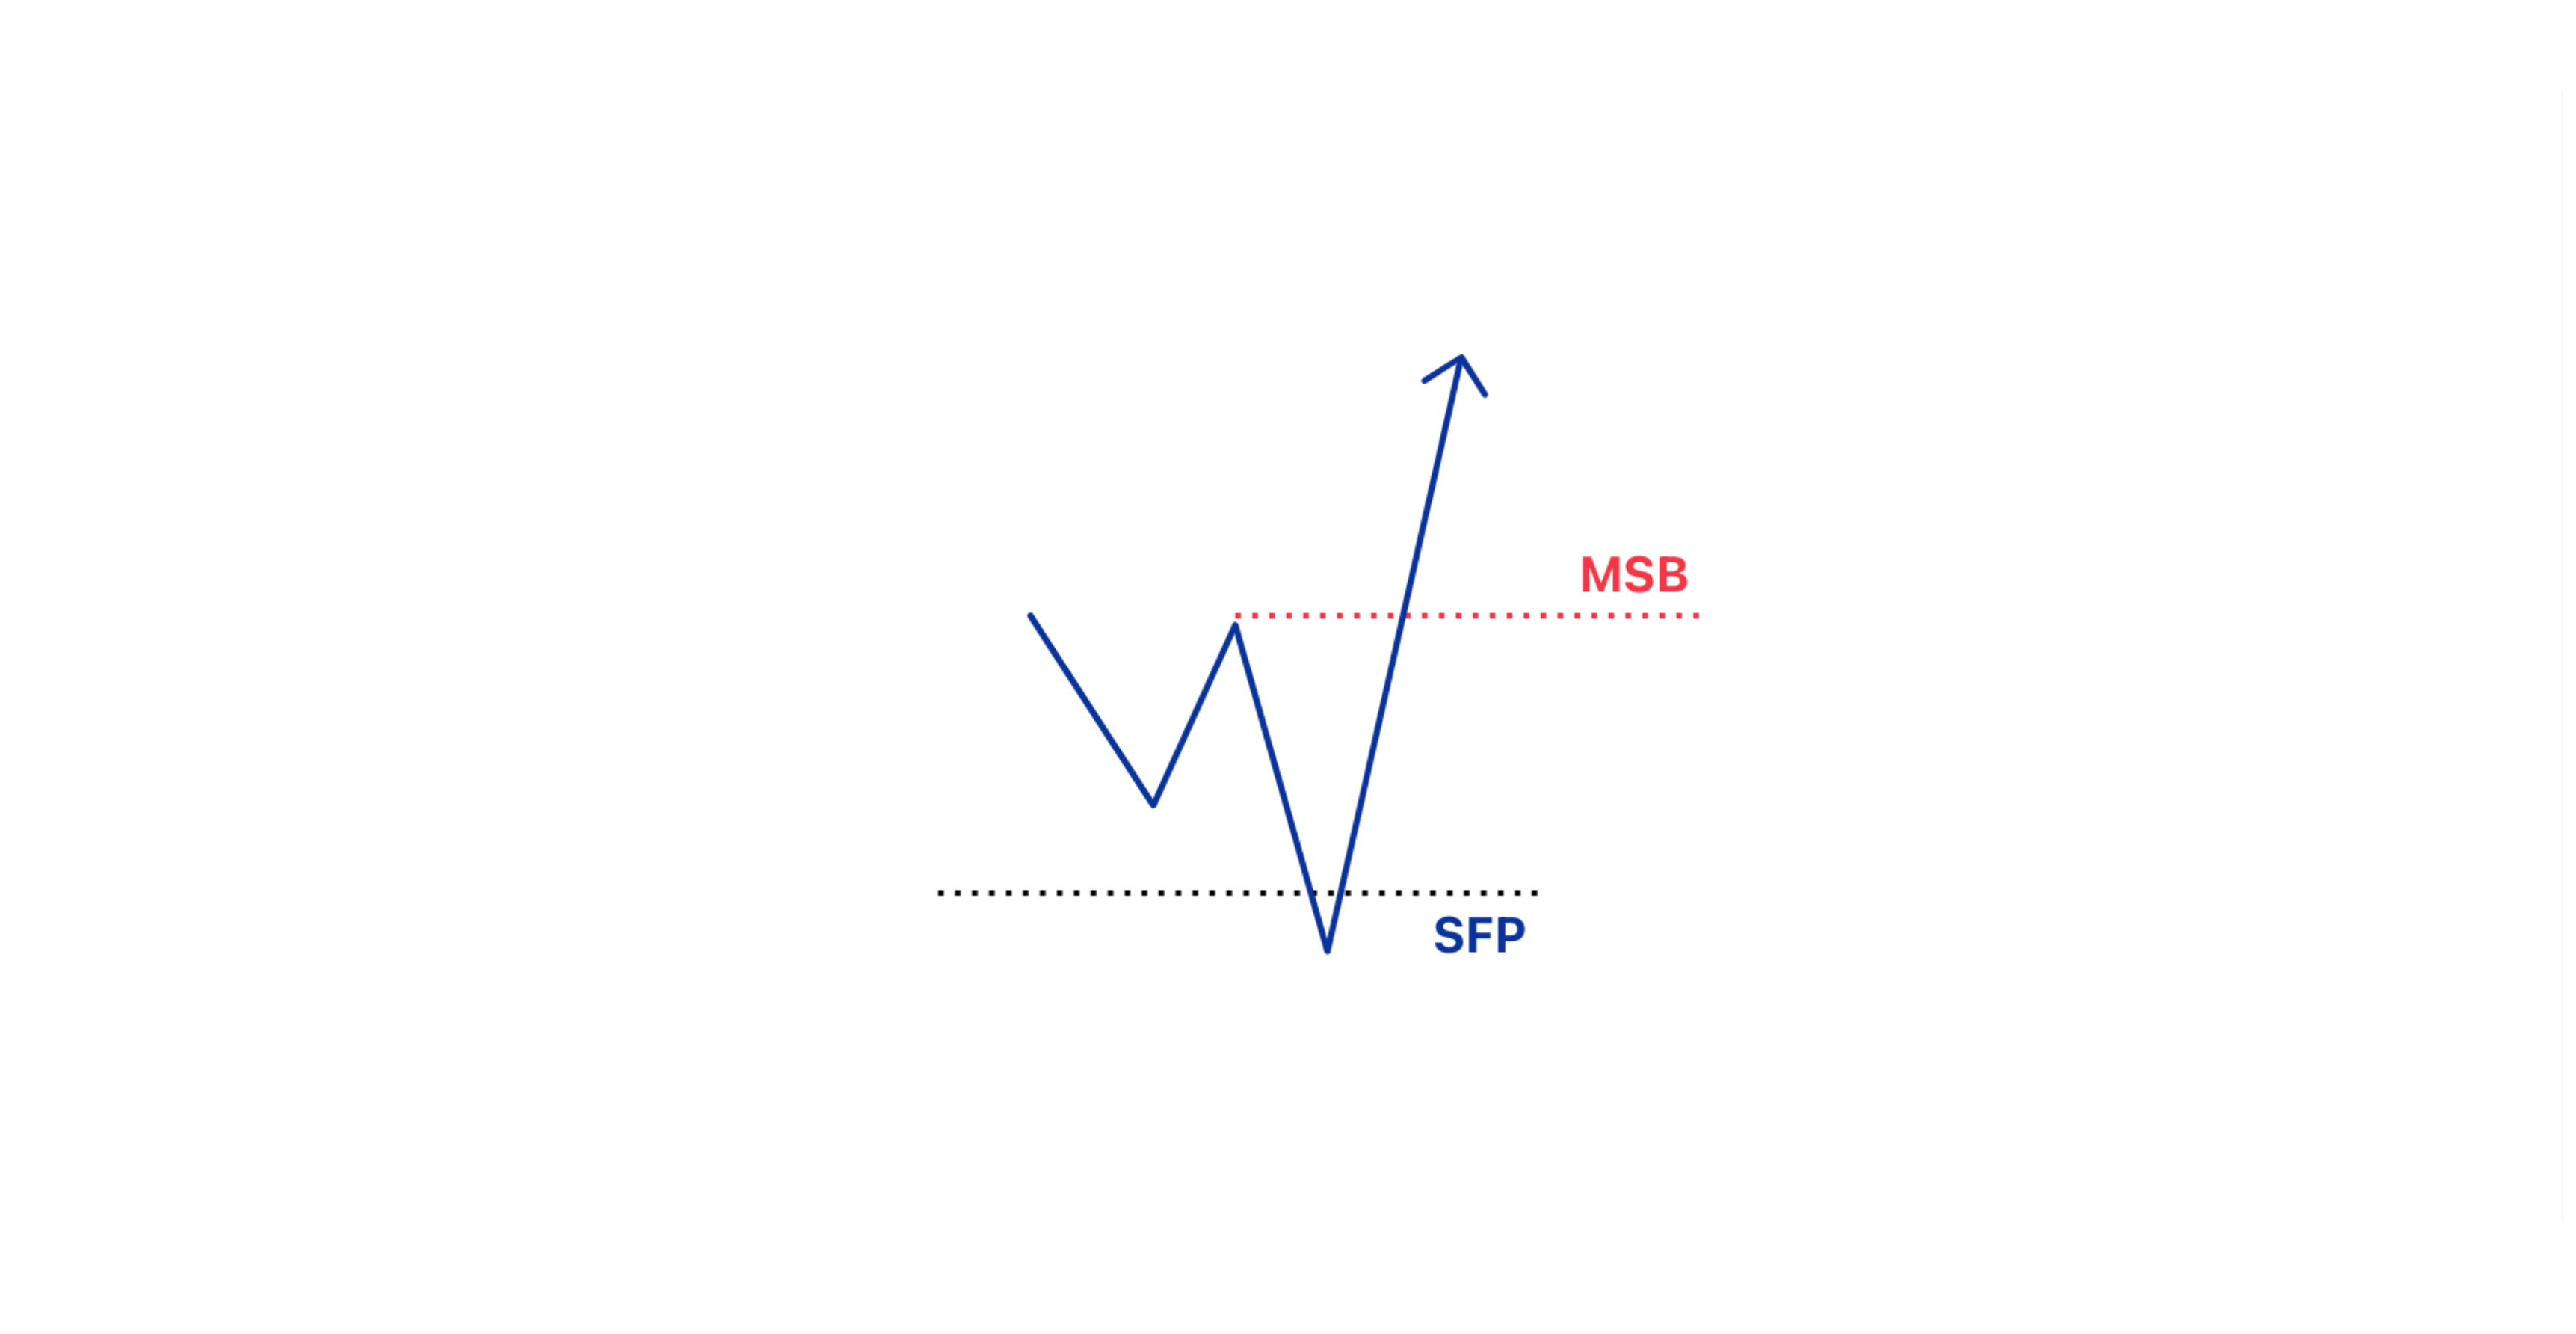
An SFP represents a structural breakdown of a breakout move. Rather than signaling genuine trend expansion, the initial breakout functions as a calculated liquidity sweep.
An SFP setup typically exhibits three distinct phases:
- The Sweep: Price breaks beyond a prior swing high (equal highs) or swing low (equal lows).
- The Rejection: Aggressive institutional absorption pushes price back inside the previous dealing range.
- The Reversal: Price closes back within the range, invalidating the breakout and triggering a rapid trend shift.
2. Liquidity Grabs & Stop Hunts Explained
Financial markets do not move randomly; they are driven by the search for counter-party liquidity. Large market participants—such as hedge funds, market makers, and institutional algorithms—require massive volume to execute sizable positions without incurring destructive price slippage.
Liquidity Grab and Stop Hunt Mechanism
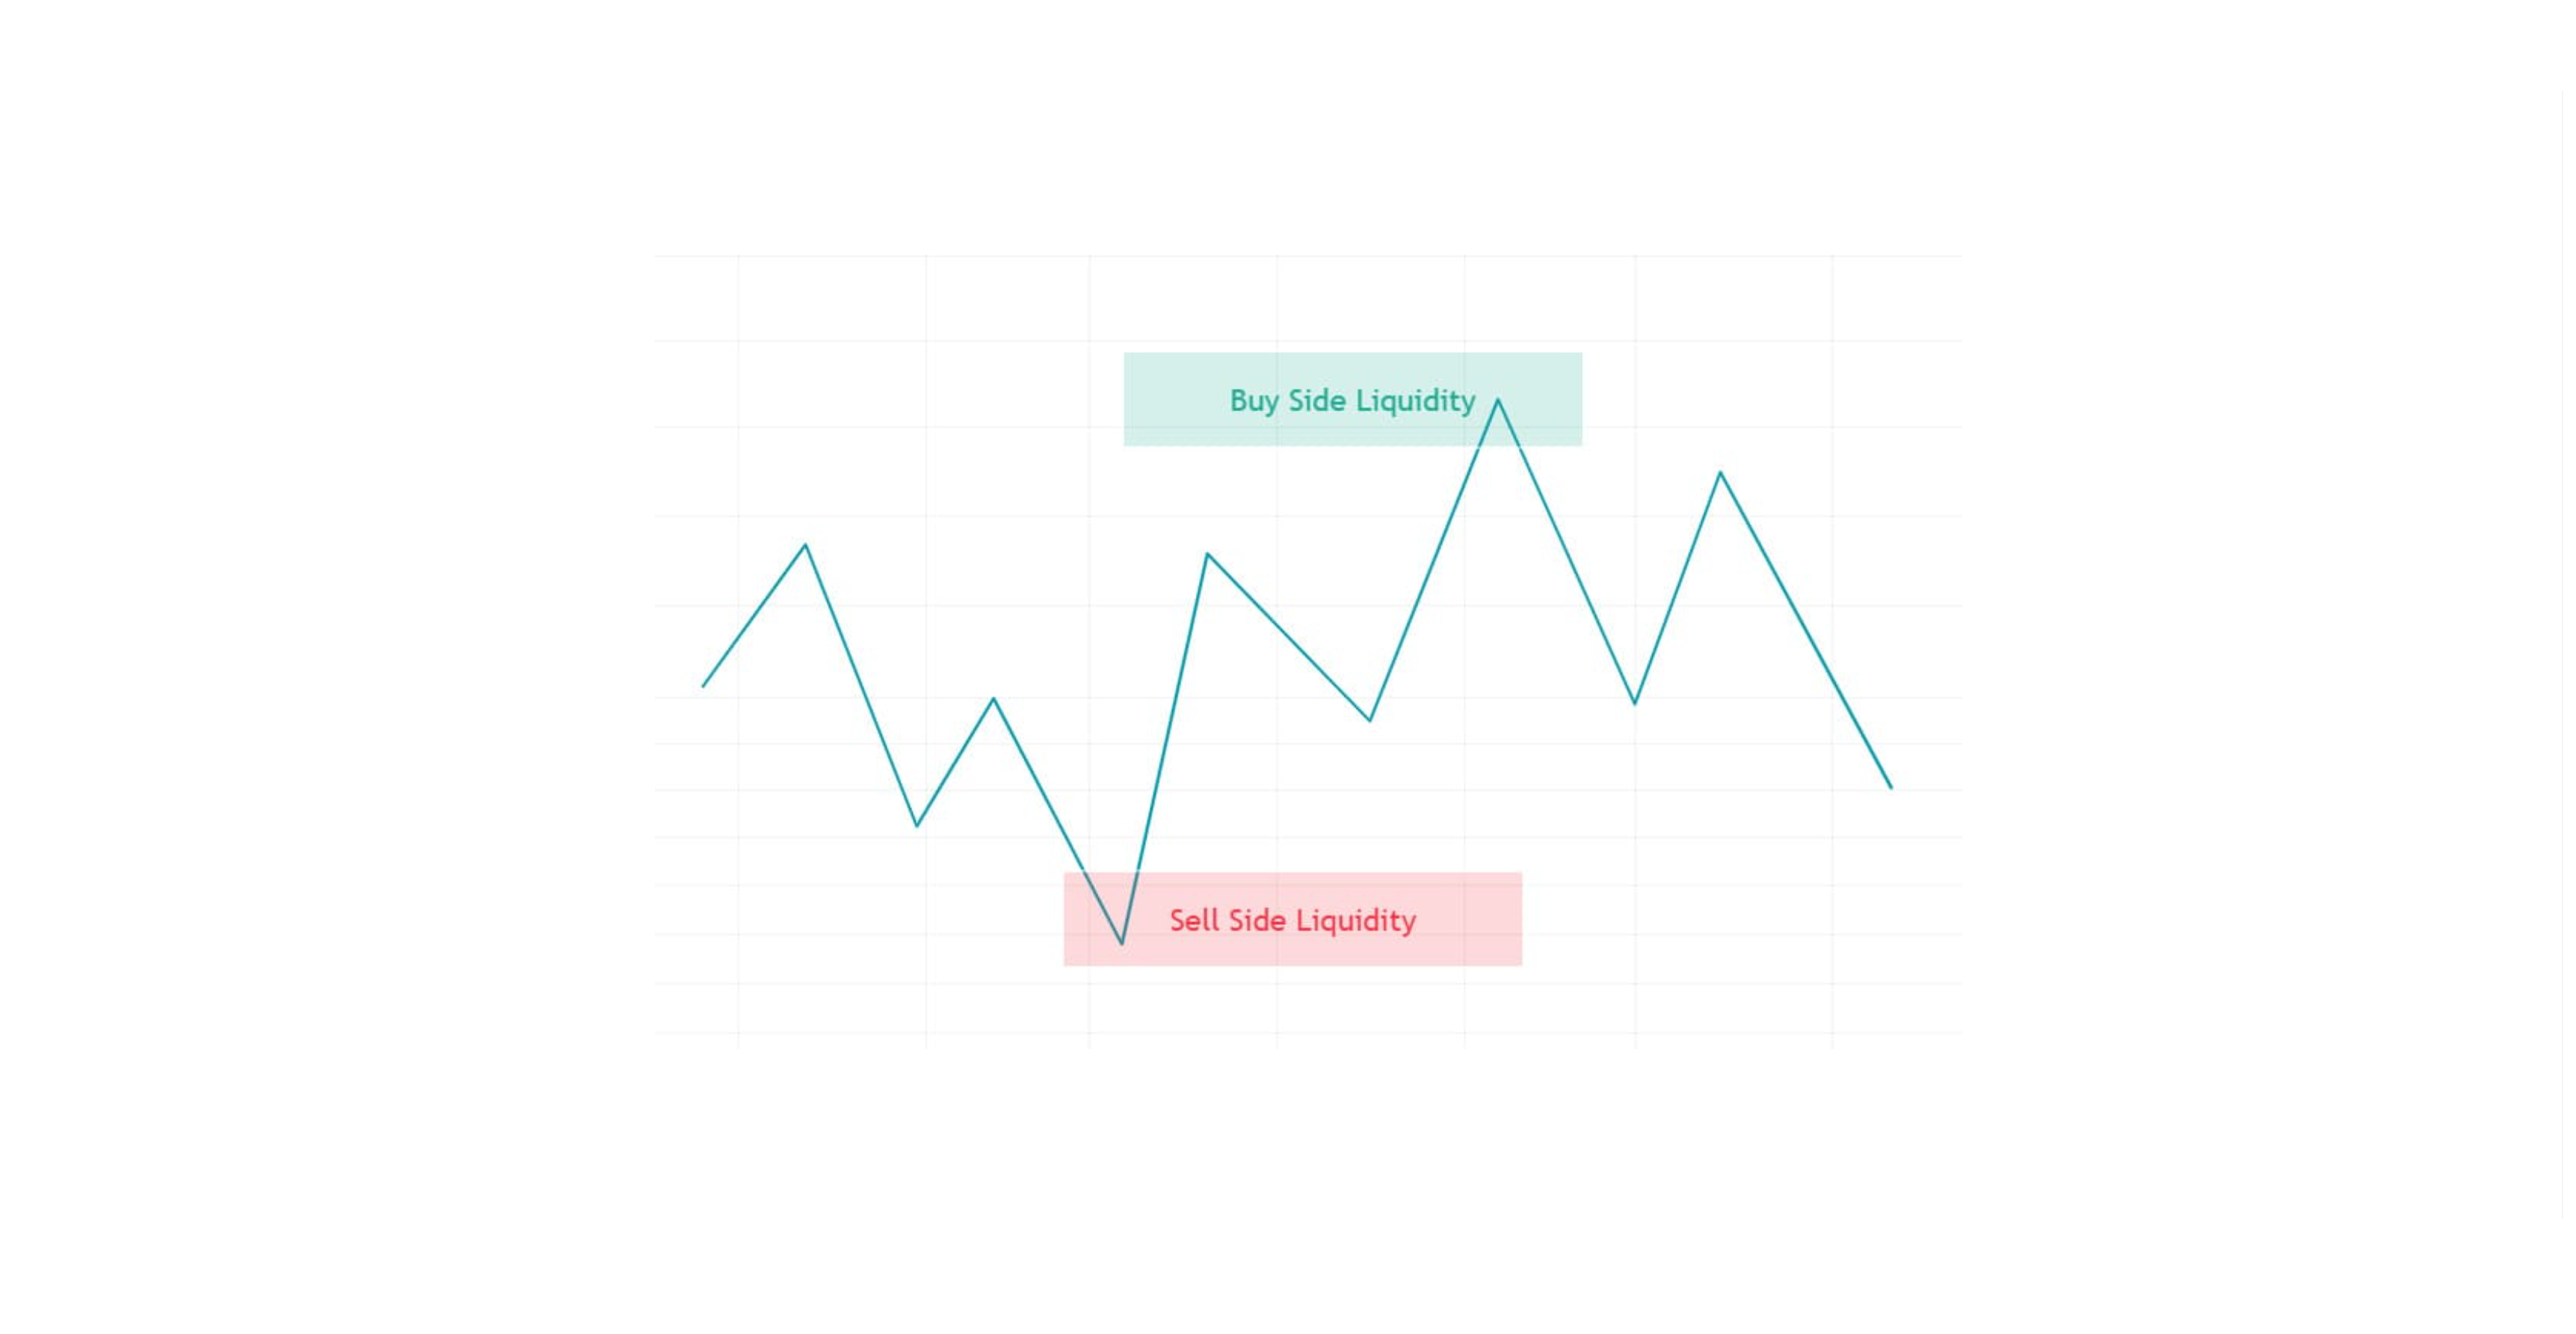
Liquidity Grabs
Occur when price is engineered past key structural levels where retail stop-losses and breakout pending orders sit. Smart money absorbs this liquidity to fuel their counter-trend position building.
Stop Hunts
Deliberate, rapid price spikes designed to trigger stop-loss orders positioned tightly above obvious resistance or below clear support levels before price reverses violently in the intended direction.
3. Why Smart Money Uses SFPs
Smart Money Exploiting Liquidity Pools
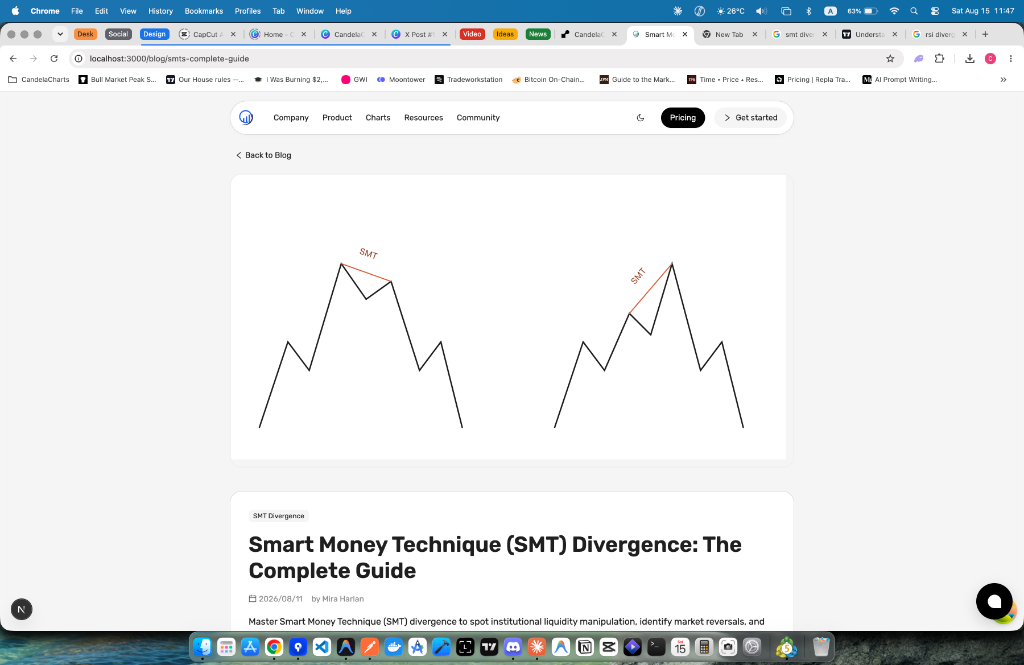
Institutions rely on Swing Failure Patterns for three primary operational reasons:
- Order Execution at Scale: Sweeping stop clusters creates the necessary counter-liquidity to fill large institutional buy or sell orders cleanly.
- Exploiting Retail Psychology: Retail traders are taught to buy breakouts above resistance and sell breakdowns below support. Smart money trades against these predictable behaviors.
- Optimized Trade Pricing: SFPs allow institutions to acquire positions at absolute range extremes (buying at a discount, selling at a premium).
4. Market Structure & Swing Points
Understanding SFP setups requires a firm grasp of market structure baselines:
Market Structure Swing Points
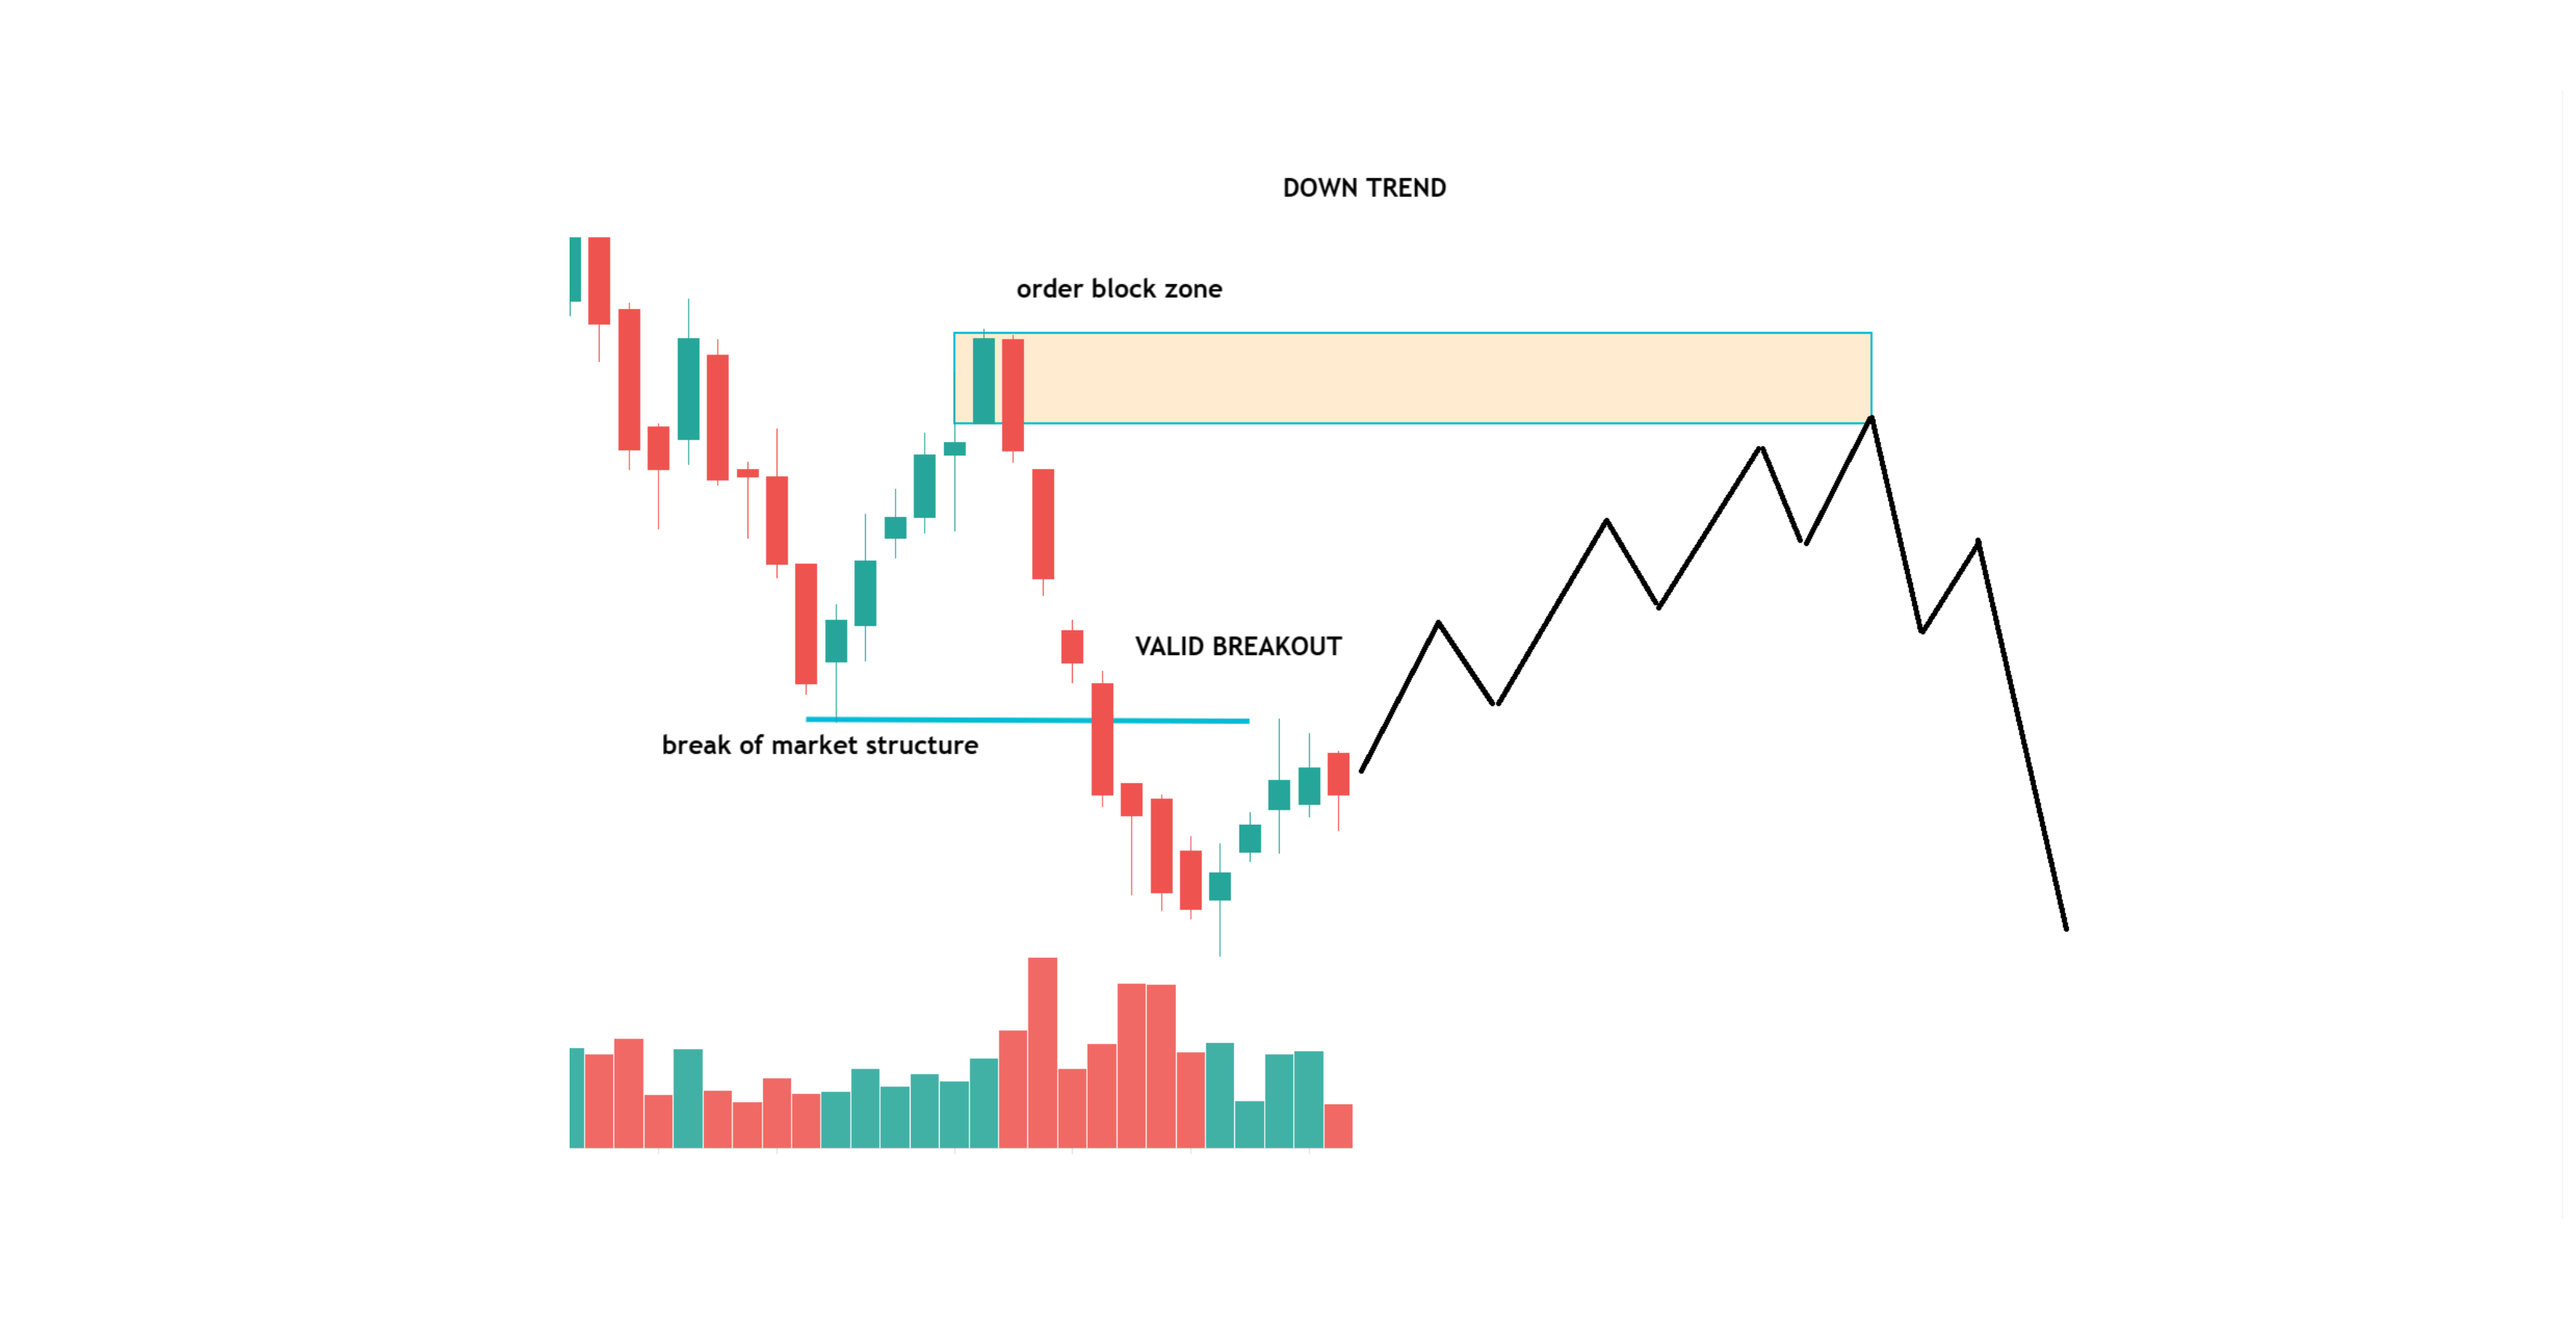
- Swing High (SH): A structural peak flanked by lower highs on either side.
- Swing Low (SL): A structural trough flanked by higher lows on either side.
- Equal Highs (EQH) / Equal Lows (EQL): High-density liquidity pools where retail stop orders concentrate.
5. Liquidity Pools: Where Traders Get Trapped
Liquidity accumulates in predictable structural zones across all timeframes:
- Above Swing Highs: Houses buy-stop liquidity (stop-losses of short sellers and breakout buy orders).
- Below Swing Lows: Houses sell-stop liquidity (stop-losses of buyers and breakdown sell orders).
- Trendline Liquidity: Multiple touches of a diagonal trendline induce retail traders into positioning. Sweeping the trendline unleashes a sudden cascade of liquidity.
6. Identifying Bullish SFPs
A Bullish SFP occurs during a downtrend or range consolidation when price sweeps below a key swing low, absorbs sell-side liquidity, and violently rejects upward.
Bullish Swing Failure Pattern Setup
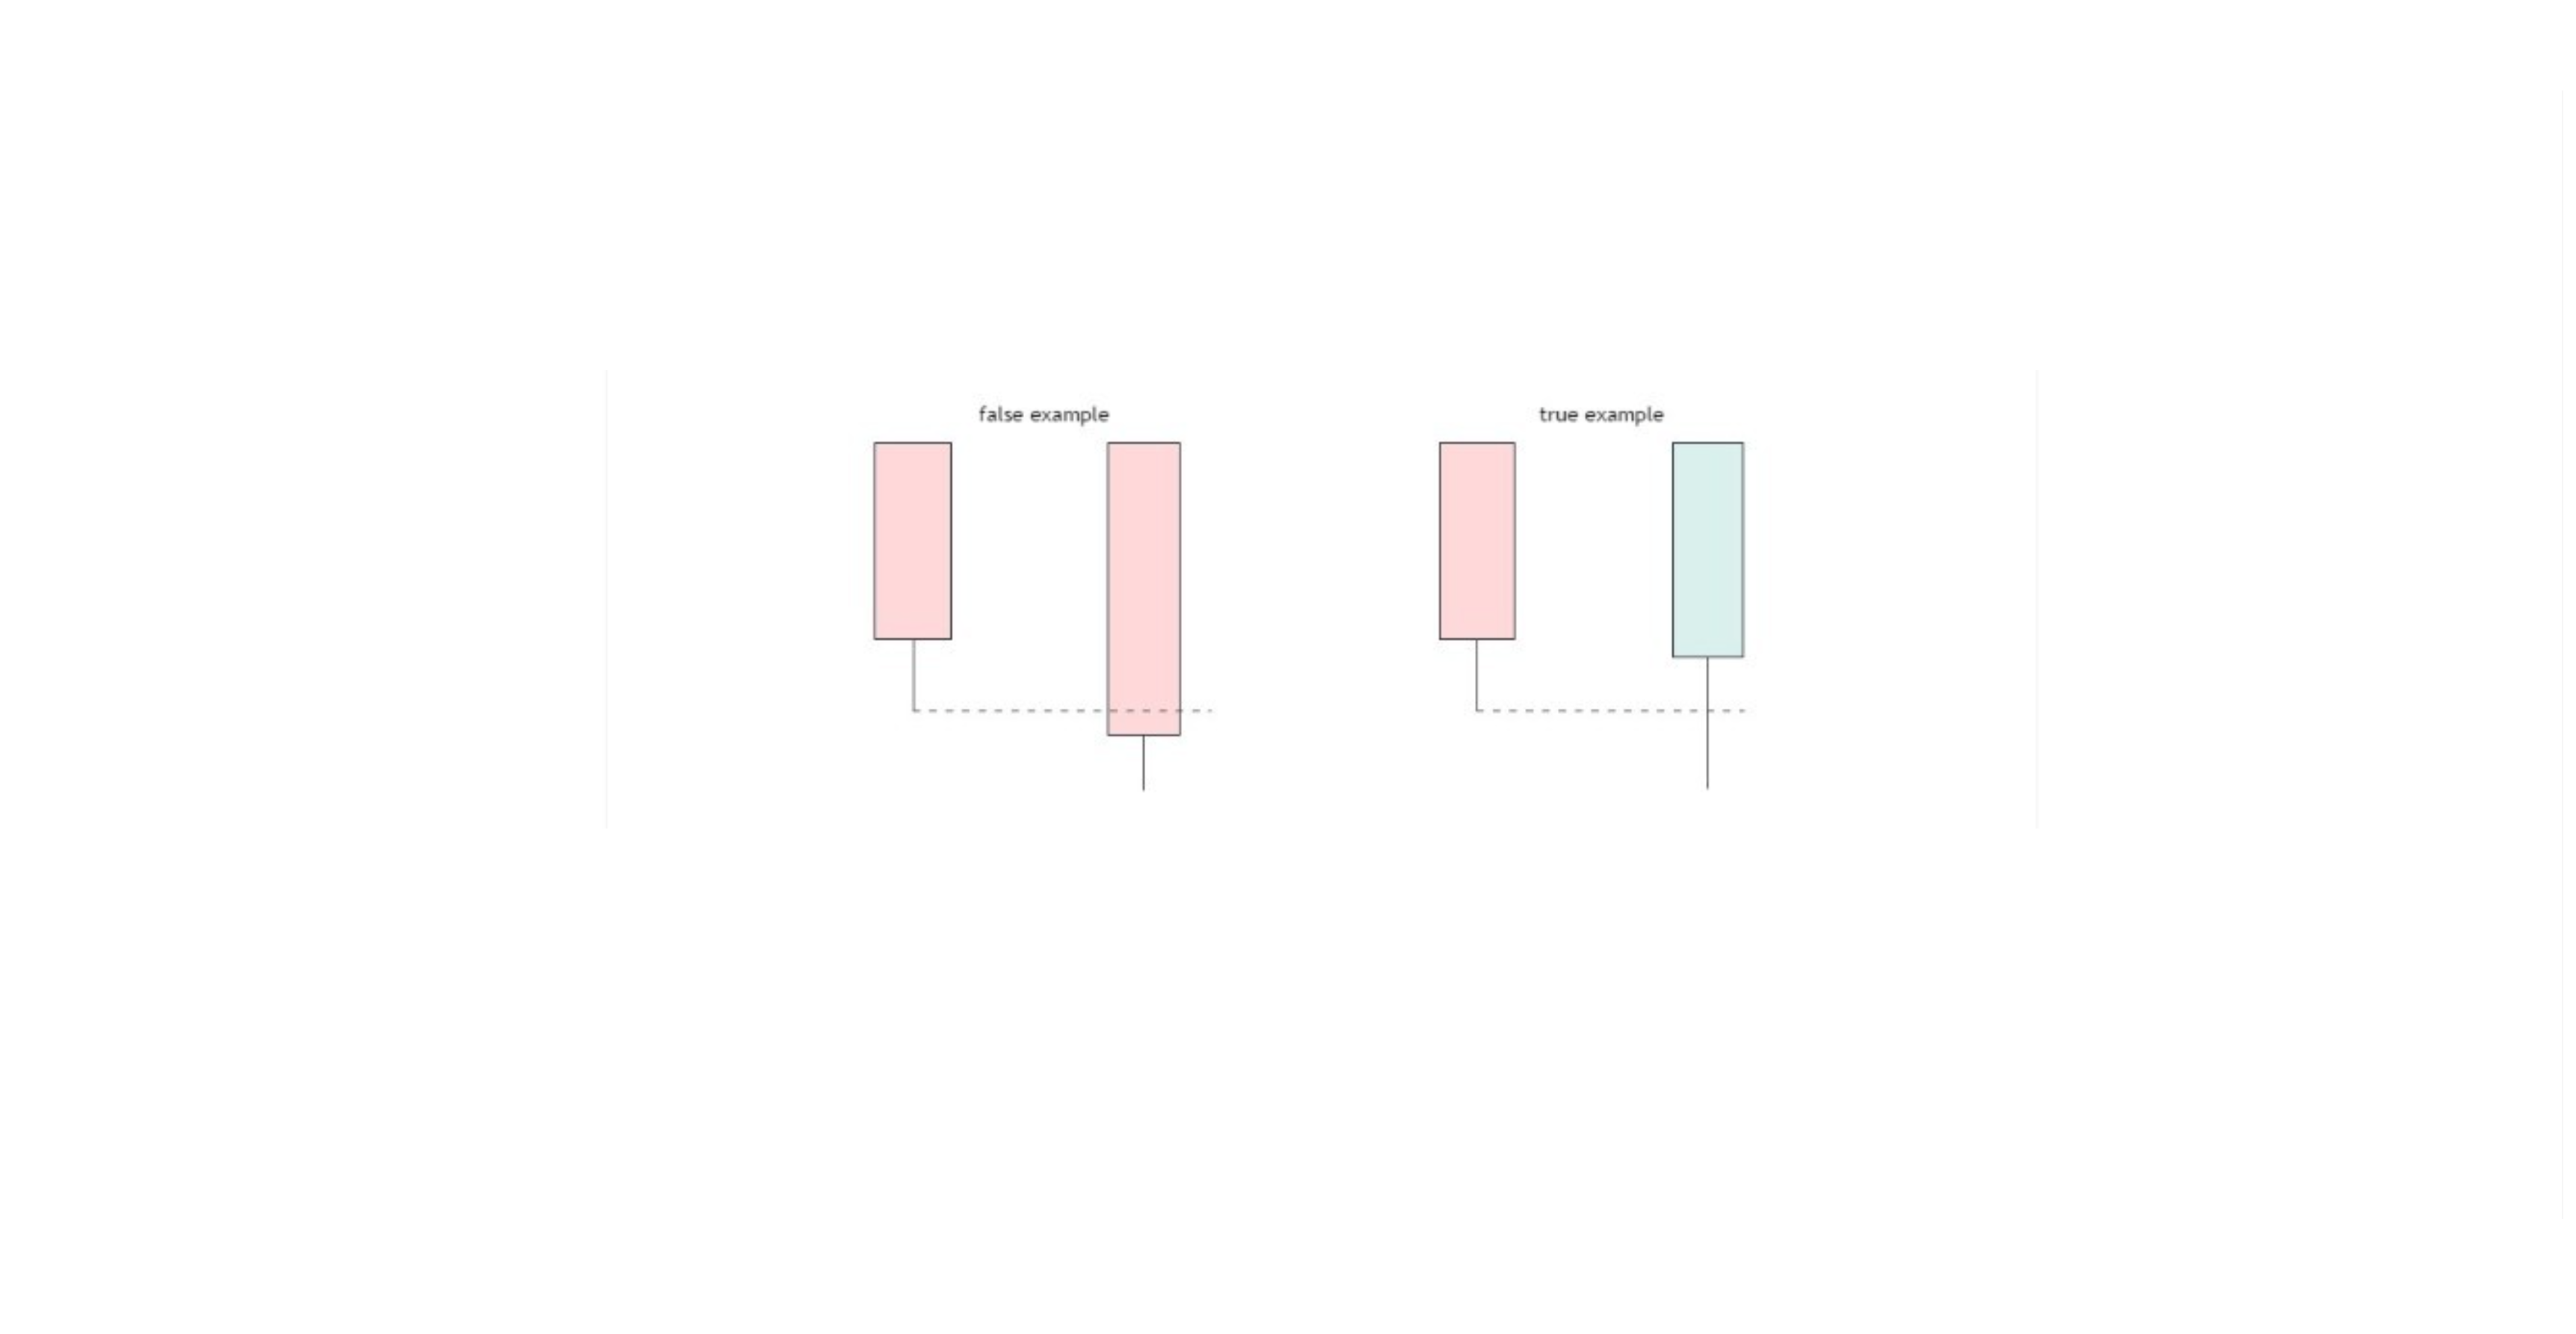
Key Characteristics of a Valid Bullish SFP:
- Price pierces below a previous major swing low or support level.
- A long lower rejection wick forms as buyers step in aggressively.
- The candle body closes firmly back above the broken swing low level.
- Subsequent market structure shifts bullish on lower timeframes.
Trading Insight: The highest-probability Bullish SFPs occur at key HTF support levels, higher timeframe demand zones, or daily/weekly key lows.
7. Identifying Bearish SFPs
A Bearish SFP occurs when price spikes above a key swing high, sweeps buy-side liquidity, and sharply reverses downward.
Bearish Swing Failure Pattern Setup
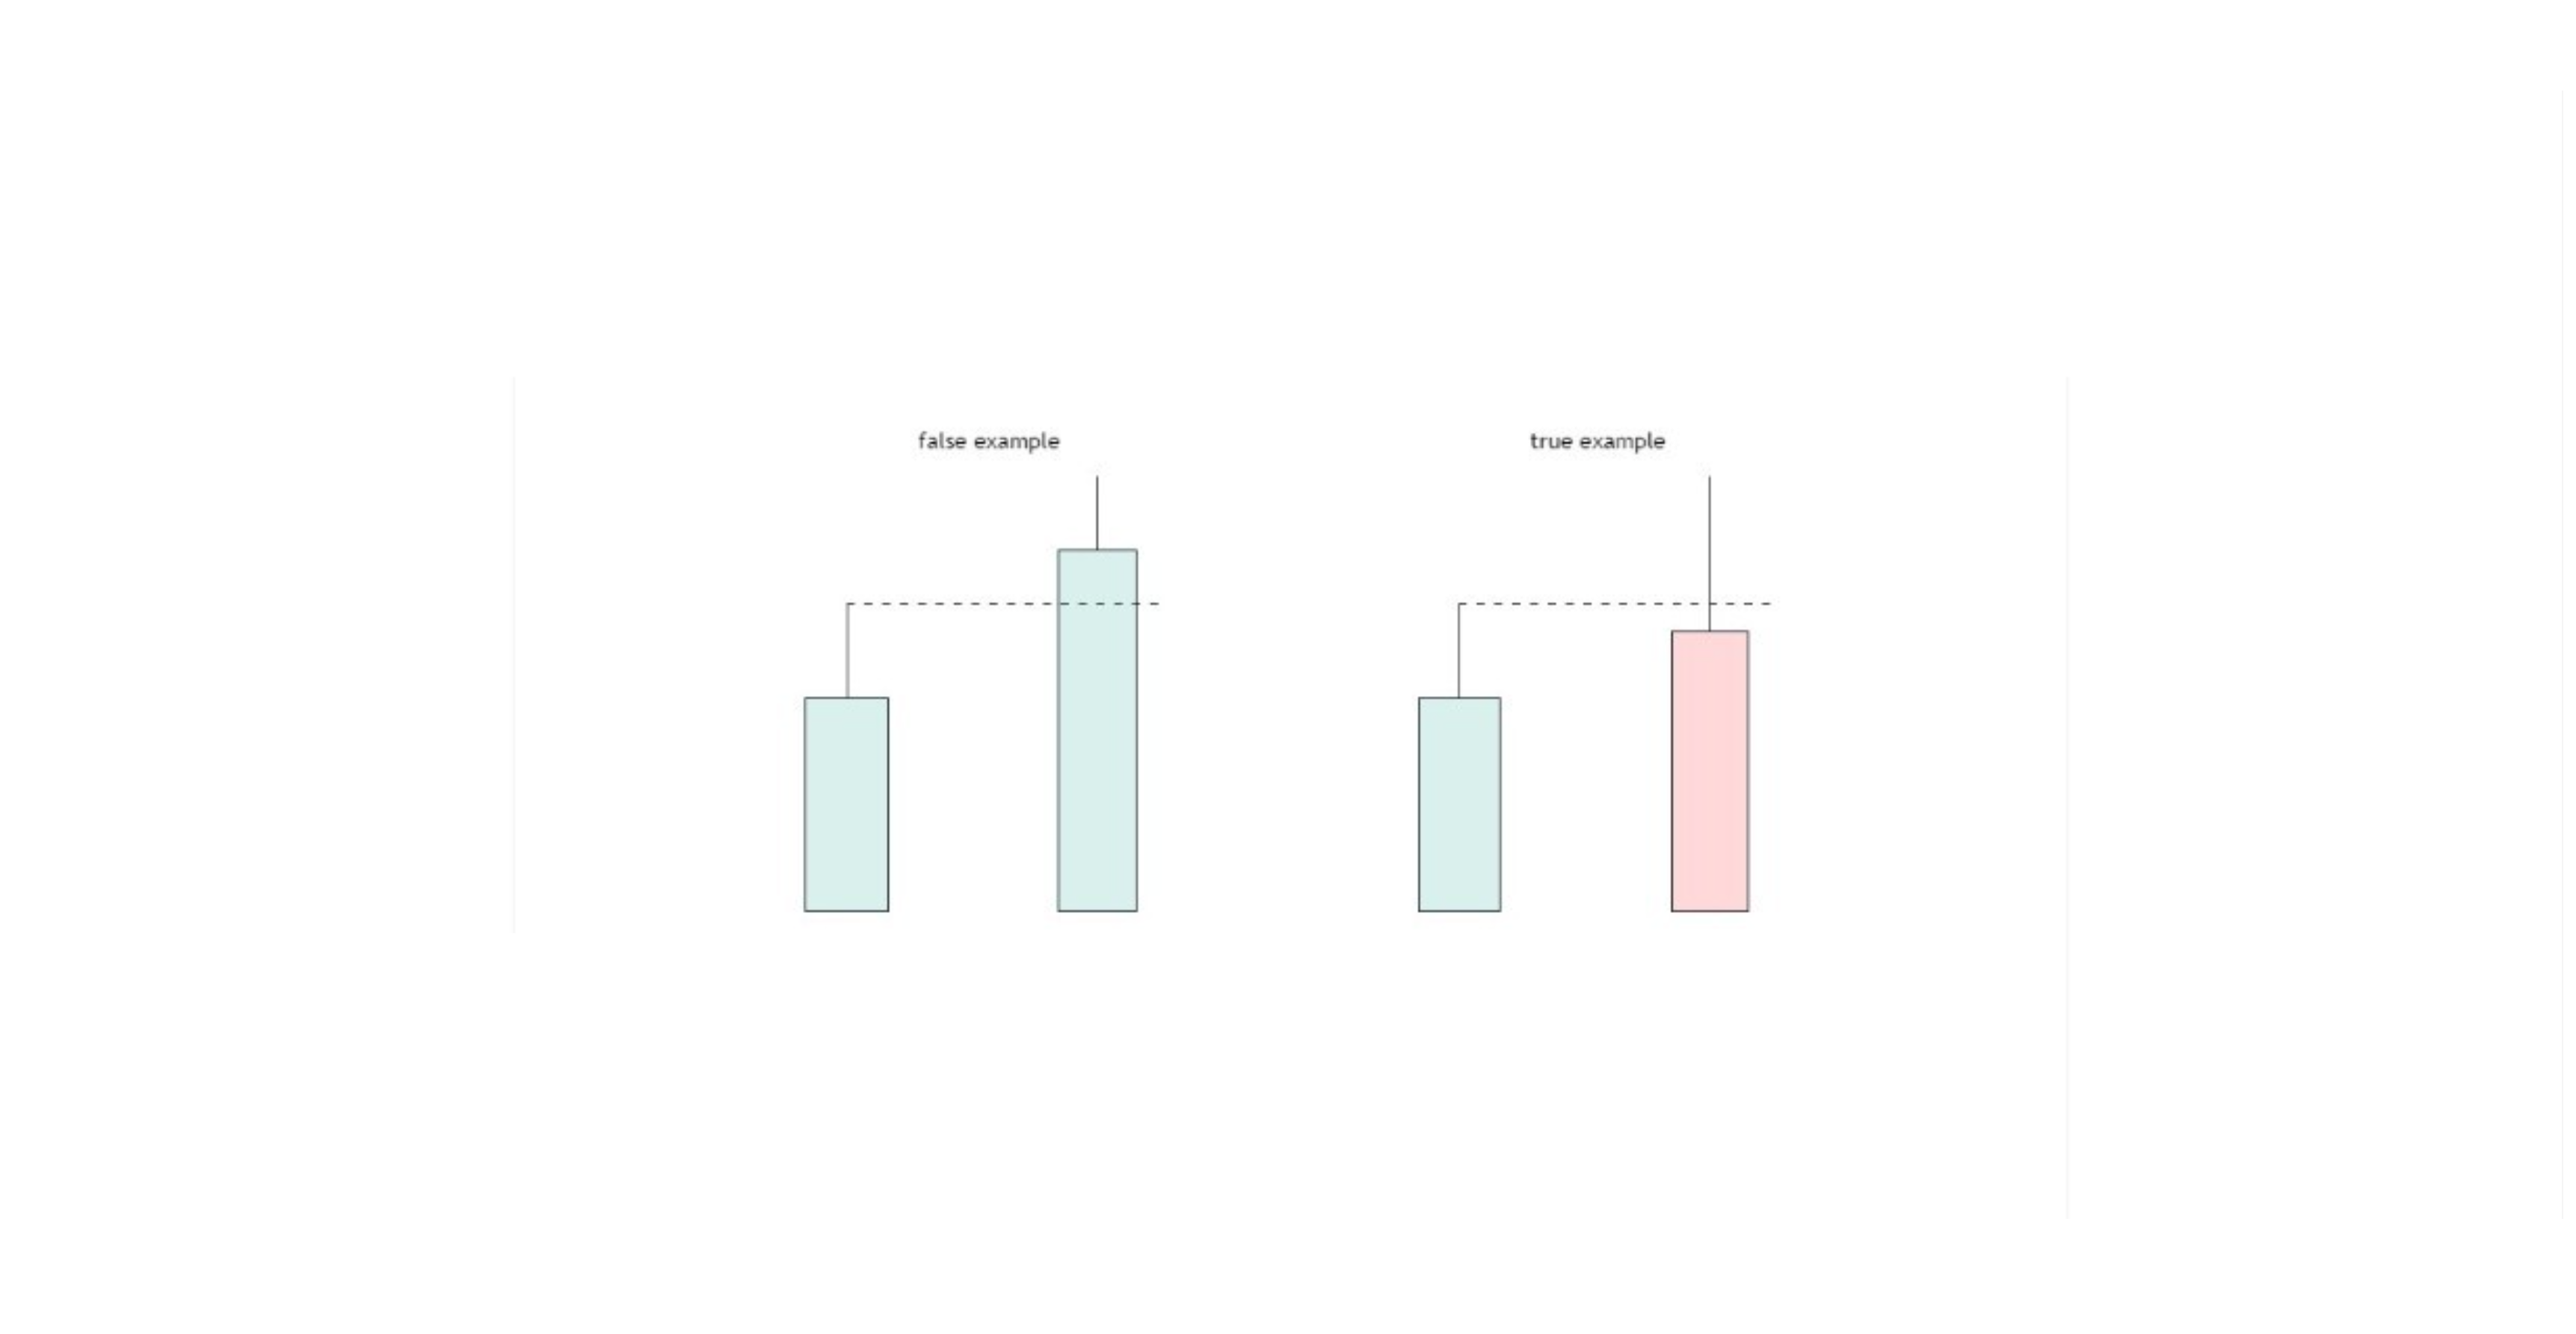
Key Characteristics of a Valid Bearish SFP:
- Price pierces above a previous major swing high or resistance level.
- A long upper rejection wick forms as institutional supply overwhelms buyers.
- The candle body closes firmly back below the broken swing high level.
- Downside momentum accelerates as trapped breakout buyers panic sell.
Trading Insight: The highest-probability Bearish SFPs occur at major HTF supply zones, daily/weekly swing highs, or key liquidity pools.
8. How SFPs Signal Reversals
SFPs act as early momentum warning indicators. Key confirmation elements include:
- Wick Ratio: The rejection wick length should ideally be 2x to 3x larger than the candle body.
- Range Re-entry: The candle close MUST return inside the broken range structure.
- Volume Confirmation: High volume spikes on the sweep candle confirm institutional participation and absorption.
- Orderflow Shift: A lower timeframe Change in State of Delivery (CISD) or Market Structure Break (MSB) validates direction.
9. High-Probability SFP Execution Strategy
Rejection & Close Validation
- Bullish SFP
- Sweep Action: Sweeps below Swing Low
- Confirmation Requirement: Candle close back above Swing Low
- Optimal Zone: HTF Demand / Discount Zone
- Bearish SFP
- Sweep Action: Sweeps above Swing High
- Confirmation Requirement: Candle close back below Swing High
- Optimal Zone: HTF Supply / Premium Zone
Volume Confirmation Filter
- High Rejection Volume: Confirms smart money absorption.
- Low Breakout Volume: Signals a weak false breakout prone to immediate failure.
10. Key Takeaways & Execution Checklist
- SFPs are liquidity sweeps: Never treat a swing high/low breach as a guaranteed breakout until the candle close confirms acceptance.
- Candle close is king: A valid SFP requires a candle body close inside the prior range. If the body closes outside, the breakout may be legitimate.
- Higher timeframes equal higher reliability: 1-Hour, 4-Hour, and Daily SFPs offer significantly stronger reversal signals than 1-Minute or 5-Minute noise.
- Always confluence with structure: Align SFPs with Fair Value Gaps (FVGs), Order Blocks, and session liquidity windows for maximum probability.
- Protect your positions: Place protective stop-losses just beyond the SFP rejection wick tip to prevent premature stopouts.