
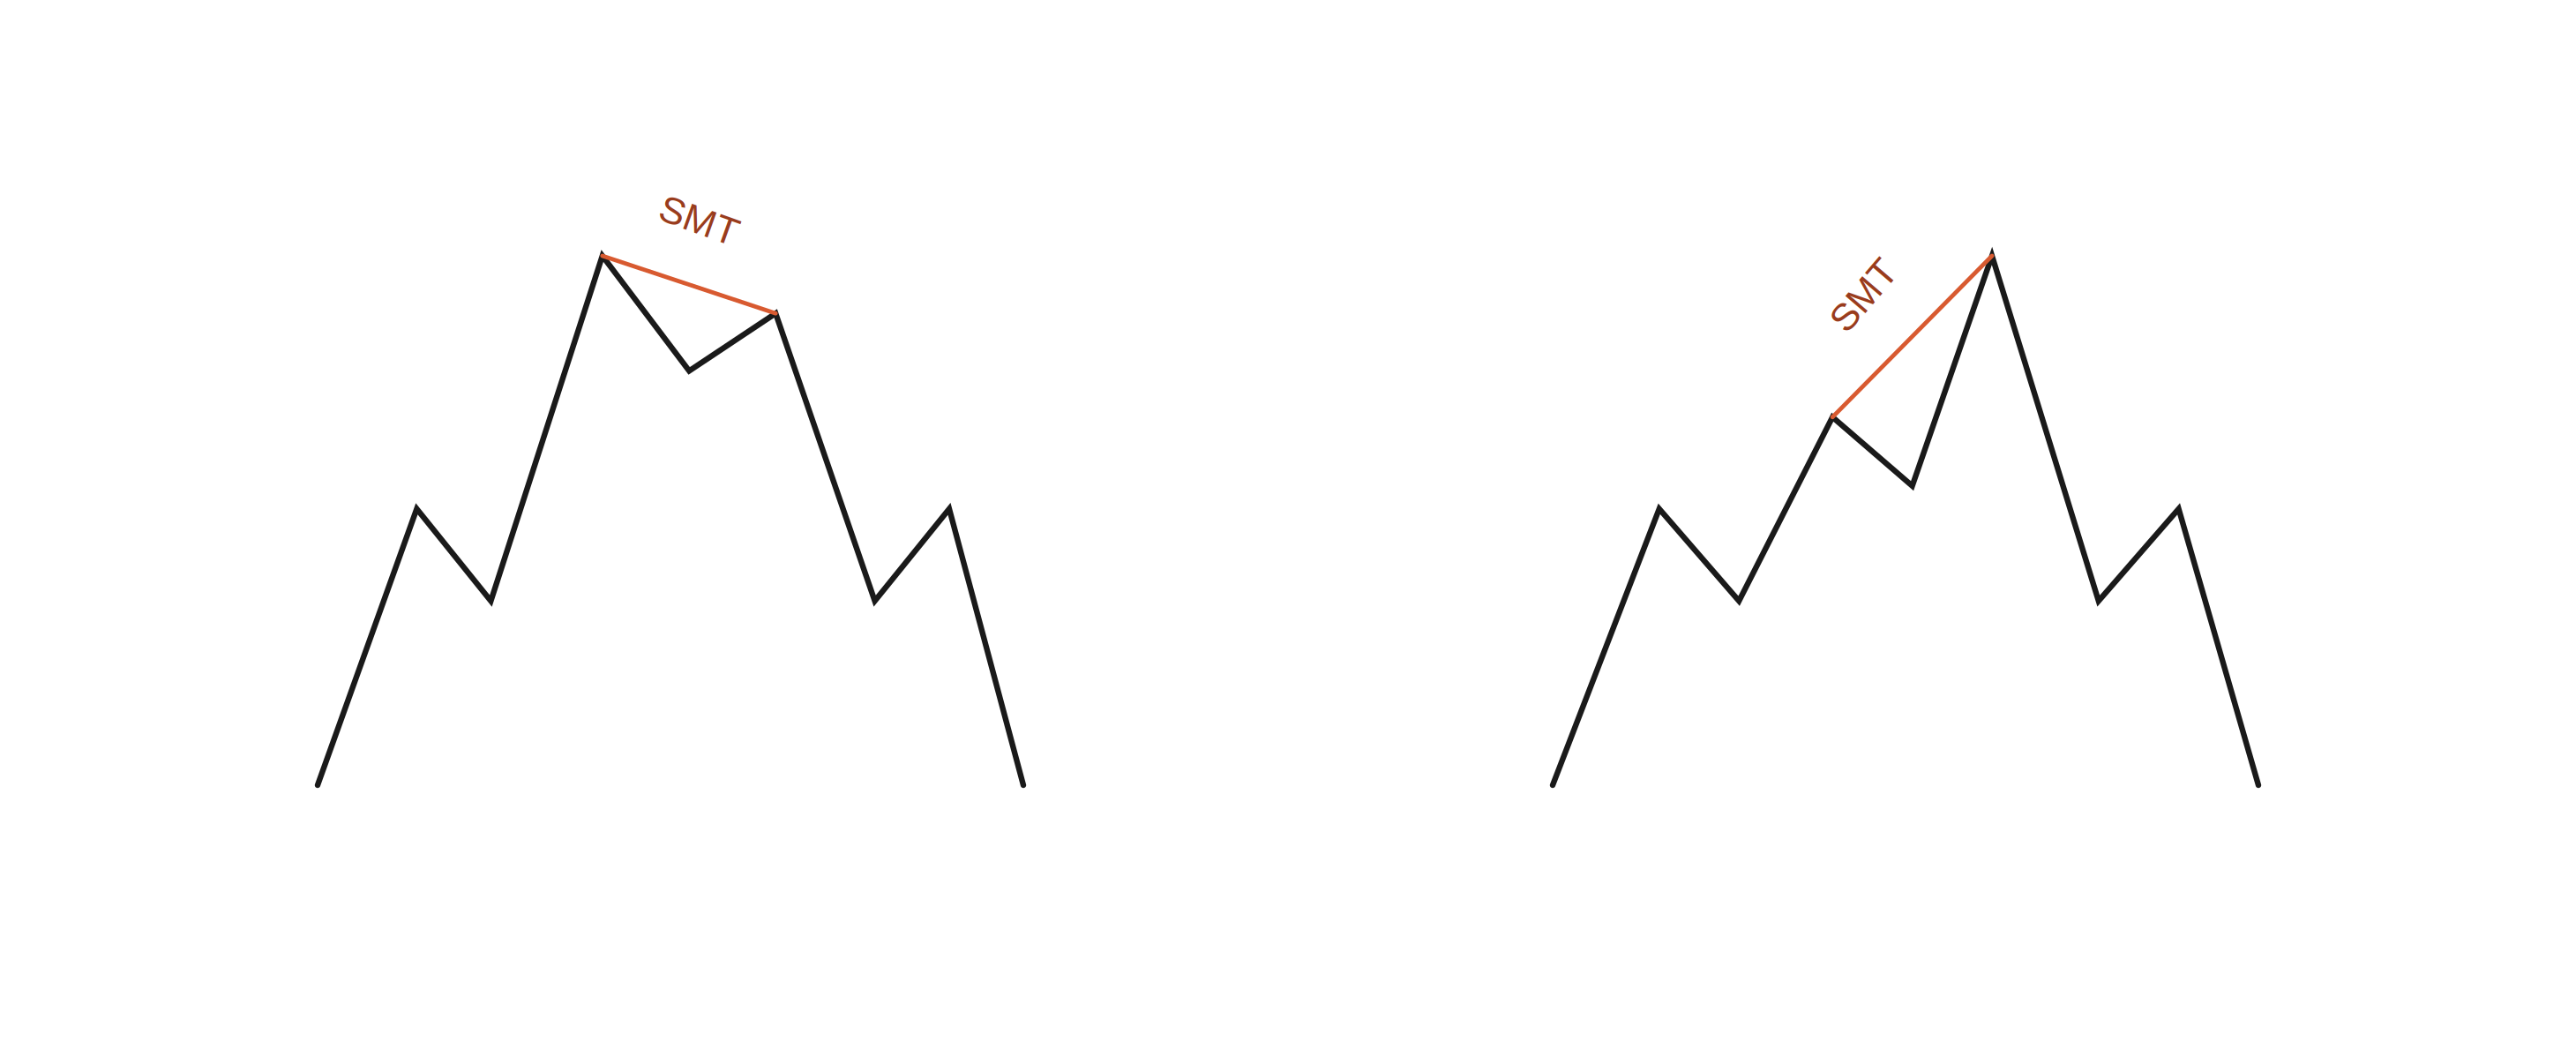
Smart Money Technique (SMT) Divergence is one of the most powerful institutional concepts in modern technical analysis. Developed within Smart Money Concepts (SMC) and Inner Circle Trader (ICT) methodologies, SMT divergence identifies subtle non-confirmations between closely correlated financial instruments. By pinpointing where two synchronized assets fail to move in tandem, professional traders can unmask institutional liquidity manipulation, spot imminent trend reversals, and execute high-probability trades alongside smart money.
SMT Divergence Concept

1. Definition and Importance of SMT Divergence
SMT Divergence occurs when two or more historically correlated markets fail to confirm each other's price action at key market structure turning points (highs or lows).
In balanced, healthy markets, correlated instruments move in tight synchronization. For instance, when the U.S. Dollar Index (DXY) pushes into a lower low, major dollar-paired currencies like EUR/USD and GBP/USD typically rally into higher highs. When an institutional player is actively accumulating or distributing massive order volume, one of these correlated pairs will absorb liquidity differently, causing a structural breakdown in correlation—known as an SMT Divergence.
Why SMT Divergence is Critical for Traders
- Reveals Institutional Footprints: Large financial institutions cannot enter or exit multi-million dollar positions without leaving subtle order flow clues across asset classes.
- Exposes Liquidity Manipulation: SMT divergence highlights where institutional algorithms intentionally push one asset past key liquidity levels (stop-hunting) while shielding a stronger correlated asset.
- Provides Early Reversal Warnings: Non-confirmation between correlated markets frequently precedes major price reversals, offering early entry signals before structural market shifts (BOS/CHoCH) become obvious to the broader retail crowd.
2. The Relationship Between Correlated Markets
To effectively trade SMT divergence, traders must understand the core market relationships and intermarket dynamics that drive financial markets:
- Forex Currency Pairs: Major currency pairs tied to a common base or quote currency exhibit strong correlations. For example, EUR/USD and GBP/USD generally move upward together when the U.S. Dollar weakens. If EUR/USD breaks to a new swing high while GBP/USD fails to reach a new high, an SMT divergence signals potential institutional distribution in the currency market.
- Equity Indices: Stock market benchmarks like the S&P 500 (ES), NASDAQ 100 (NQ), and Dow Jones (YM) move in close alignment. Divergences among these three indices provide vital clues regarding institutional sector rotation and broad market health.
- Bonds and Yields: Fixed-income markets (such as US 10-Year Treasury Yields) maintain powerful macro correlations with foreign exchange and stock indices. Discrepancies between bond yield direction and currency trends often signal macroeconomic repositioning by central banks and hedge funds.
- Commodities and Equities: Commodities like Crude Oil and Gold frequently correlate with specialized stock sectors or commodity-backed currencies (e.g., AUD/USD or USD/CAD). Non-confirmations between raw commodities and sector ETFs highlight market inefficiencies.
3. SMT Types and Technical Patterns
SMT divergence is broadly categorized into two structural patterns (Bullish SMT and Bearish SMT) and two inter-asset classifications (Intermarket SMT and Intramarket SMT).
3.1. Bullish SMT Divergence
Bullish SMT Divergence occurs during a market downtrend or pullback when one correlated asset creates a lower low, while the secondary correlated asset forms a higher low.
Bullish SMT Divergence
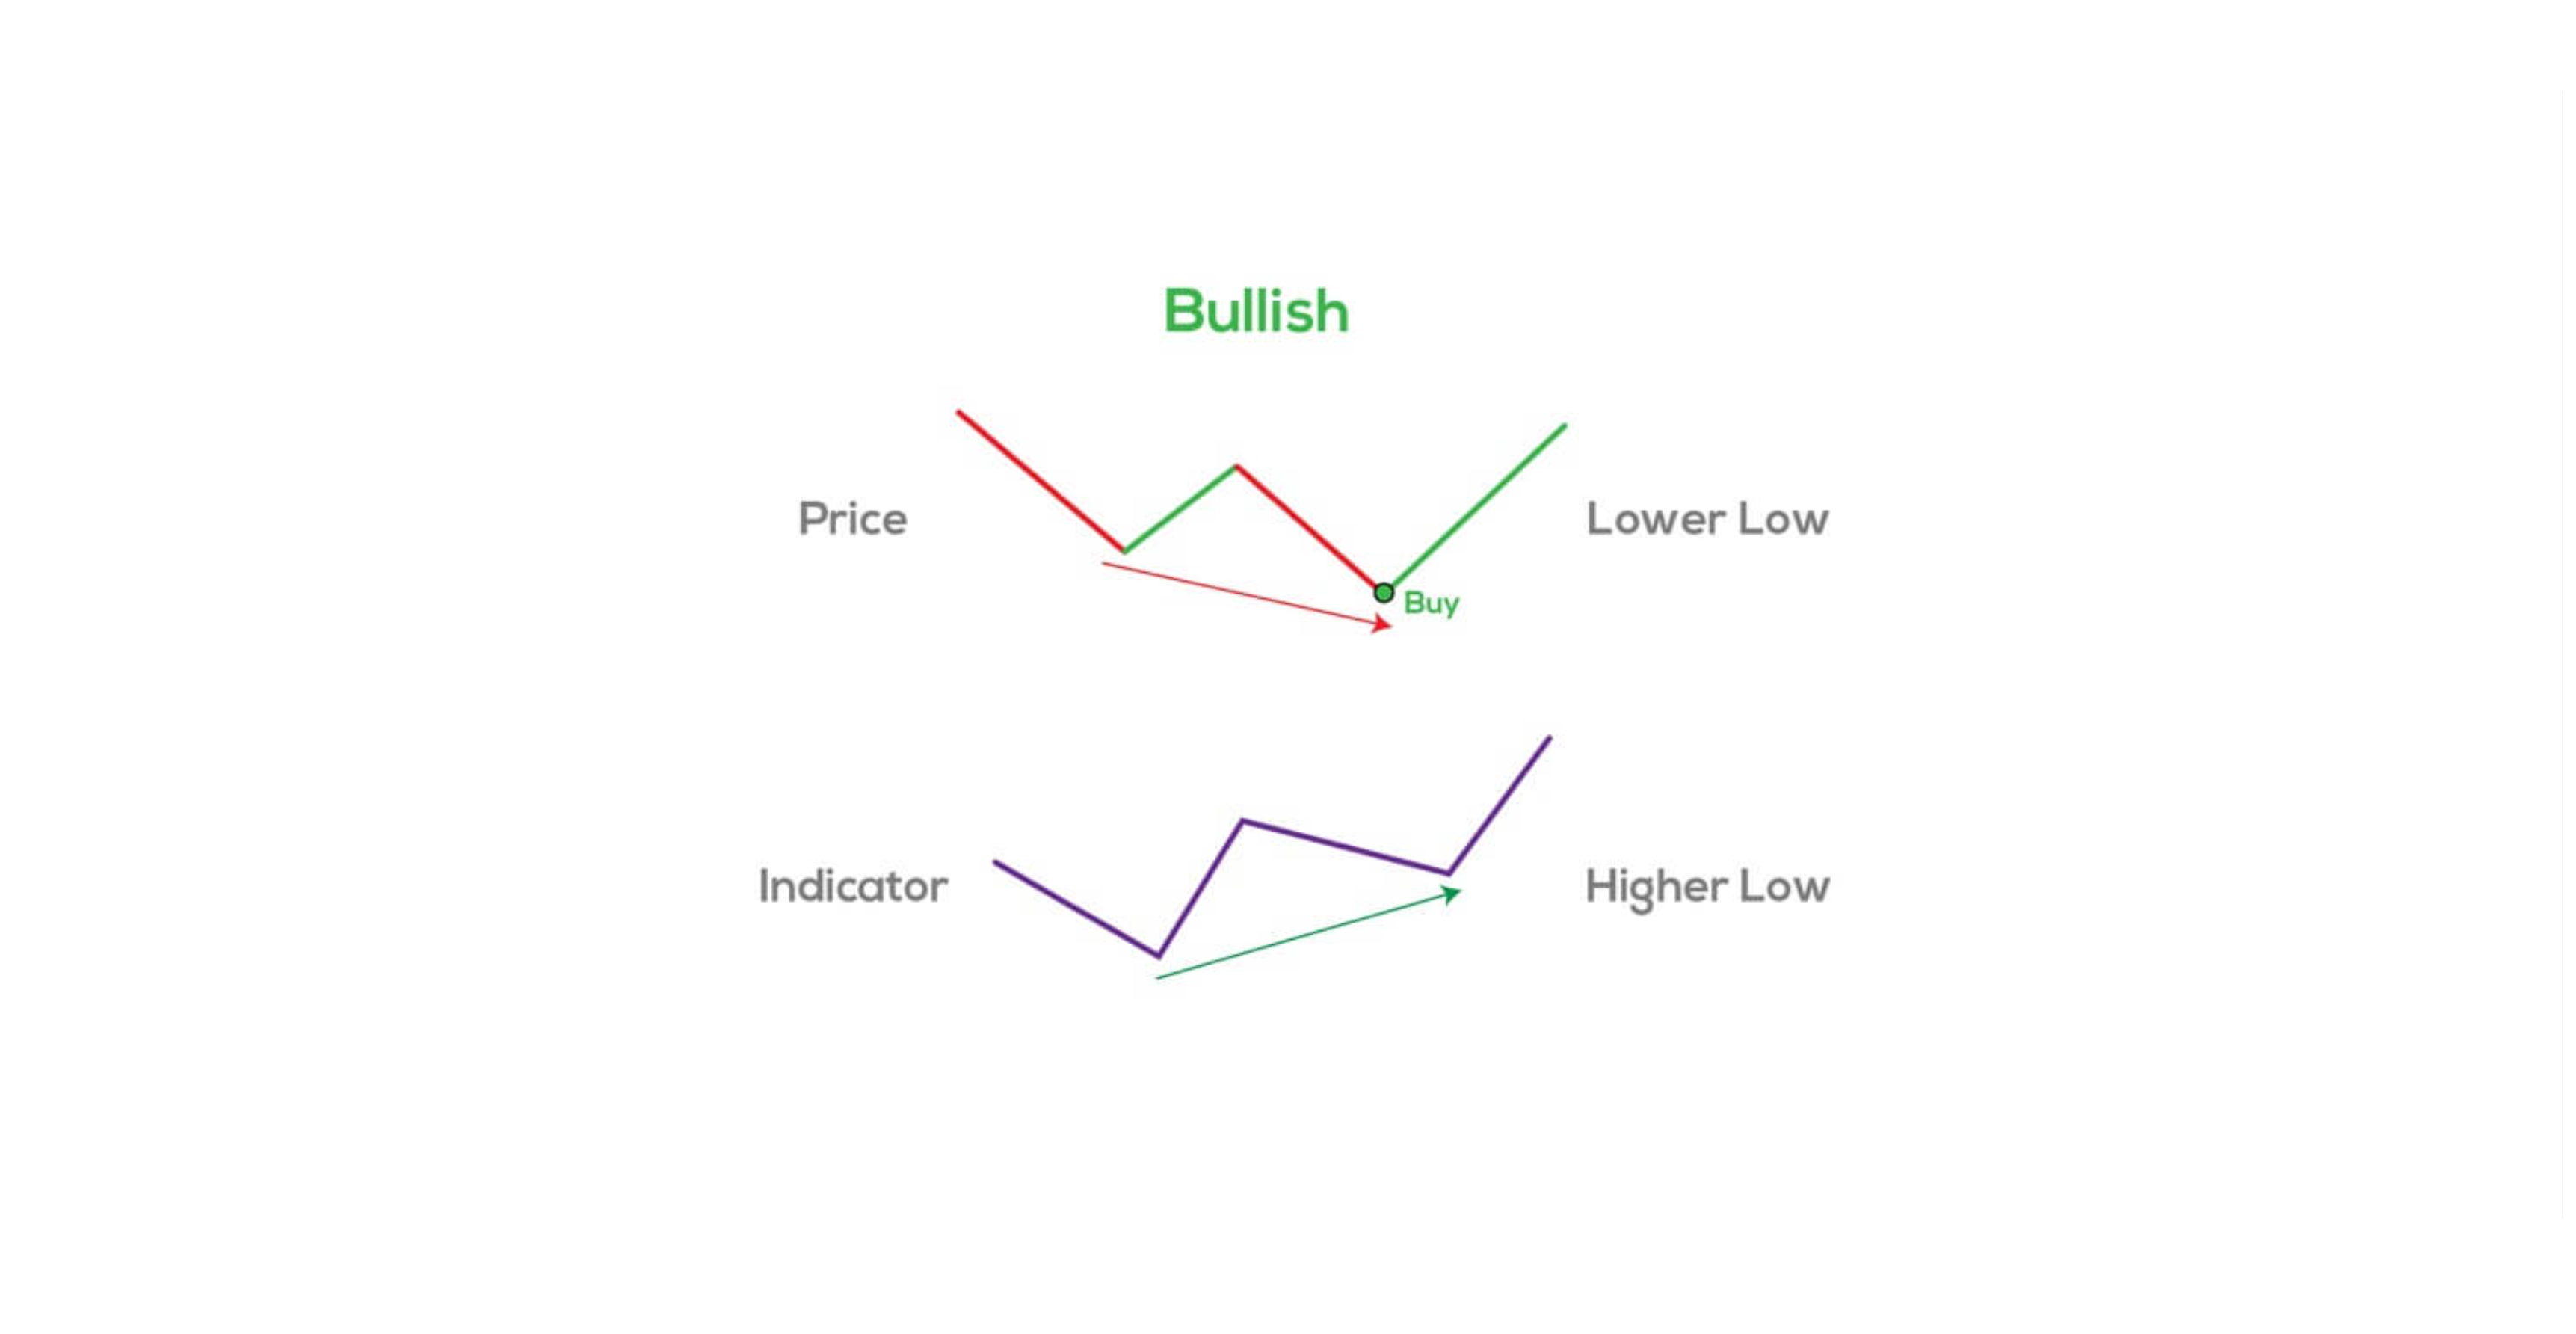
This pattern reveals hidden underlying strength in the asset making the higher low. Institutions are actively absorbing sell orders and supporting price, indicating that the weaker asset's lower low was merely an engineered liquidity grab (stop sweep) before an explosive upward reversal.
How to Identify and Spot Bullish SMT Divergences:
- Select Correlated Assets: Pair two closely tied instruments (e.g., EUR/USD vs. GBP/USD or NQ vs. ES).
- Locate Key Swing Lows: Track price as both assets approach prominent historical demand zones or sell-side liquidity pools.
- Identify Structural Divergence: Confirm when Asset A pushes below its previous swing low (creating a Lower Low), while Asset B holds above its previous low (forming a Higher Low).
- Confirm with Order Flow & Price Action: Look for immediate displacement, fair value gaps (FVG), or bullish market structure shifts (MSS/CHoCH) on the stronger asset to confirm institutional entry.
3.2. Bearish SMT Divergence
Bearish SMT Divergence occurs during an uptrend when one correlated asset pushes into a higher high, while the secondary correlated asset forms a lower high.
Bearish SMT Divergence
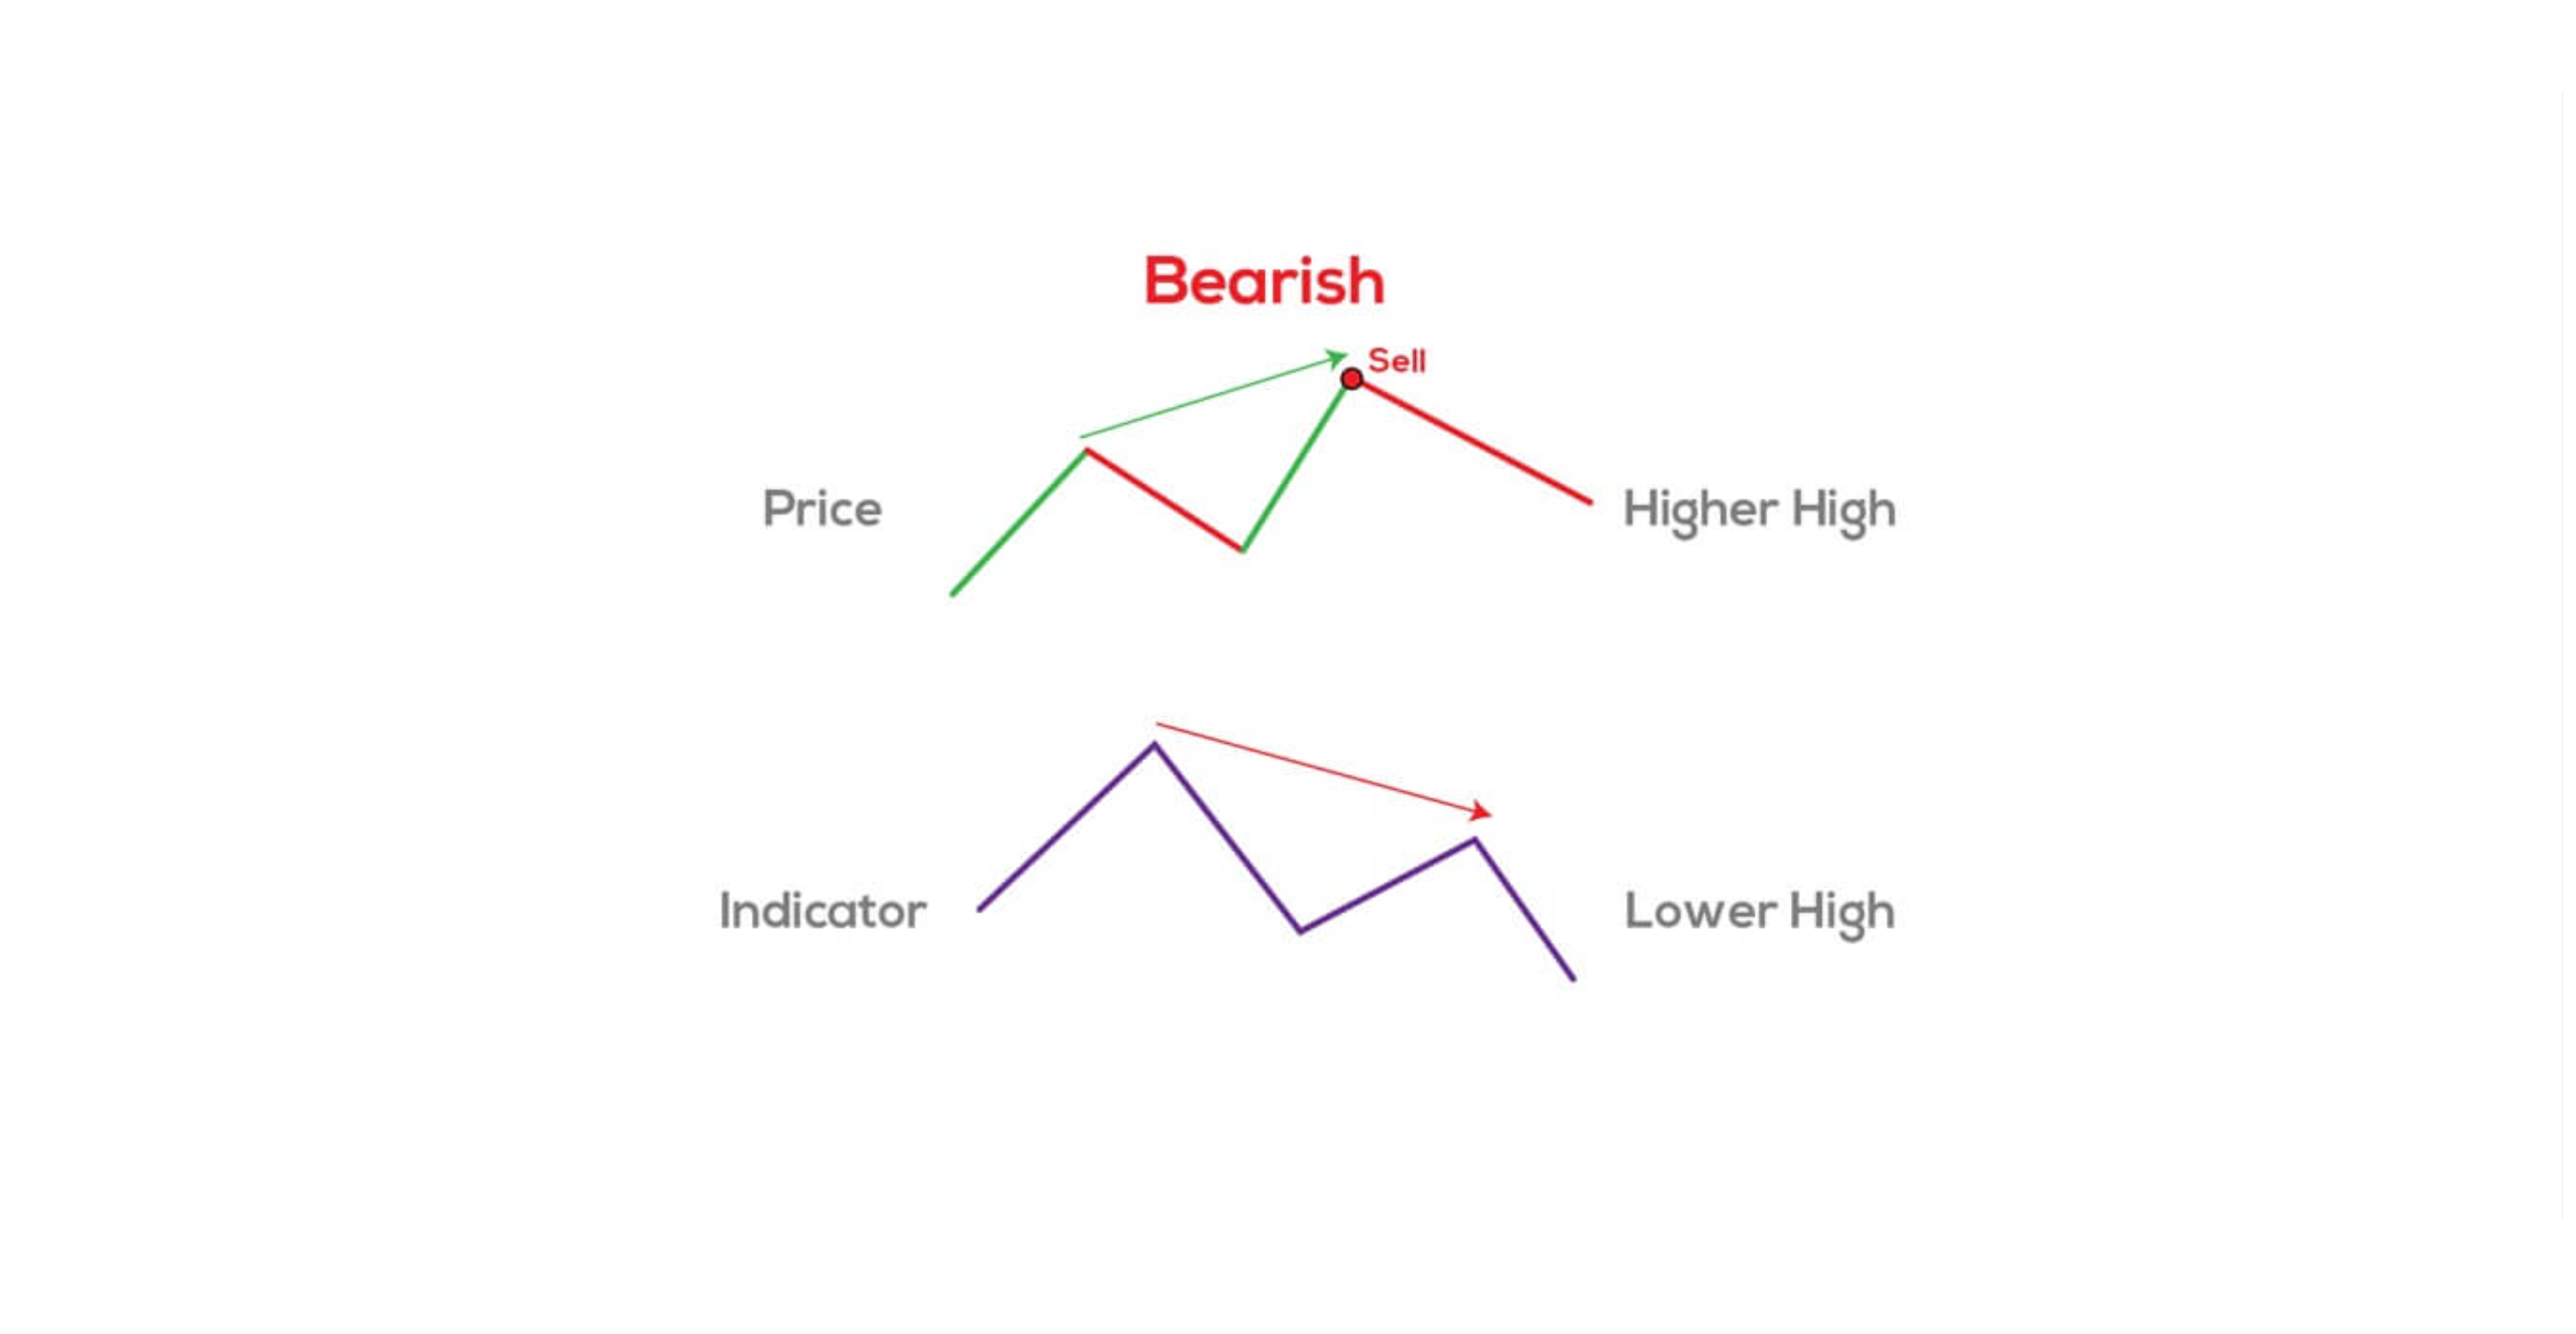
This non-confirmation signals hidden weakness. Institutions are using the asset making the higher high to sweep buy-side liquidity (retail breakout buyers and buy-stops) while distributing short positions into the market.
How to Identify and Spot Bearish SMT Divergences:
- Select Correlated Assets: Compare benchmark pairs like NASDAQ 100 (NQ) vs. S&P 500 (ES).
- Monitor Resistance & Buy-Side Liquidity: Watch as price approaches key swing highs or institutional order blocks.
- Spot the Non-Confirmation: Asset A breaks to a new Higher High, while Asset B fails to expand and prints a Lower High.
- Validate Institutional Distribution: Confirm the setup when price aggressively rejects from resistance and breaks internal bullish structure to the downside.
3.3. Intermarket SMT
Intermarket SMT compares correlated assets across entirely different asset classes, such as Foreign Exchange vs. Stock Indices, Equities vs. Treasury Bonds, or Commodities vs. Currencies.
Intermarket SMT Divergence
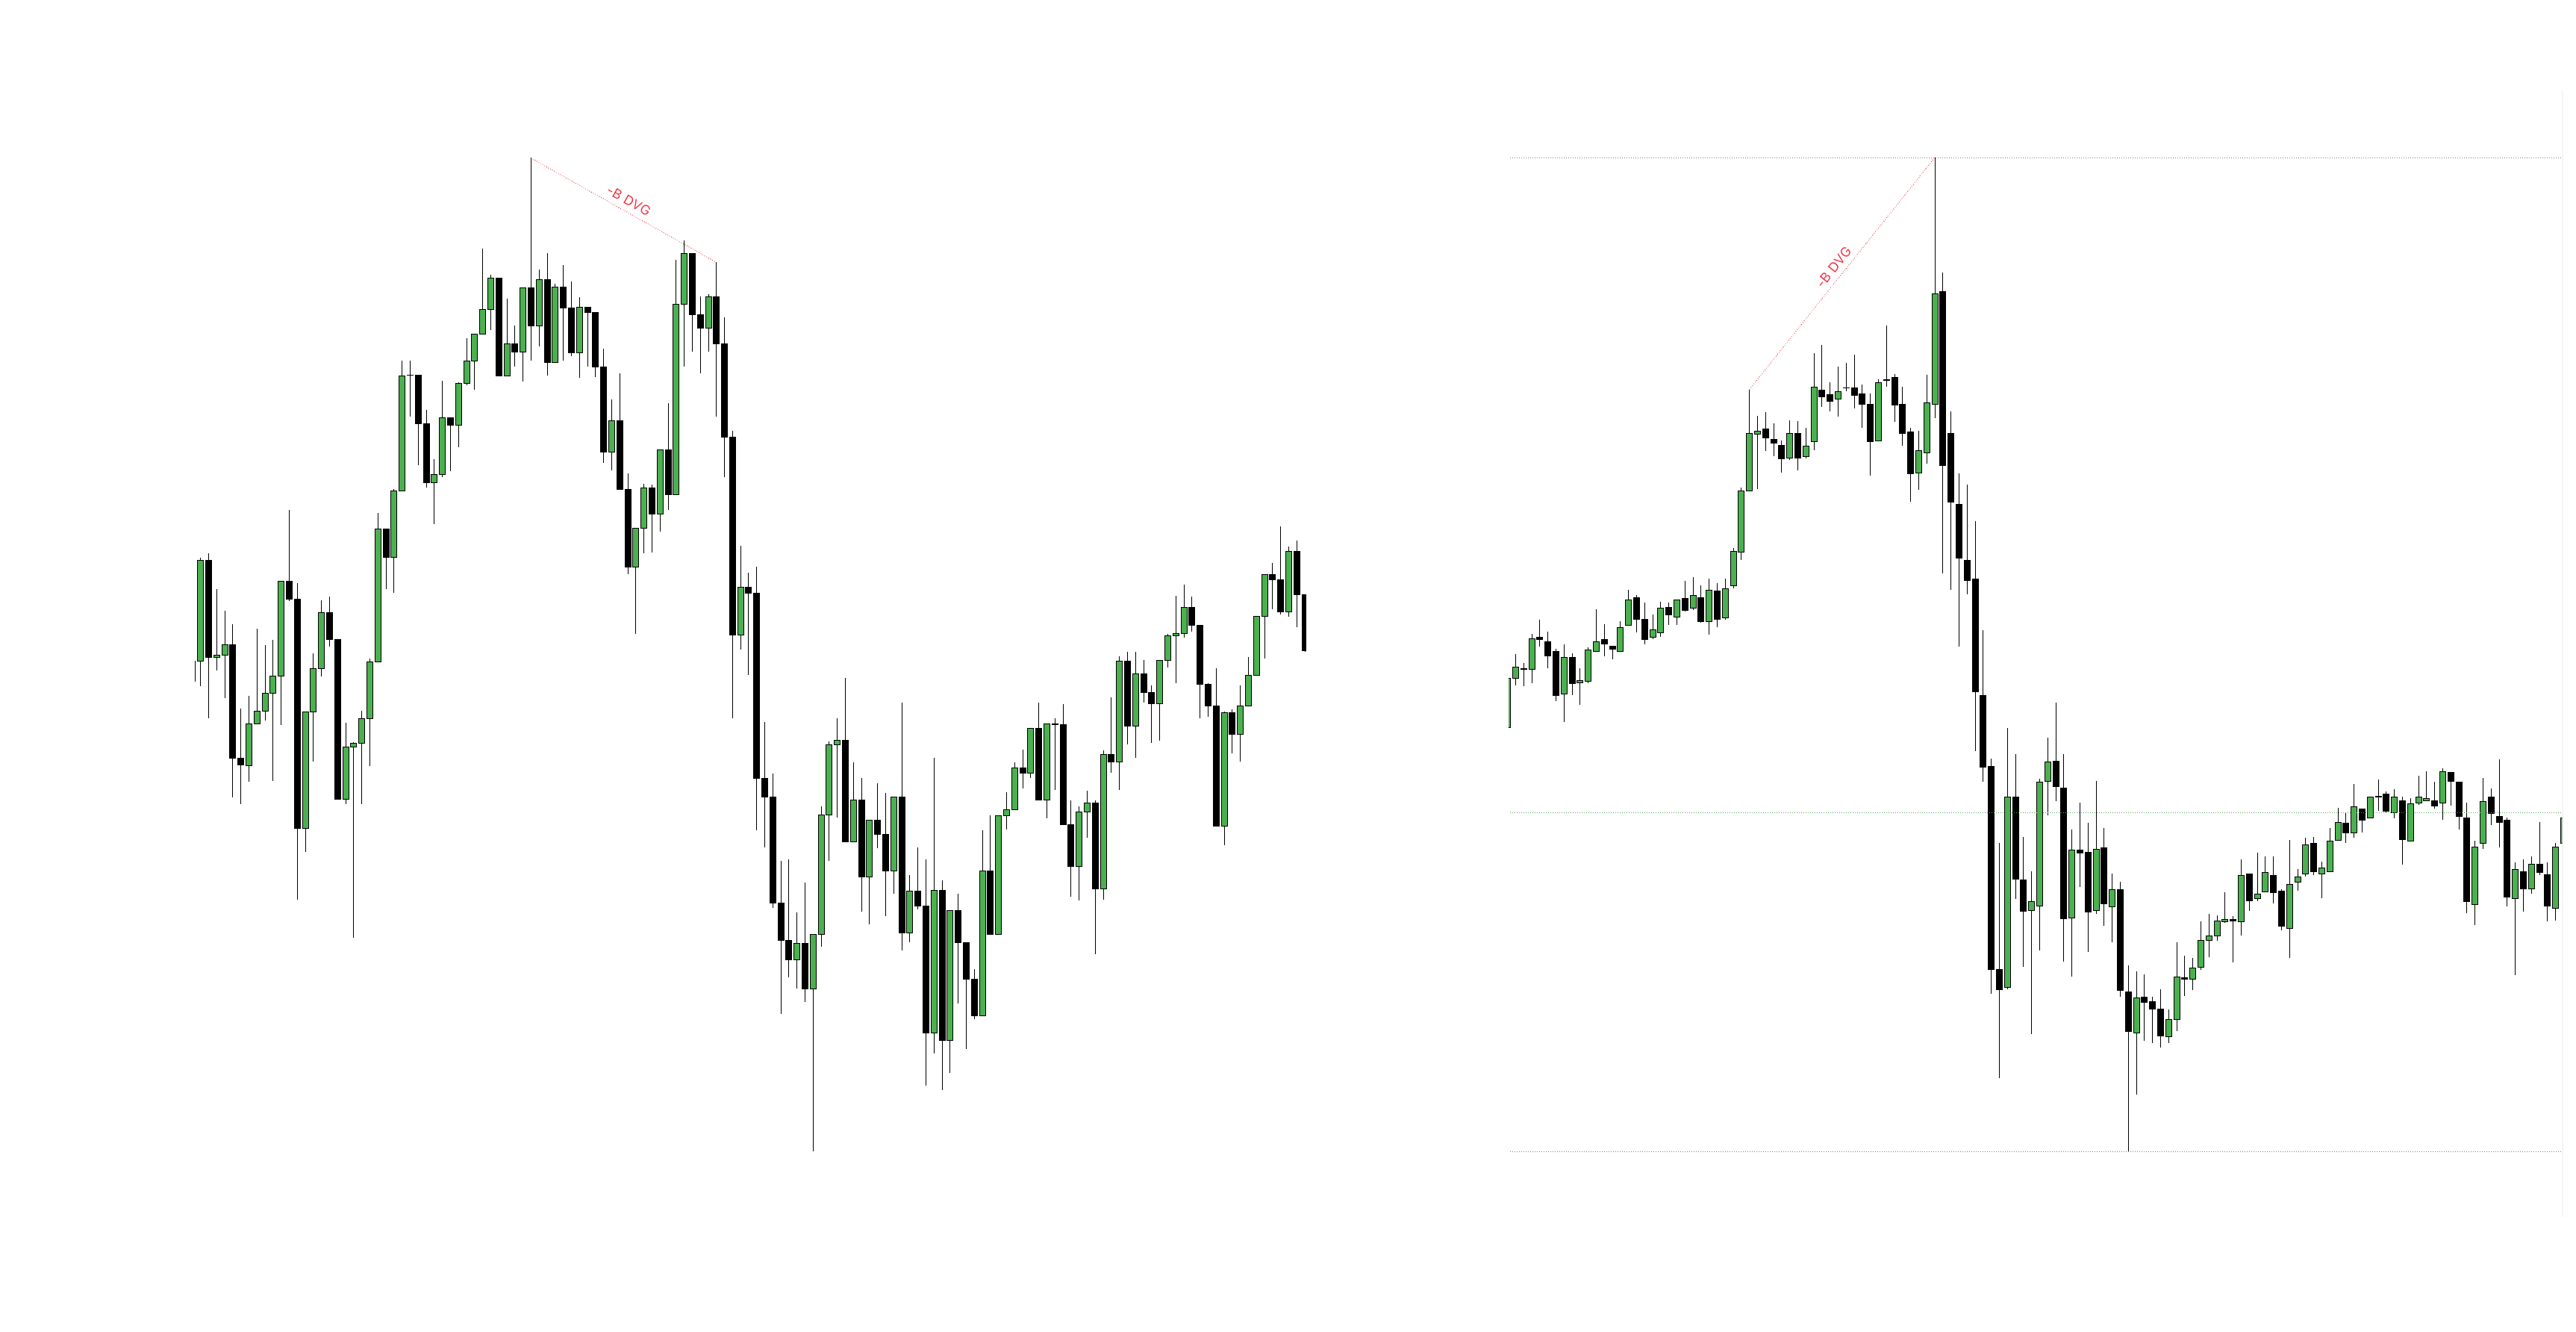
High-Probability Intermarket Examples:
- EUR/USD vs. DXY (U.S. Dollar Index): Because EUR/USD constitutes over 57% of the DXY basket, they maintain an inverse correlation. If DXY makes a new higher high but EUR/USD fails to make a lower low, an Intermarket Bullish SMT is present.
- S&P 500 vs. 10-Year US Treasury Yields (TNX): Non-confirmations between stock market rallies and bond yield movements signal macro hedging by institutional funds.
Institutional Validity:
Intermarket SMT carries extremely high statistical reliability because institutional asset managers hedge and rebalance massive capital across multi-asset portfolios simultaneously.
3.4. Intramarket SMT
Intramarket SMT occurs when analyzing correlated assets within the exact same market or asset class.
High-Probability Intramarket Examples:
- EUR/USD vs. GBP/USD: Comparing two major European currencies against the U.S. Dollar.
- NASDAQ (NQ) vs. S&P 500 (ES) vs. Dow Jones (YM): Comparing major U.S. equity futures indices.
Institutional Validity:
Intramarket SMT is highly effective for intraday scalping and day trading. To maximize win rates, traders should always combine Intramarket SMT with higher-timeframe order blocks and session liquidity sweeps.
4. SMT Divergence vs. RSI Divergence
Many retail traders confuse Smart Money Technique divergence with classic indicator momentum divergence (such as the Relative Strength Index / RSI). However, structural differences make SMT far superior in live market environments.
Why SMT Outperforms Traditional RSI Divergence
- Underlying Metric
- Traditional RSI Divergence: Mathematical oscillator momentum
- SMT Divergence (Smart Money Technique): Real intermarket price structure & liquidity
- Institutional Signal
- Traditional RSI Divergence: Easily manipulated by strong trends
- SMT Divergence (Smart Money Technique): Directly exposes institutional order flow
- Overbought/Oversold Trap
- Traditional RSI Divergence: RSI can remain overbought/oversold for weeks
- SMT Divergence (Smart Money Technique): SMT highlights exact liquidity sweeps & structural failures
- Context & Accuracy
- Traditional RSI Divergence: High rate of false signals in strong trends
- SMT Divergence (Smart Money Technique): High-probability reversal signals anchored to real market assets
How Smart Money Manipulates RSI Traders
Traditional RSI indicators measure price velocity over a fixed lookback period. In strong trending markets, institutions routinely engineer false RSI divergences to induce retail traders into taking counter-trend positions. Smart money then sweeps retail stop-losses to fuel the ongoing trend.
In contrast, SMT divergence compares real market assets against each other. Because institutions cannot artificially hide price action across multiple global exchanges at once, SMT provides an unmanipulated window into institutional positioning.
5. Setting Up TradingView for SMT Analysis
To spot SMT divergence efficiently in real-time, traders should monitor correlated instruments side-by-side using multi-chart layouts.
Step-by-Step TradingView Setup Guide:
- Enable Multi-Chart Workspace: Click the Layout Grid icon in the upper-right toolbar of TradingView and select a 2-Chart Vertically Split or 4-Chart Grid layout.
- Synchronize Timeframes & Crosshairs: Open the chart settings menu and enable Sync Symbol, Timeframe, Crosshair, and Interval across all chart panes.
- Align Correlated Symbols: Load your primary asset (e.g., EUR/USD) in Chart 1 and your correlated comparison asset (e.g., GBP/USD or DXY) in Chart 2.
- Compare Swing Highs & Lows: Use vertical crosshair lines to compare the exact timestamp of key structural highs and lows between both instruments.
Recommended Asset Pairs for SMT Divergence Trading:
- Forex Pairs:
EUR/USDvs.GBP/USD|USD/JPYvs.DXY|AUD/USDvs.NZD/USD - Equity Indices:
NQ1!(Nasdaq Futures) vs.ES1!(S&P 500 Futures) vs.YM1!(Dow Futures) - Commodities & Currencies:
XAU/USD(Gold) vs.EUR/USDorUSD/JPY - Crypto Assets:
BTCUSDTvs.ETHUSDT
6. Key Takeaways
- Smart Money Footprint: SMT divergence reveals institutional accumulation and distribution by uncovering structural non-confirmations between correlated markets.
- Bullish SMT Signal: Identified when one correlated asset forms a lower low while another holds a higher low, signaling hidden buying pressure.
- Bearish SMT Signal: Identified when one correlated asset makes a higher high while another prints a lower high, signaling hidden selling pressure.
- Intermarket vs. Intramarket: Intermarket SMT compares different asset classes (e.g., Stocks vs. Bonds), whereas Intramarket SMT compares pairs in the same class (e.g., EUR/USD vs. GBP/USD).
- Superiority to RSI: SMT tracks real market liquidity and intermarket price action rather than lagged mathematical momentum formulas.
- Confluence is Essential: Always trade SMT divergence alongside key Smart Money Concepts—including Higher Timeframe Order Blocks, Fair Value Gaps (FVG), and Market Structure Shifts (MSS).
- Execution & Risk Control: Place stop-losses safely beyond the liquidity sweep high/low and target opposite liquidity pools for minimum 2:1 risk-to-reward ratios.
SMT divergence is the footprint of smart money—where one market whispers the truth while the other follows the herd.