
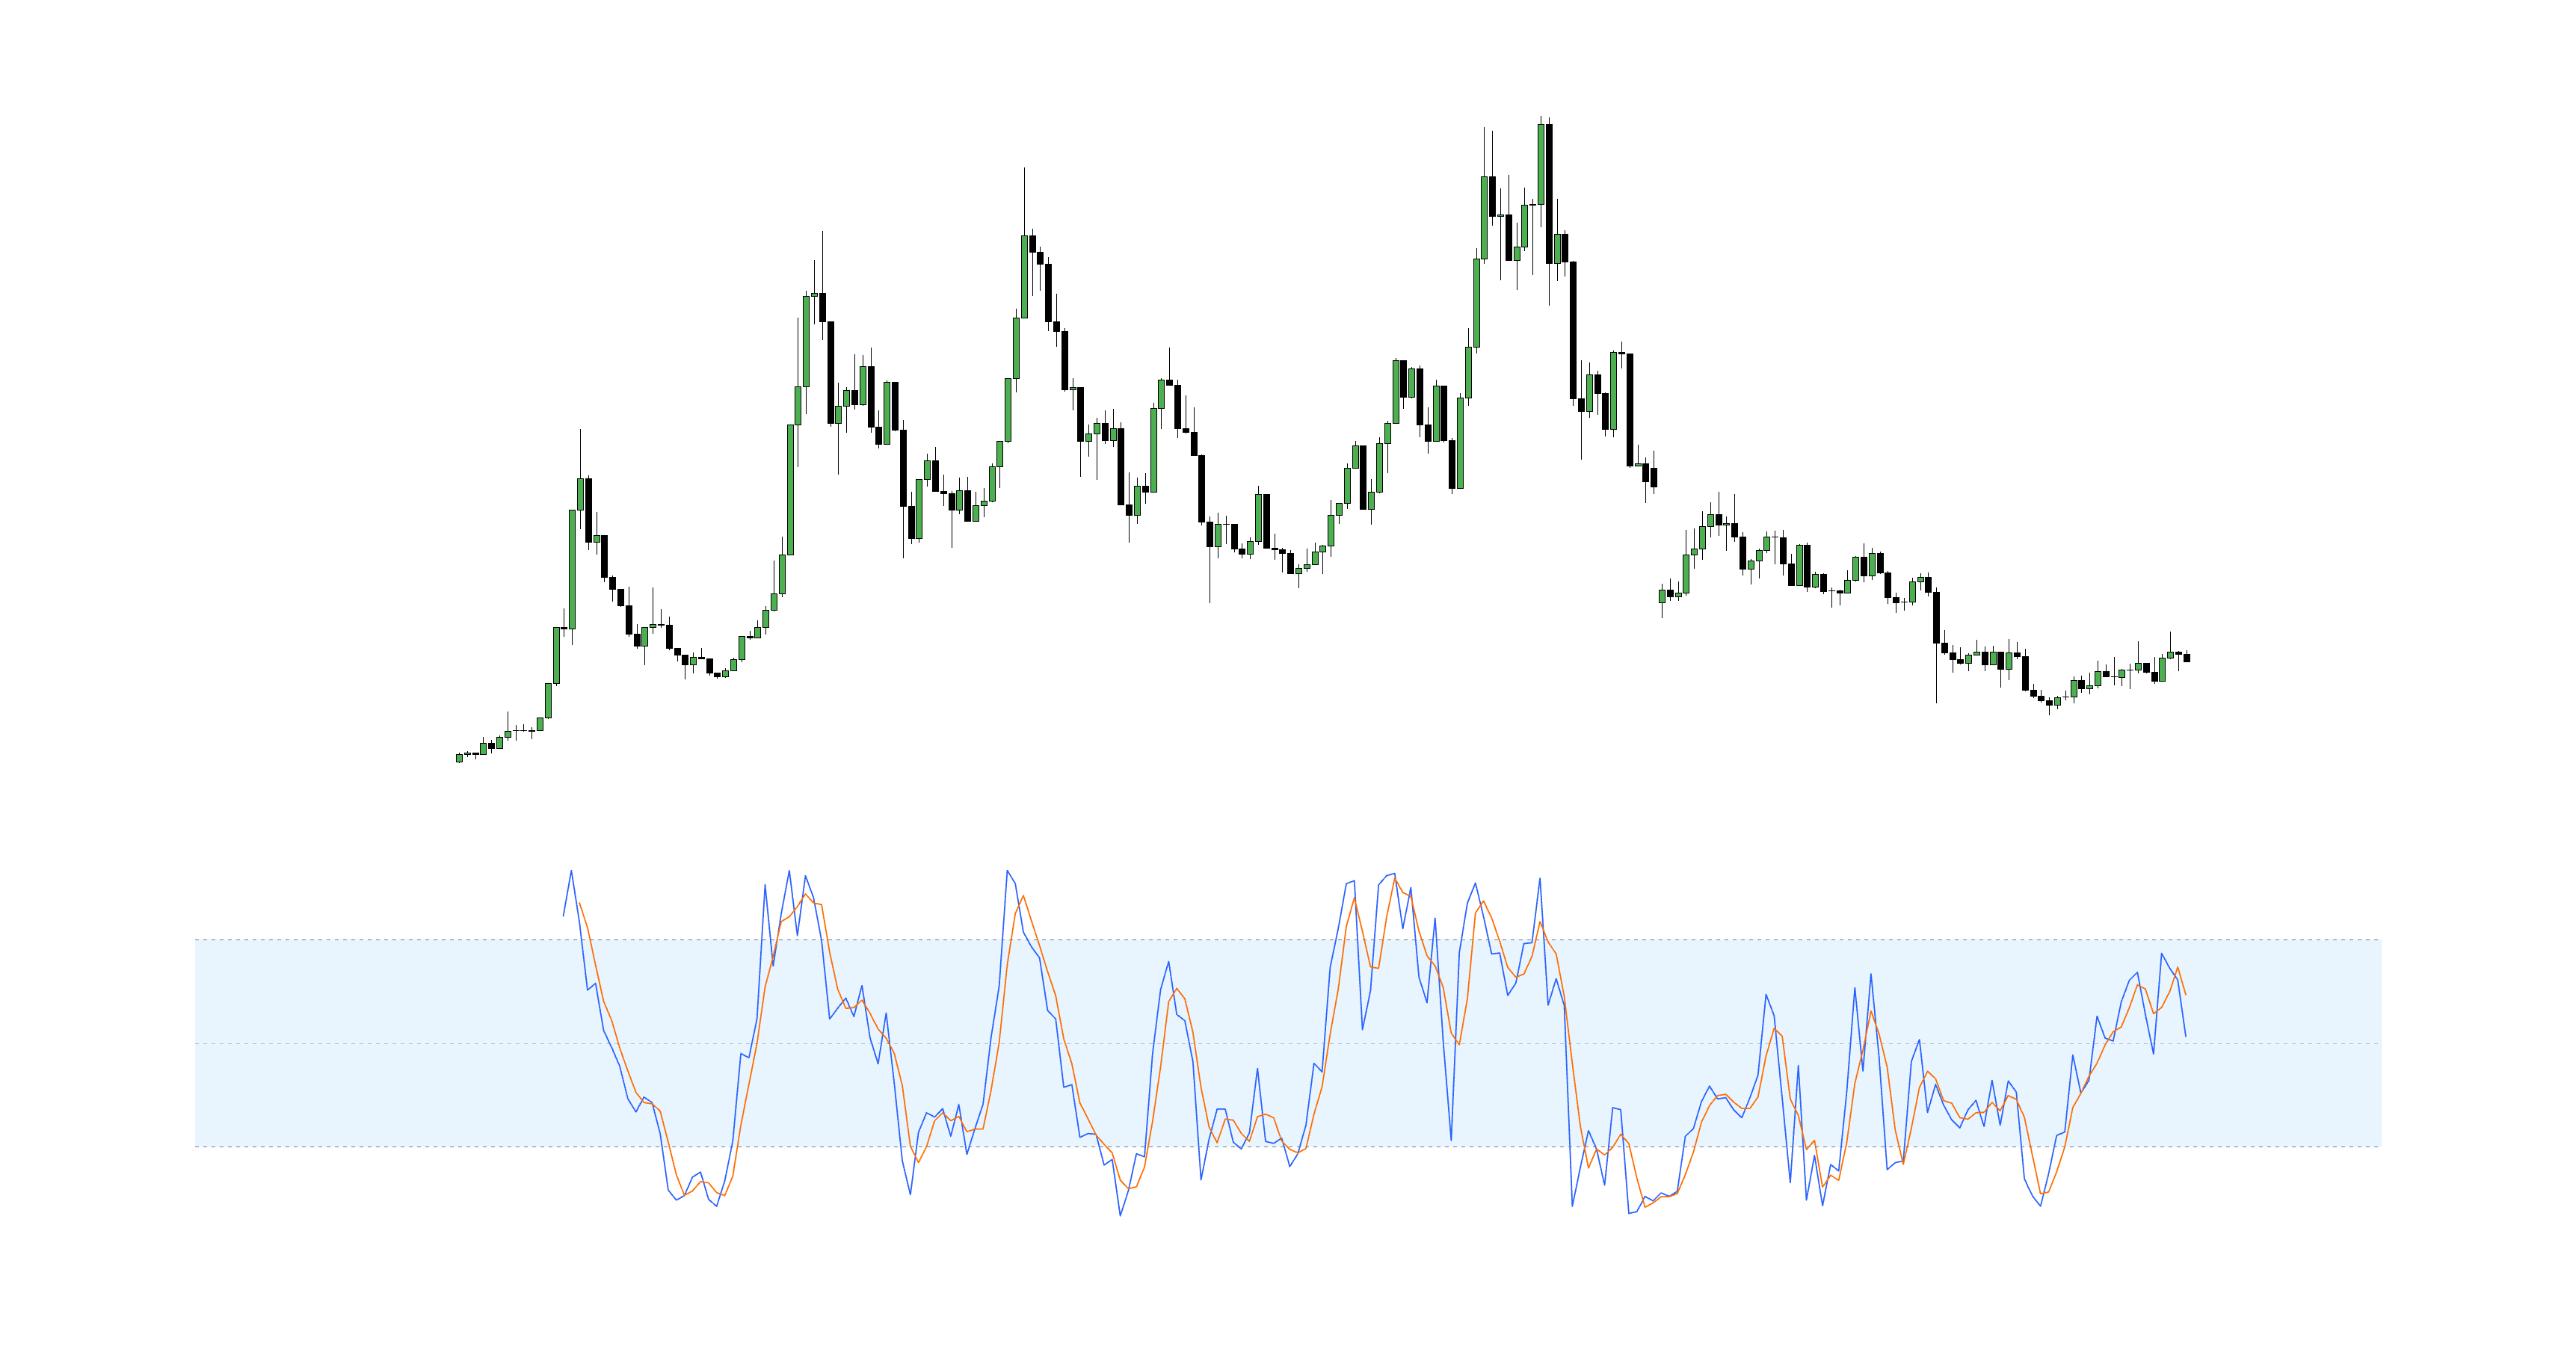
The Stochastic Oscillator is one of the most widely utilized momentum indicators in technical analysis. Designed to track price velocity and internal strength, it enables traders to identify potential trend reversals, gauge overbought and oversold market conditions, and capture momentum shifts before they manifest in price action.
Stochastic Oscillator Overview
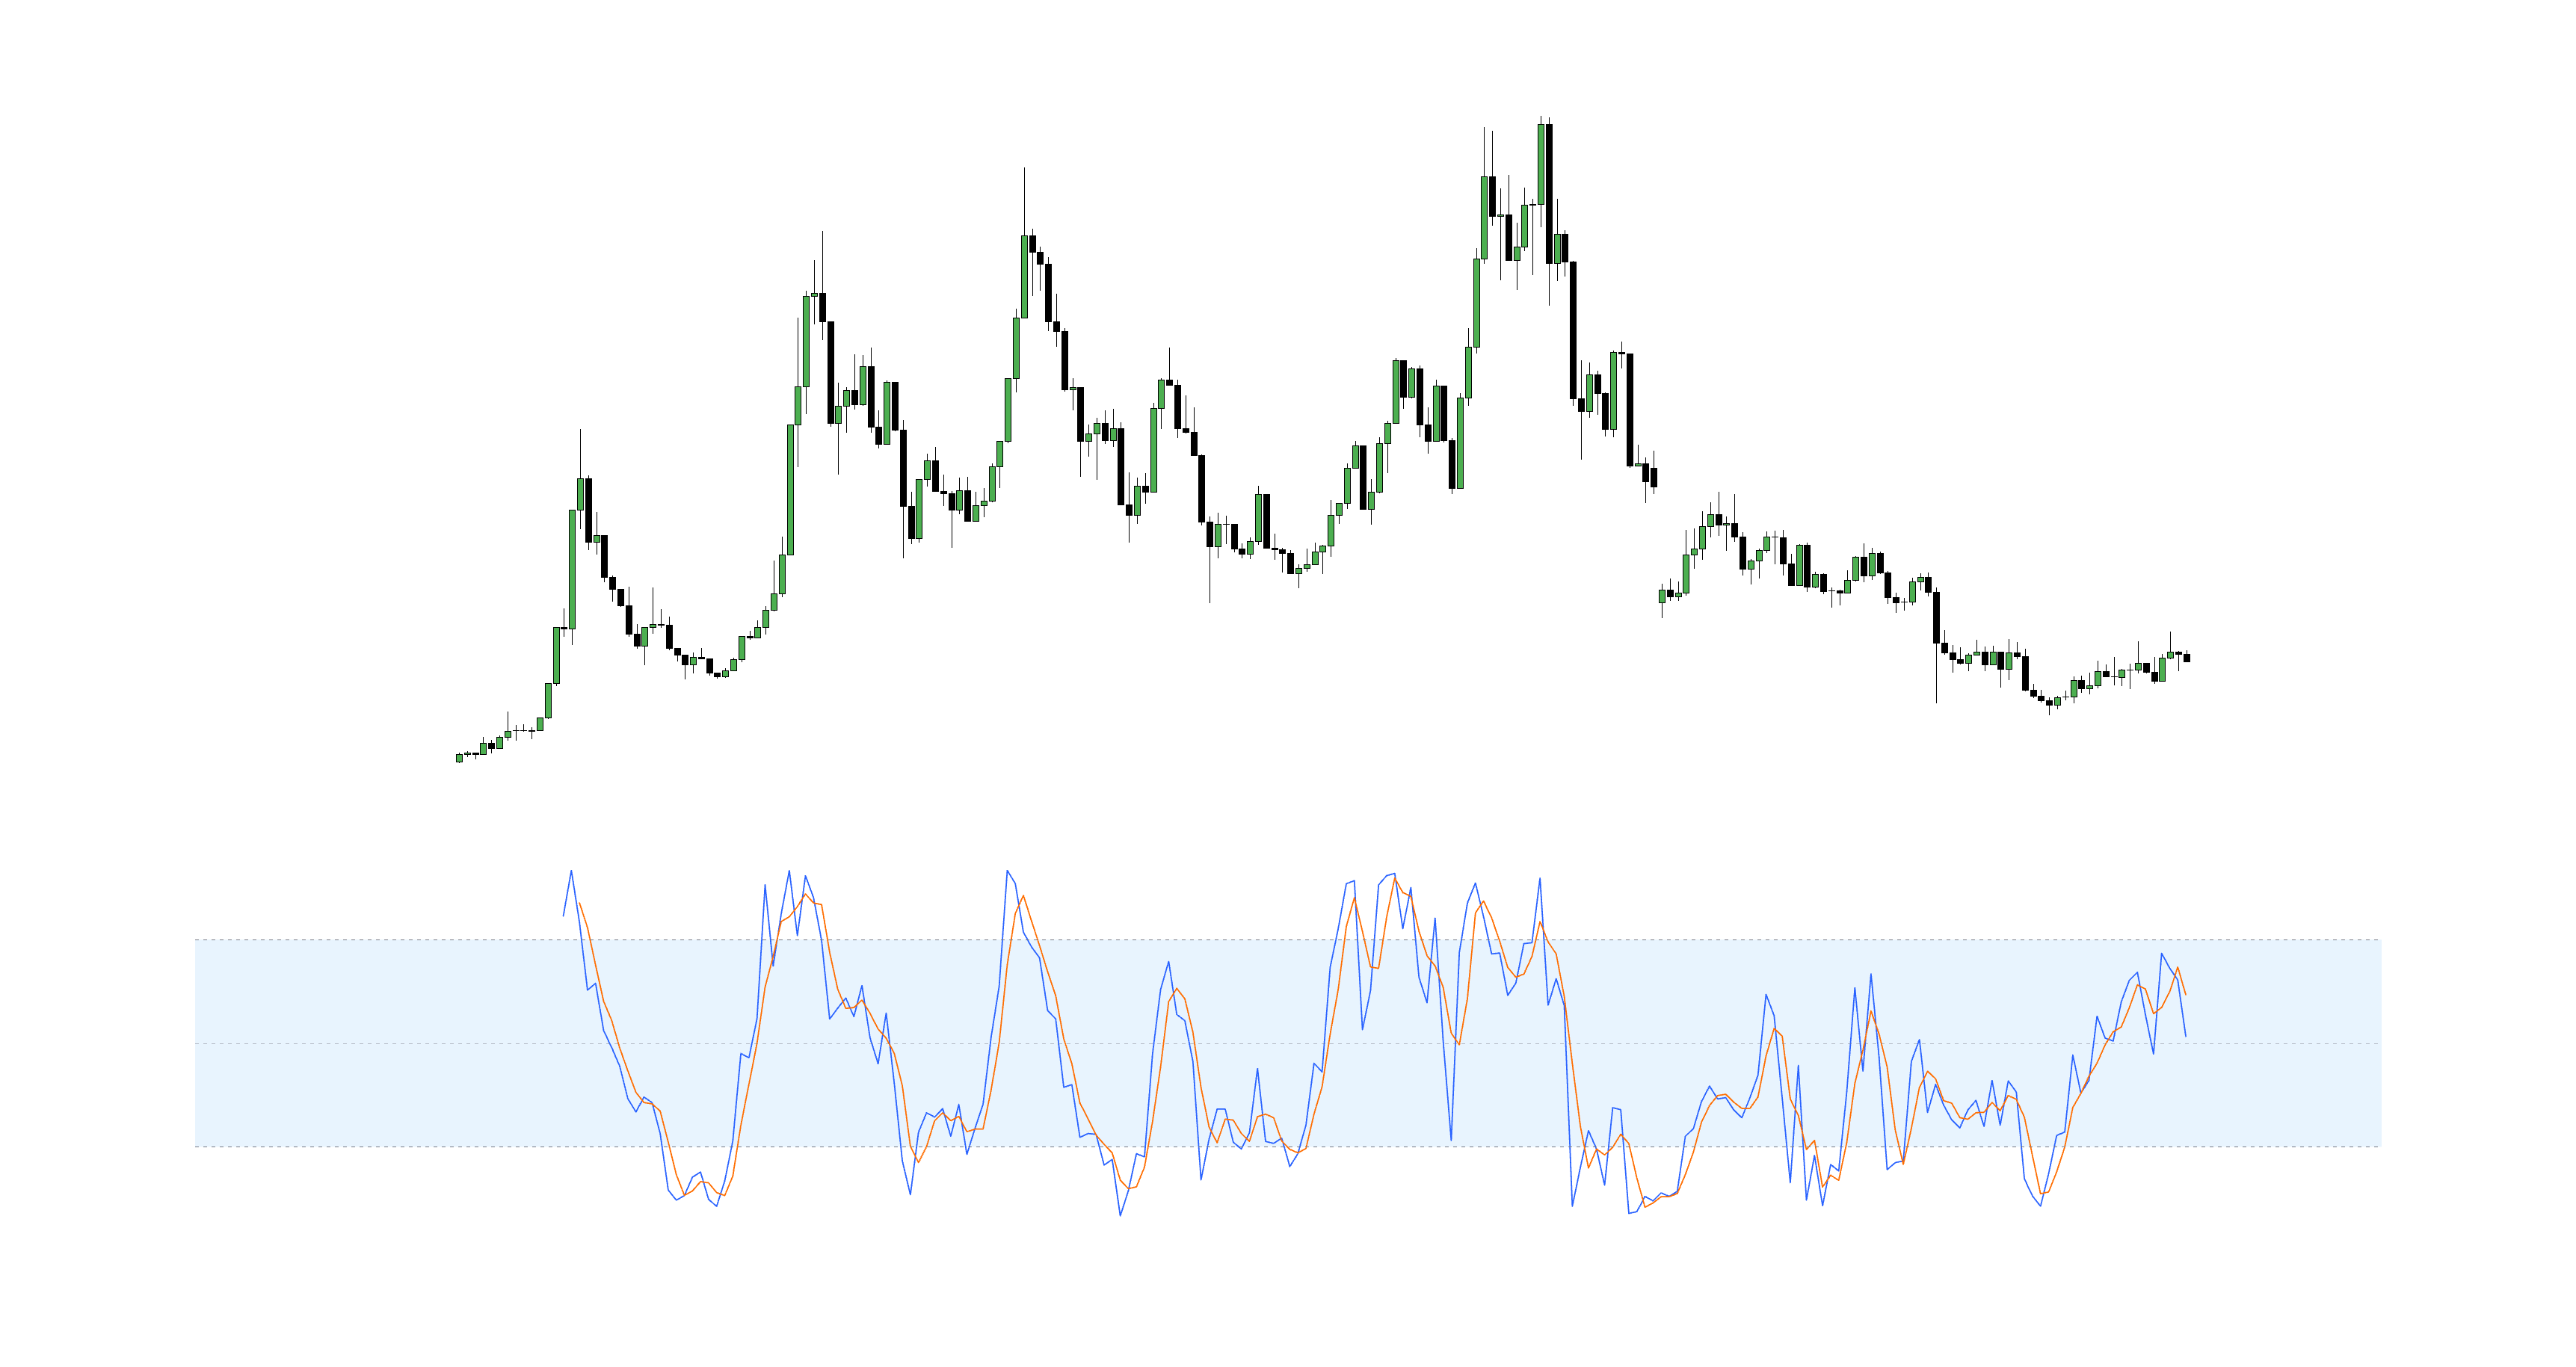
Unlike standard trend-following indicators like moving averages, the Stochastic Oscillator focuses primarily on price momentum relative to recent ranges. This characteristic makes it exceptionally effective in consolidating, range-bound, or mean-reverting market environments.
1. What Is the Stochastic Oscillator?
The Stochastic Oscillator measures the position of the current closing price relative to the high-low range over a defined lookback period.
Core Concept: Price momentum typically shifts direction before price itself turns.
When a financial asset consistently closes near the upper end of its recent range, bullish momentum is dominant. Conversely, when price closes near the bottom of its range, bearish pressure is taking control.
The indicator consists of two main lines:
- %K: The primary (fast) momentum line.
- %D: A smoothed moving average of %K, acting as the signal line.
Both lines fluctuate continuously within a bounded range of 0 to 100.
2. The Stochastic Oscillator Formula
Understanding the underlying mathematics ensures correct platform configuration and signal interpretation.
%K = (Current Close - Lowest Low) / (Highest High - Lowest Low) * 100
Where:
- Lowest Low: The absolute lowest price recorded during the lookback period.
- Highest High: The absolute highest price recorded during the lookback period.
This calculation quantifies exactly where the current closing price sits relative to recent price extremes.
Pine Script Example
//@version=5
indicator("Stochastic Oscillator Custom", shorttitle="Stoch", overlay=false)

periodK = input.int(14, title="%K Length")
smoothK = input.int(1, title="%K Smoothing")
periodD = input.int(3, title="%D Length")

stochK = ta.sma(ta.stoch(close, high, low, periodK), smoothK)
stochD = ta.sma(stochK, periodD)

plot(stochK, title="%K", color=color.blue)
plot(stochD, title="%D", color=color.orange)
hline(80, "Overbought", color=color.red, linestyle=hline.style_dashed)
hline(20, "Oversold", color=color.green, linestyle=hline.style_dashed)
3. Default TradingView Settings
The standard default inputs on TradingView and major charting platforms are:
- %K Length: 14
- %K Smoothing: 1
- %D Length: 3
- Overbought Threshold: 80
- Oversold Threshold: 20
These parameters offer a well-balanced response rate across multiple asset classes. Decreasing the lookback period increases sensitivity but introduces noise, whereas increasing the lookback period smooths out fluctuations at the cost of additional lag.
4. How to Read Stochastic Signals
Because the oscillator is bounded between 0 and 100, interpreting key levels is straightforward:
- Above 80: Market is in overbought territory.
- Below 20: Market is in oversold territory.
- %K crossing above %D: Bullish momentum crossover.
- %K crossing below %D: Bearish momentum crossover.
Key Rule: An overbought reading does not automatically guarantee an immediate drop, nor does an oversold reading mandate a rally. In strong, extended trends, the indicator can remain pegged in extreme territory for a long time.
5. High-Probability Trading Strategies
1. Overbought & Oversold Range Reversals
Overbought & Oversold Reversals
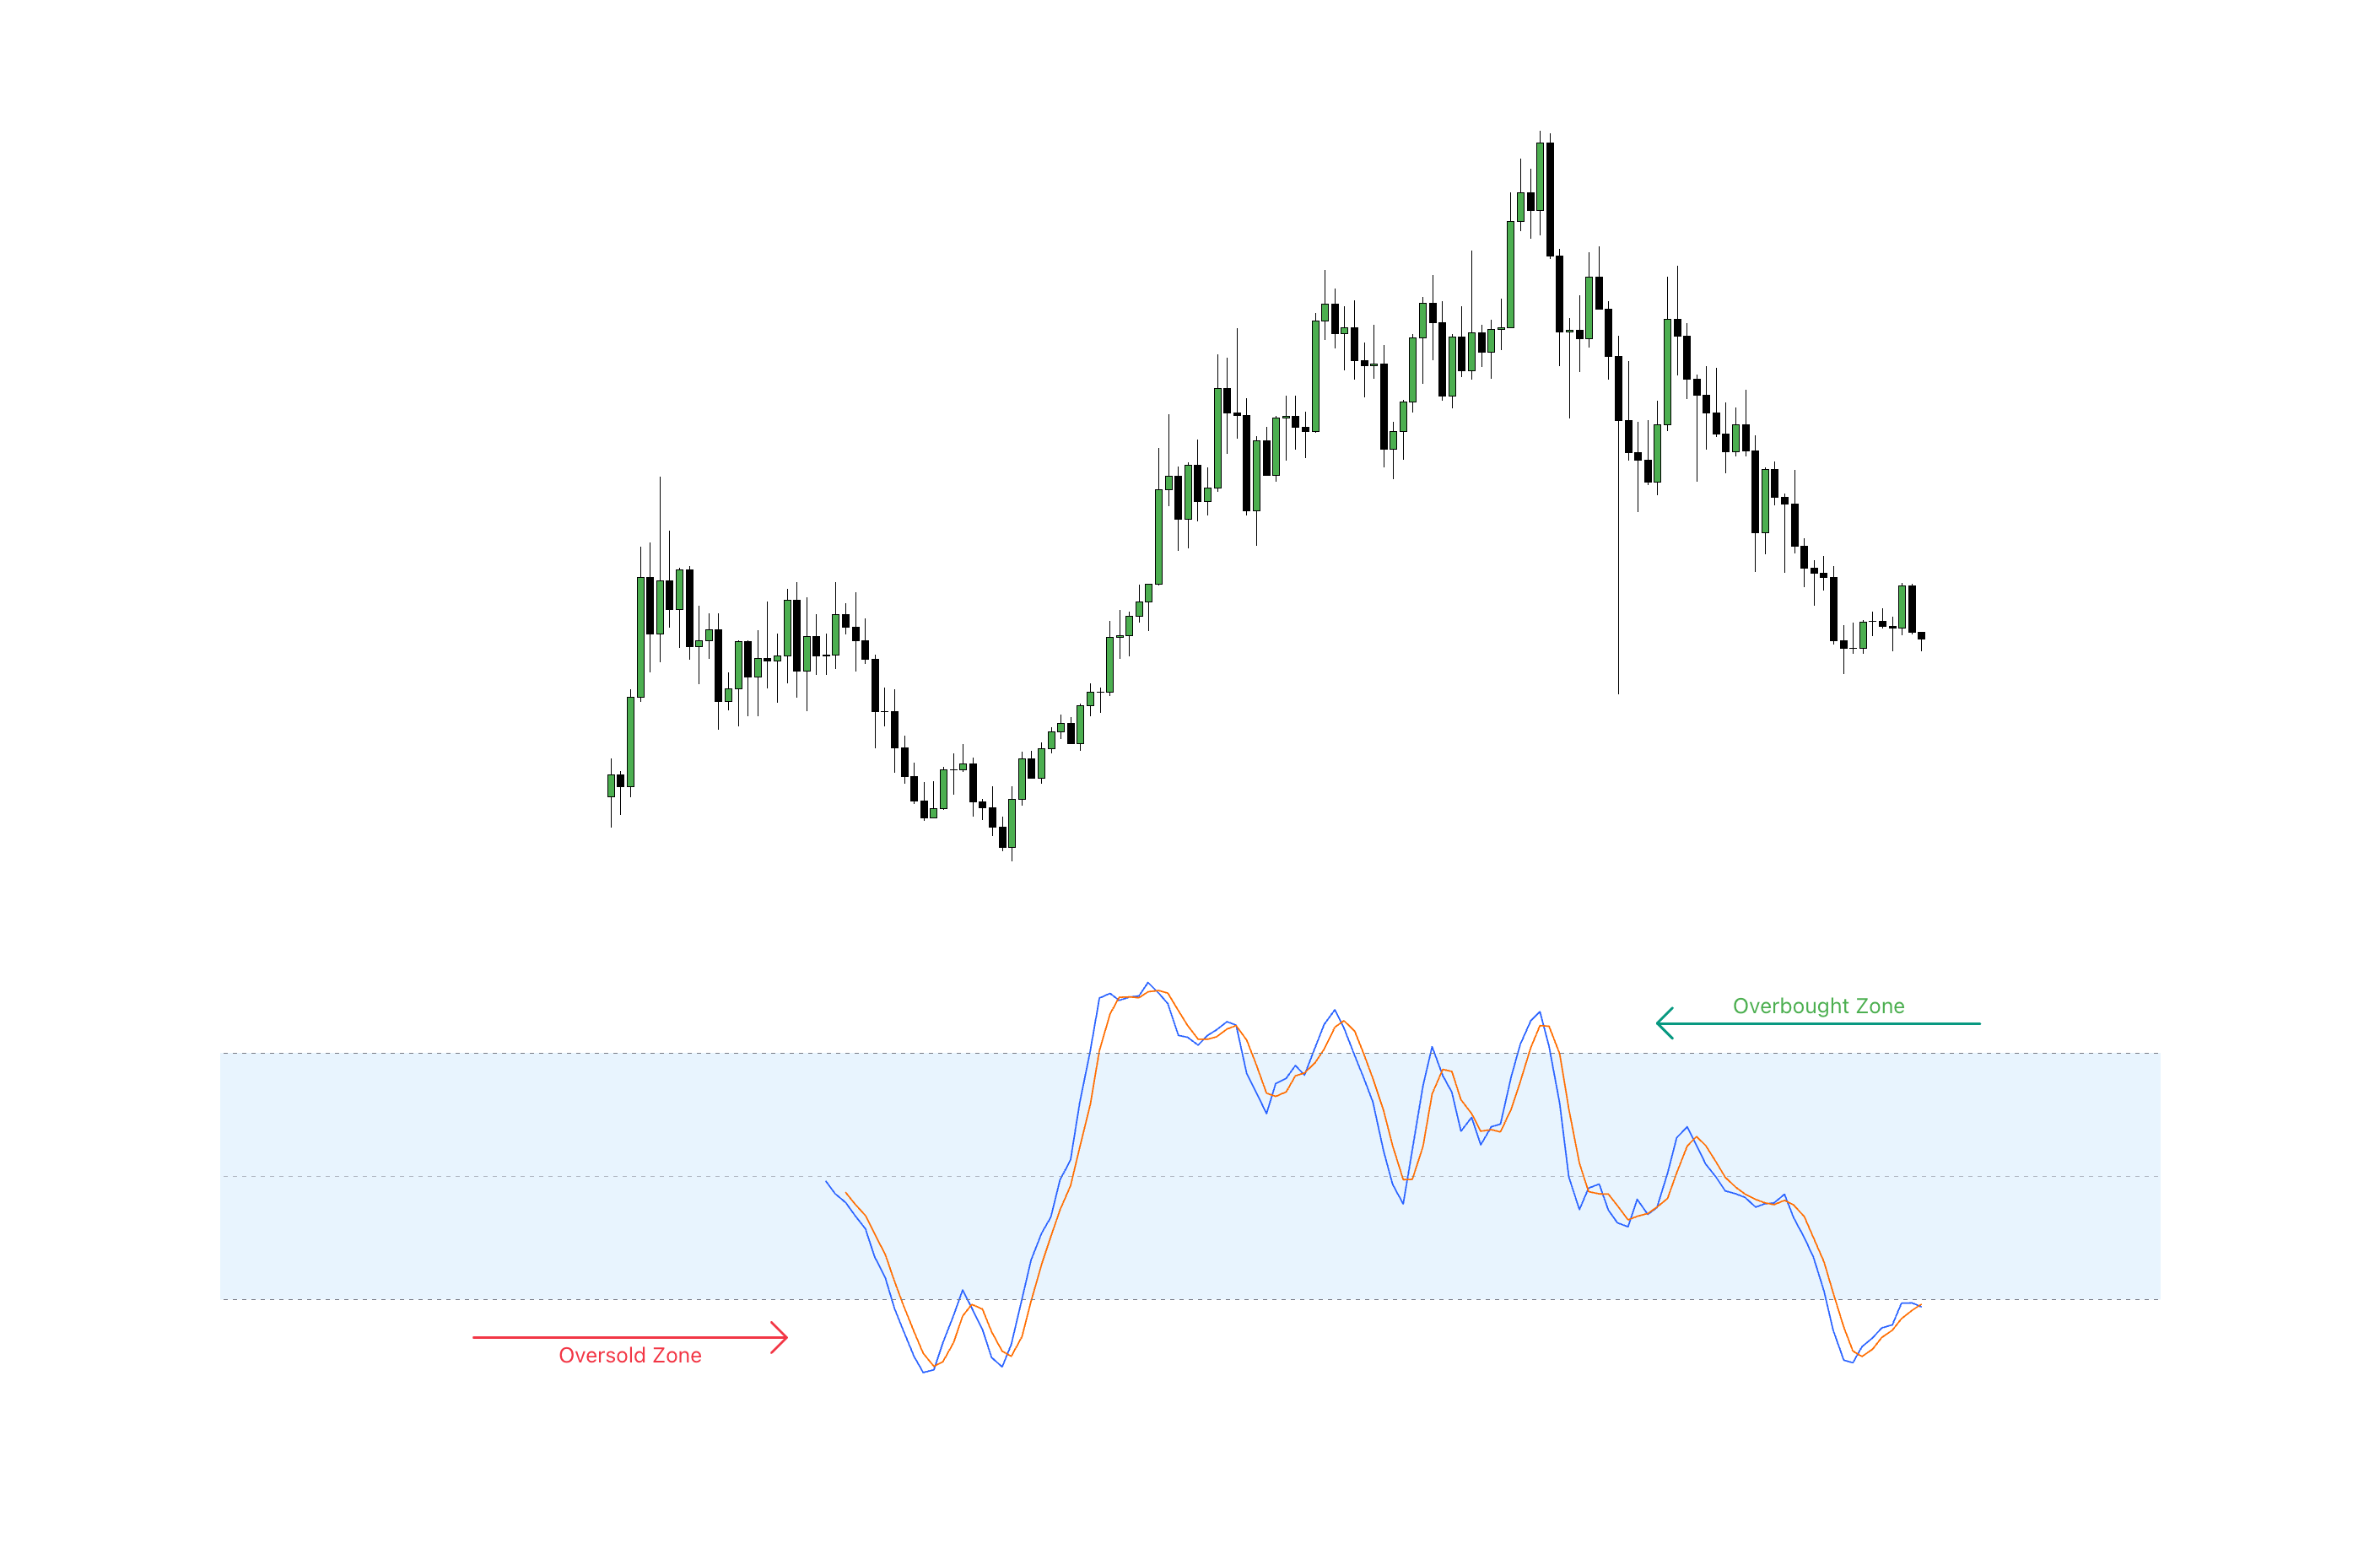
This strategy works best when price is bouncing between established support and resistance levels in a sideways market:
- Long Entry: Wait for %K to drop below 20 and cross above %D before entering long.
- Short Entry: Wait for %K to rise above 80 and cross below %D before entering short.
2. Trend-Filtered Stochastic Entries
Trend-Based Stochastic Strategy
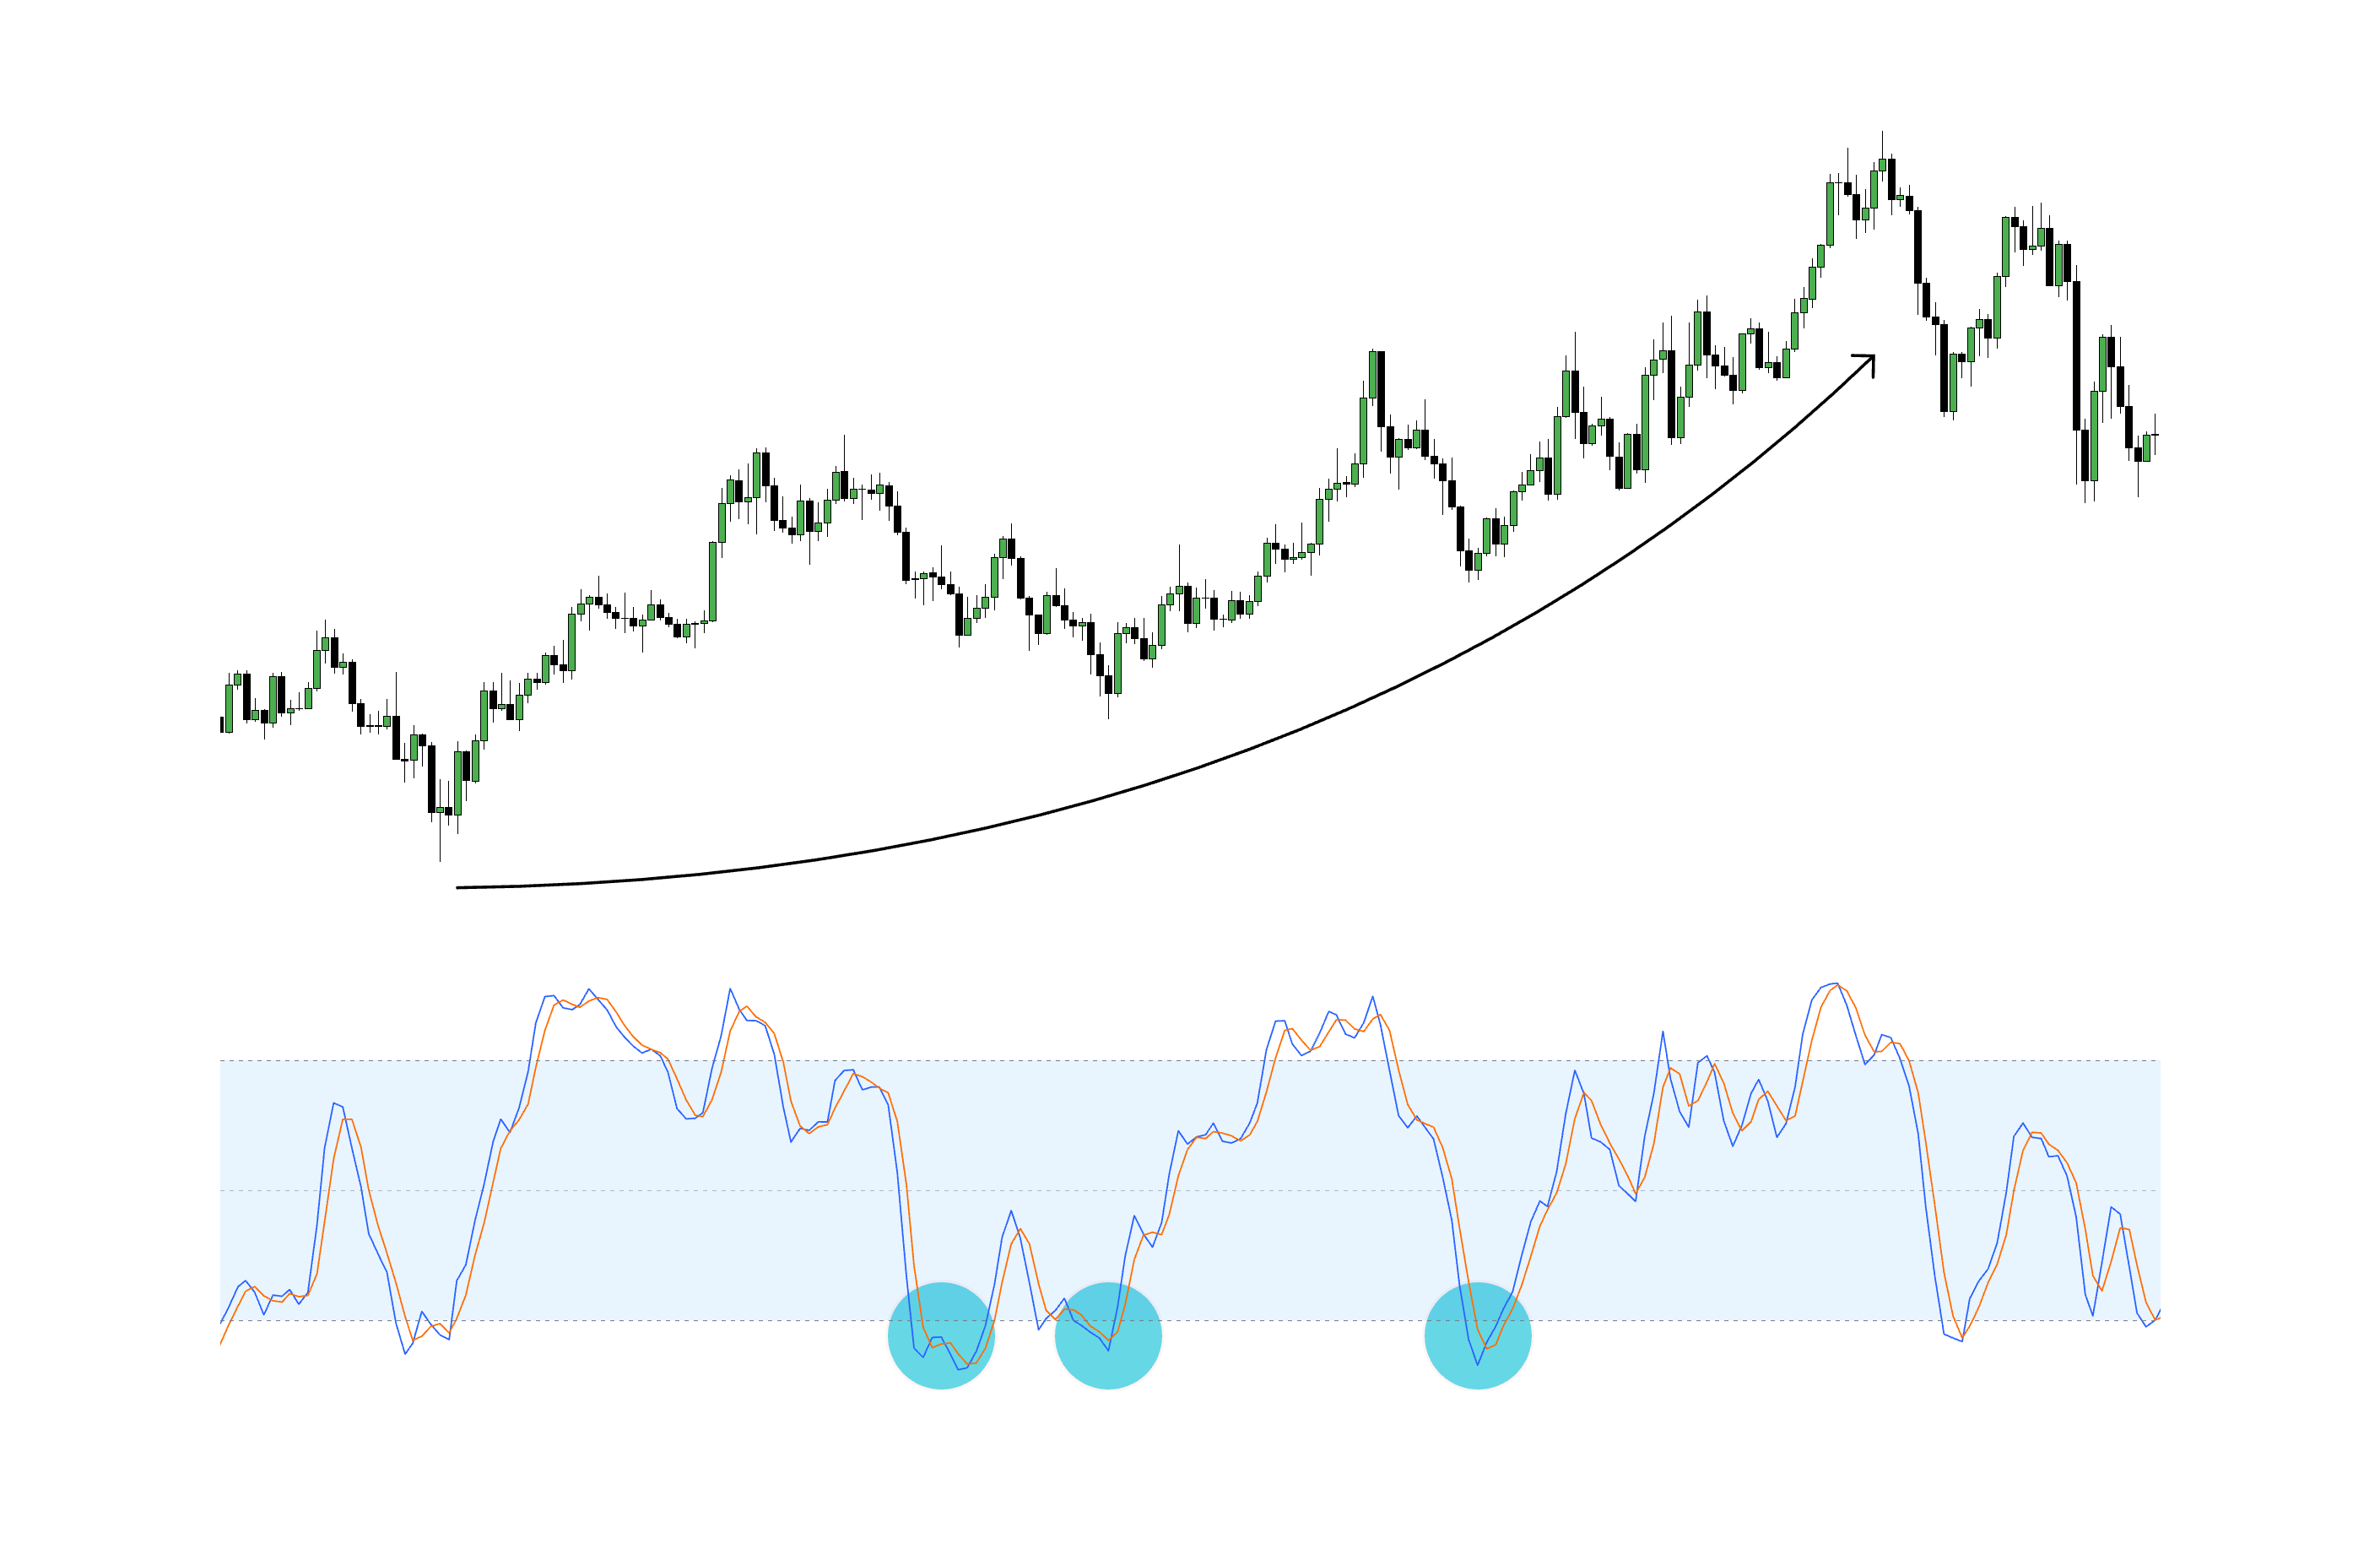
When trading in a strongly trending market, use the Stochastic Oscillator strictly for timing pullbacks in the direction of the dominant trend:
- In an Uptrend: Filter out overbought sell signals and execute long entries only when Stochastic drops into oversold territory.
- In a Downtrend: Filter out oversold buy signals and execute short entries only when Stochastic rallies into overbought territory.
3. Stochastic Divergence Trading
Stochastic Divergence
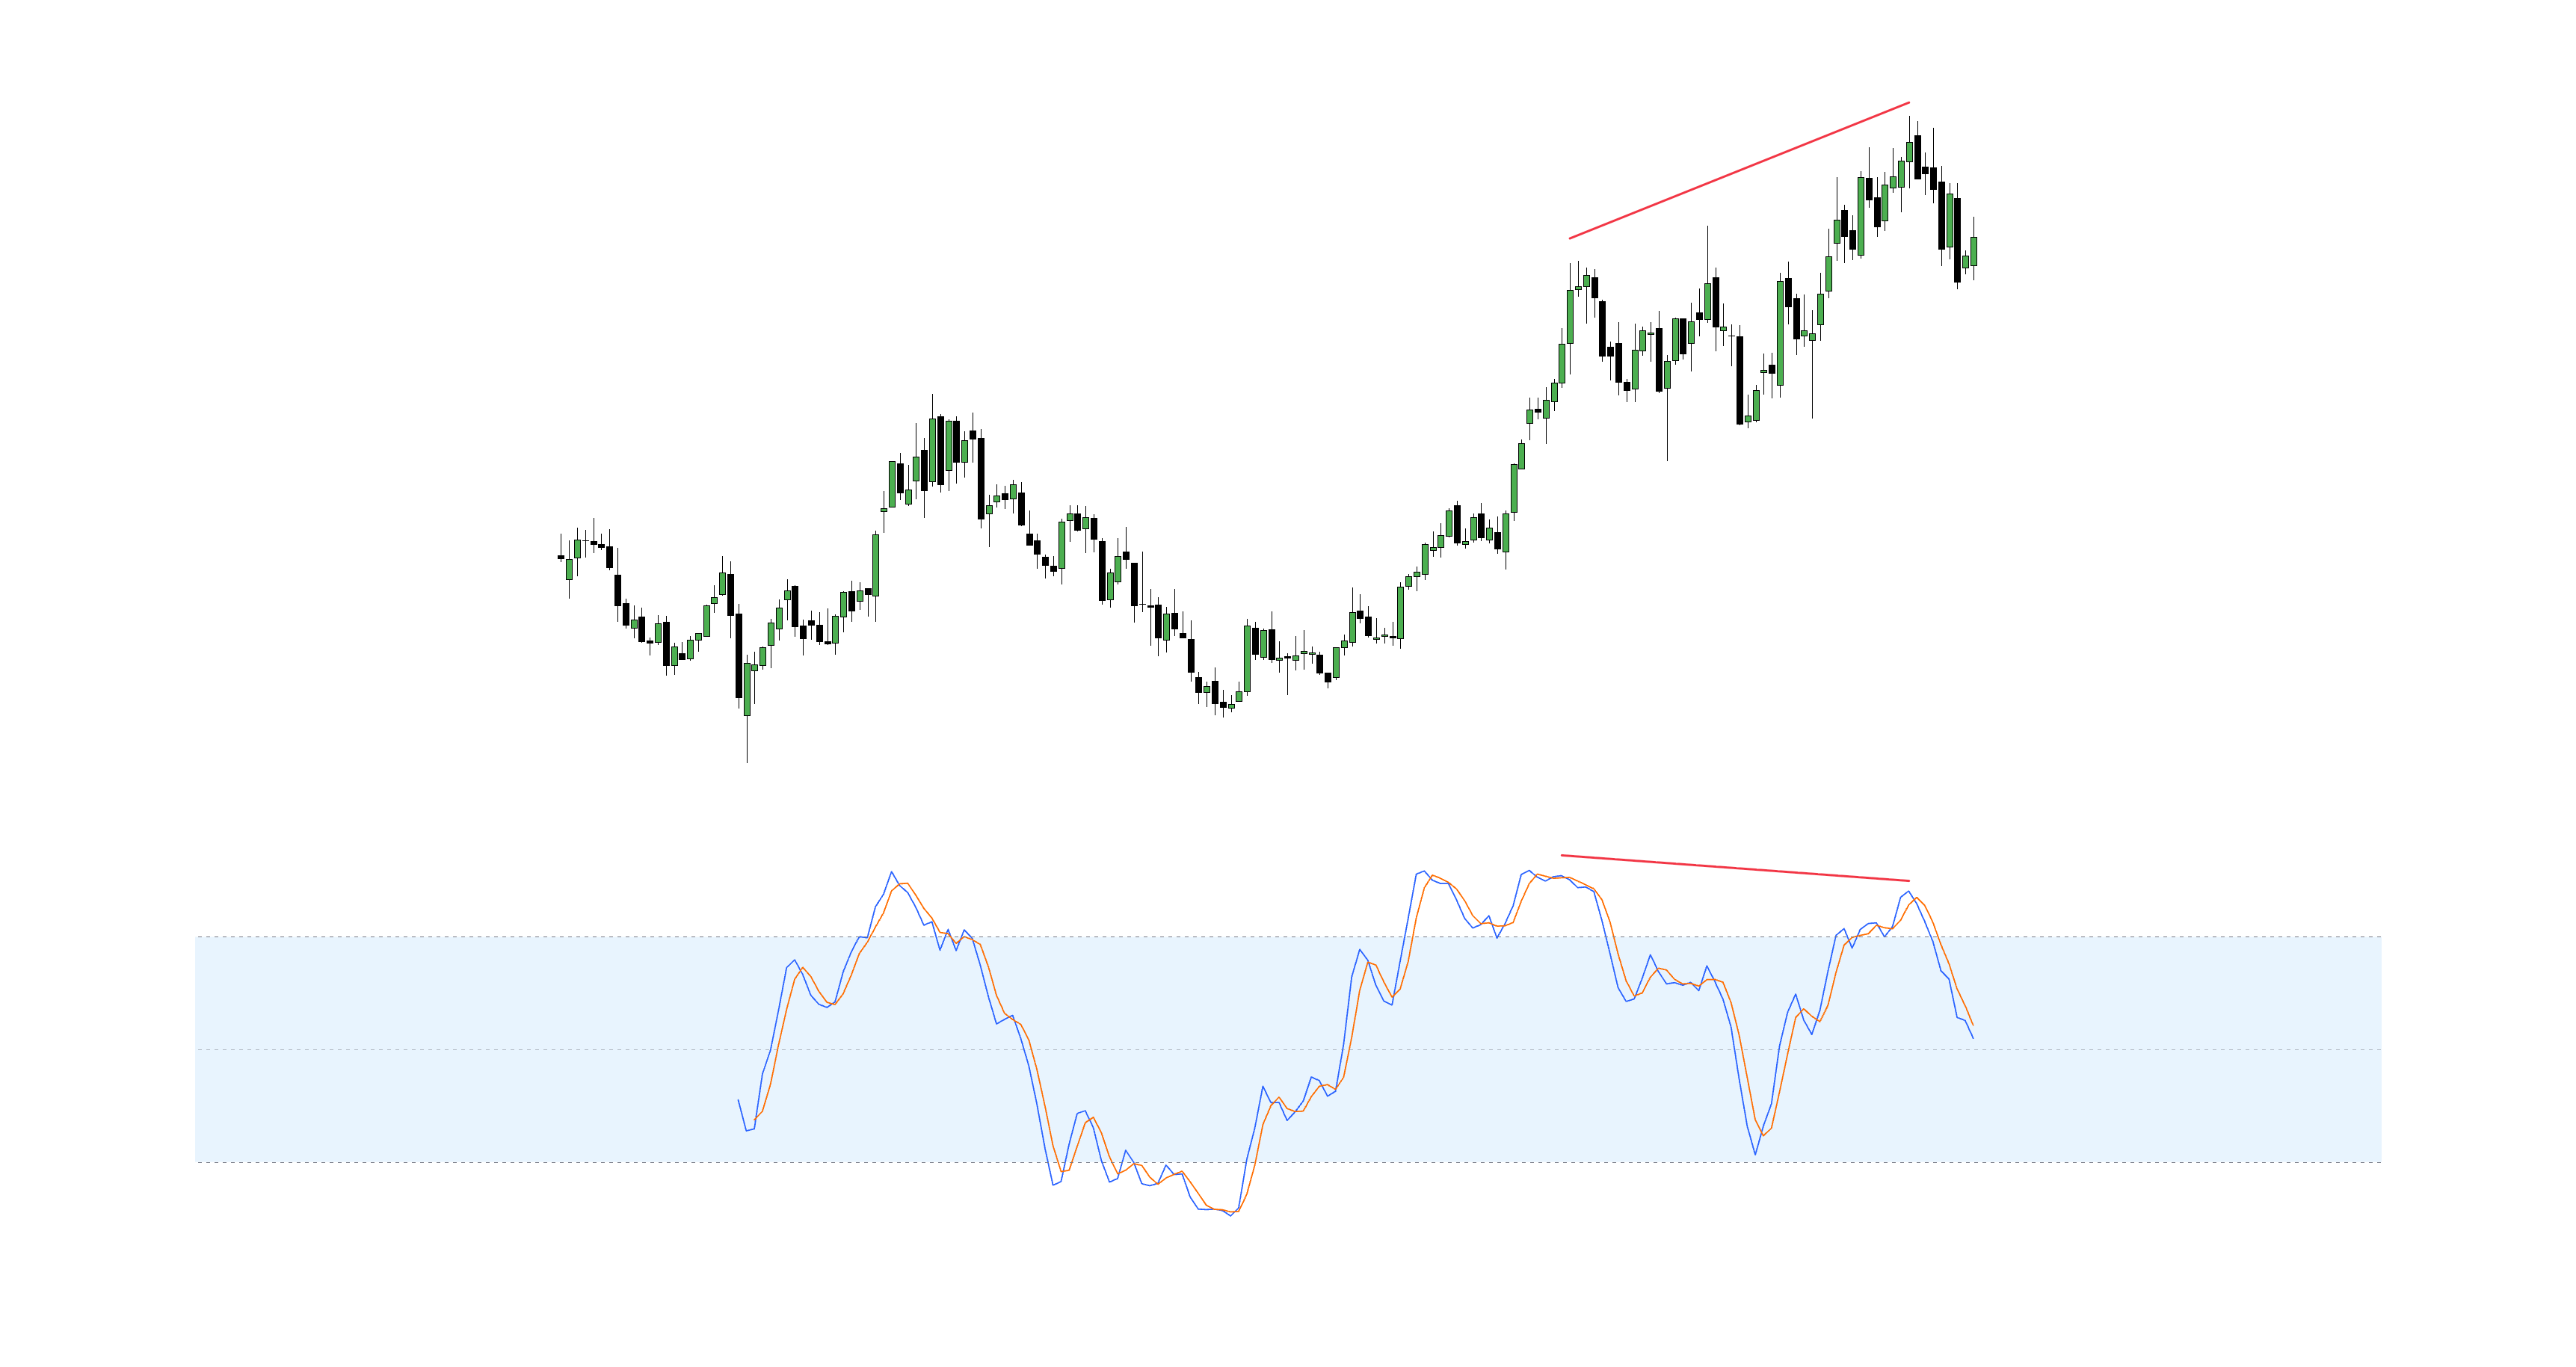
Divergence occurs when price action and momentum diverge from one another, signaling internal weakness:
- Bullish Divergence: Price forms a Lower Low while the Stochastic Oscillator forms a Higher Low. This indicates fading selling pressure.
- Bearish Divergence: Price forms a Higher High while the Stochastic Oscillator forms a Lower High. This indicates exhausting buying pressure.
6. Optimal Timeframes for Stochastic Oscillator
The Stochastic Oscillator functions effectively across all timeframes, though higher timeframes naturally yield higher reliability and fewer false signals:
- Scalping: 1-minute to 5-minute charts.
- Day Trading: 15-minute to 1-hour charts.
- Swing Trading: 4-hour to Daily charts.
7. Advantages and Disadvantages
Advantages
- Simple, clear visual output and actionable crossover signals.
- Highly effective for identifying momentum deceleration and exhaustion.
- Superior performance in range-bound and mean-reverting market environments.
Disadvantages
- Can produce false or premature signals during powerful structural trends.
- Inherently lagging during aggressive, news-driven market expansions.
- Should never be traded in isolation without structural context.
Summary
The Stochastic Oscillator is a versatile tool for timing entries and confirming momentum. For optimal results, combine it with market structure, horizontal key levels, and higher-timeframe trend context.
Always validate trade setups with strict risk management and position sizing.