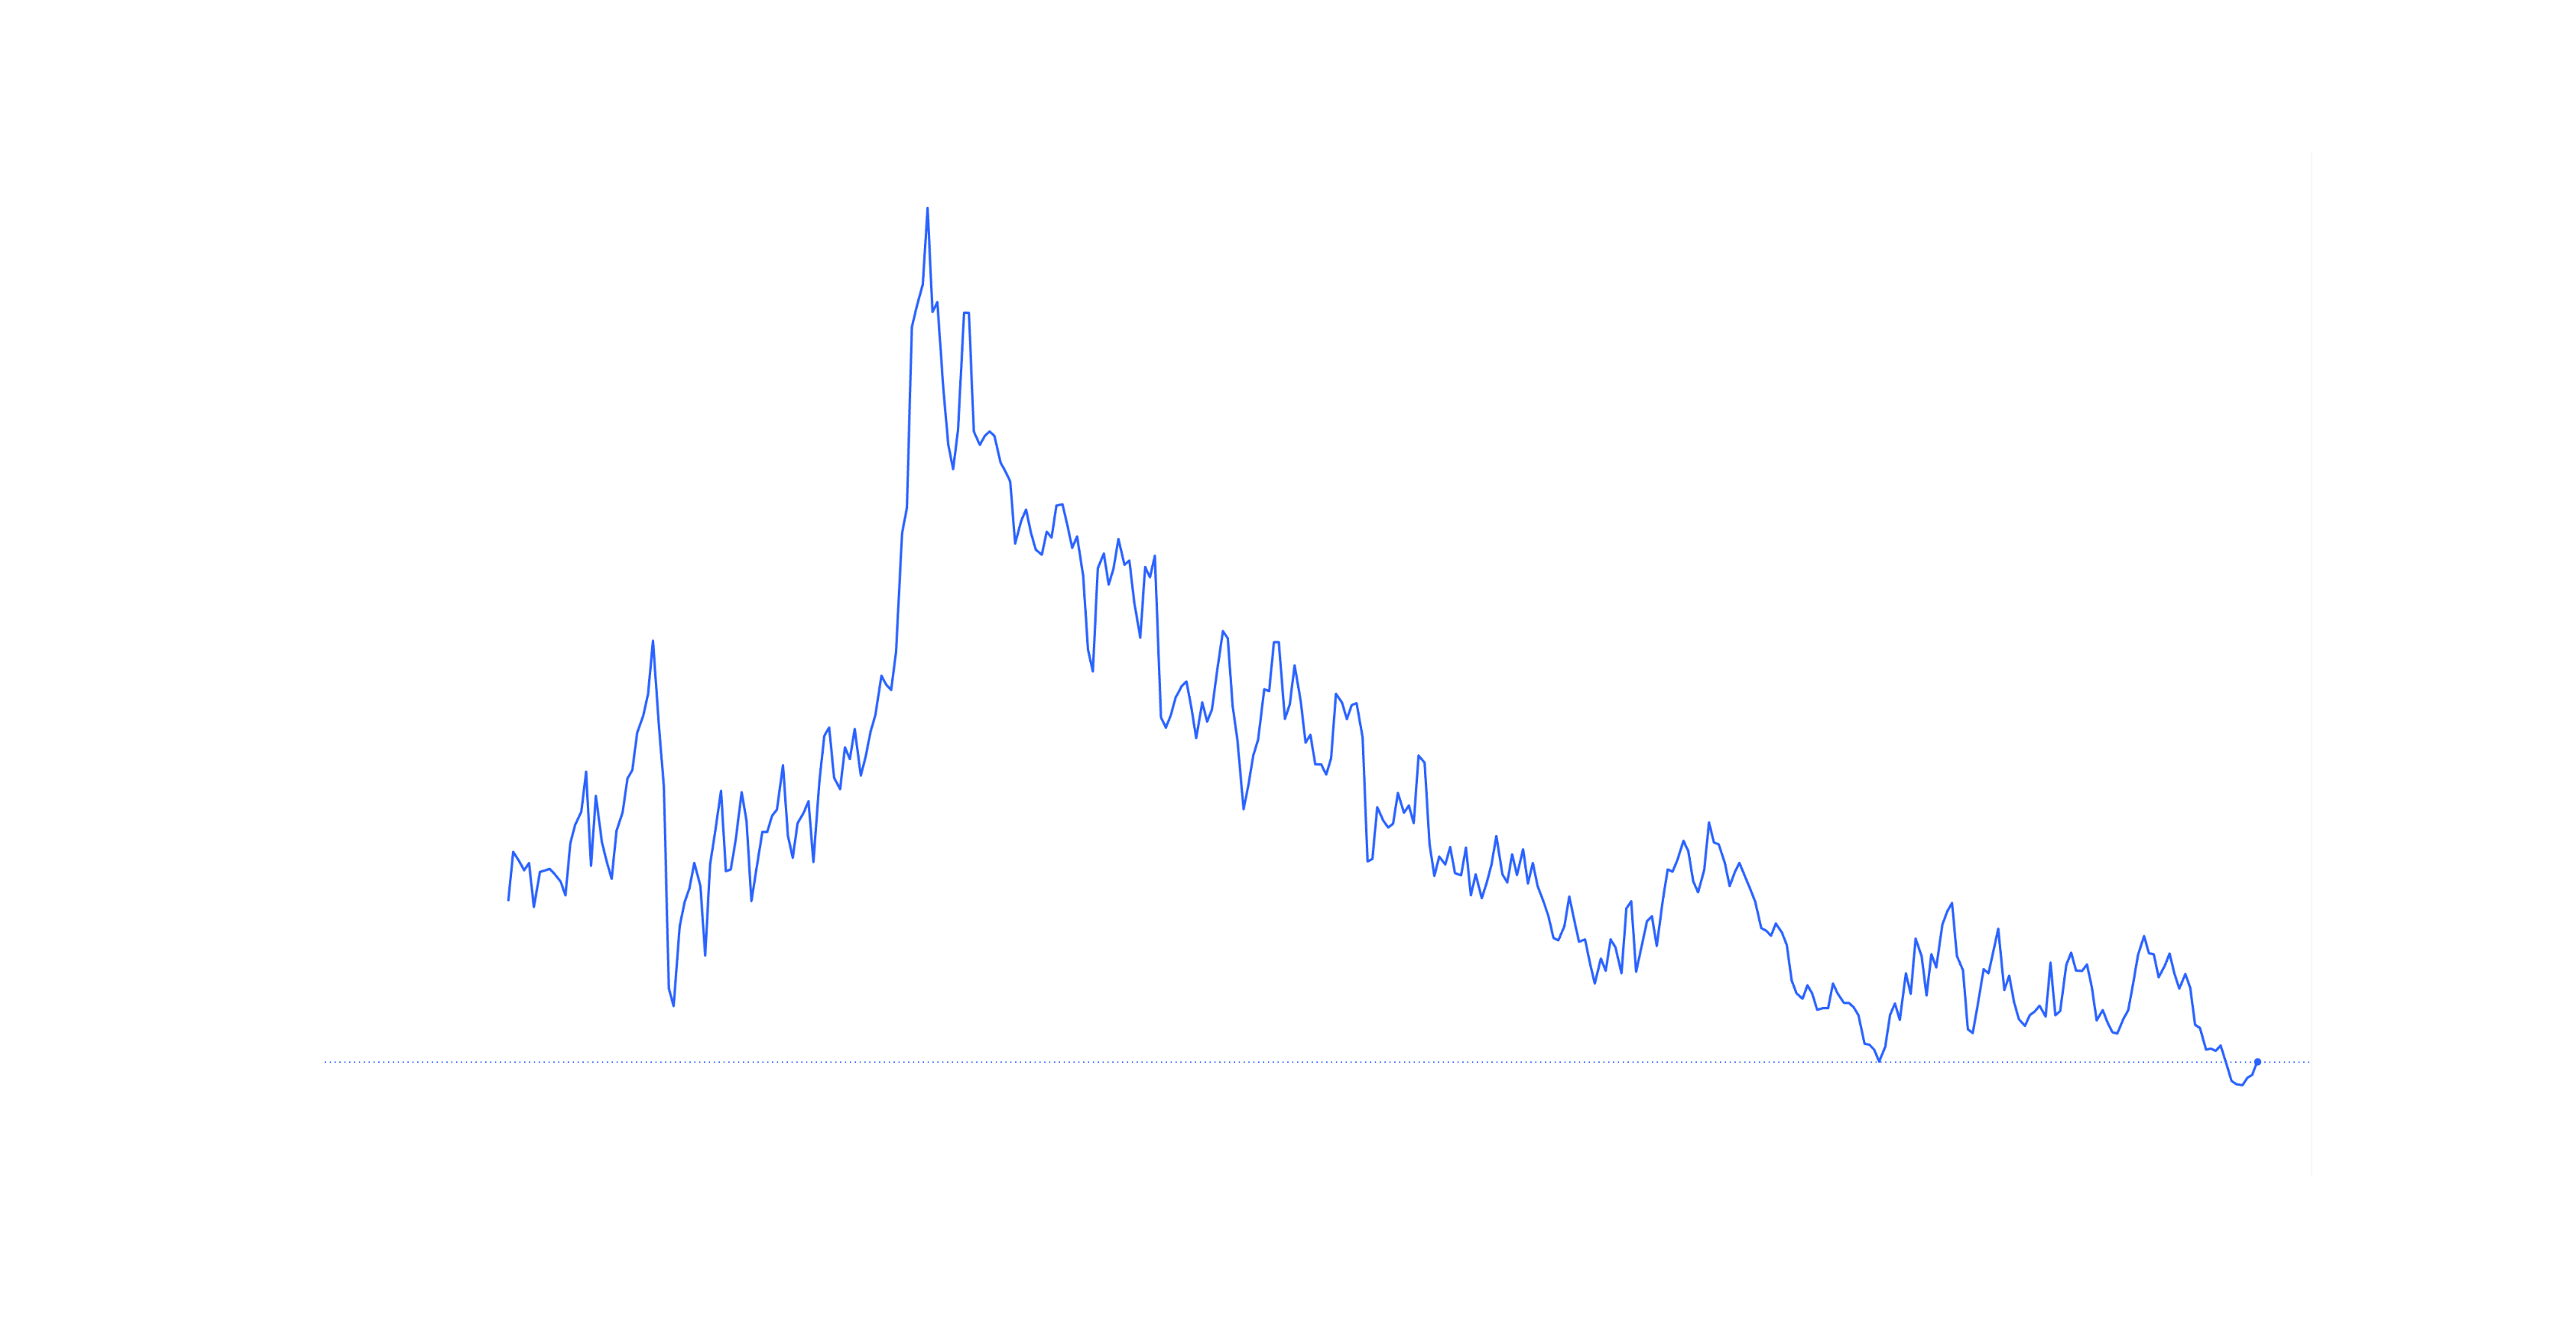
The term "Short Squeeze" is one of the most misused phrases in modern trading. While social media often equates High Short Interest with an Imminent Squeeze, professional traders look at the Mechanical Fuel to see if a squeeze is even structurally possible. This guide breaks down the math and the psychology behind the "Crowded Short."
Volkswagen Short Squeeze
1. The Mechanics of a Squeeze
For a true, "mechanical" short squeeze to occur, you need three specific conditions to collide:
-
Short Interest (SI) % of Float: The percentage of the tradable shares (the float) that have been sold short. Generally, SI > 15-20% is considered high. However, high SI alone is not a reason for a squeeze. It only tells you the potential magnitude of buying if everyone exits at once.
-
Days to Cover (DTC) — "The Mechanical Fuel": This tells you how many days of normal trading it would take for all shorts to exit. Formula: Short Interest (Shares) / Average Daily Volume
- DTC < 2: Extremely Liquid. Shorts can exit effortlessly. Squeeze potential is LOW.
- DTC 2–5: Moderate. A price spike can cause some pain.
- DTC > 5: High Fuel. This is where "mechanical" squeezes happen because there isn't enough daily liquidity for everyone to exit simultaneously.
-
Float Liquidity: Stocks with few shares available for trading (Small Float) are much easier to squeeze. Large-cap stocks with hundreds of millions of shares are "extremely liquid" and very difficult to mechanically squeeze, regardless of short interest.
2. Why "Heavily Shorted" Stocks Rally
If the math (DTC) says there is no squeeze fuel, why do these stocks still go parabolic? It’s usually one of these three factors:
- The Catalyst Rip: The stock moves because of a genuine fundamental shift (e.g., a Bitcoin rip, an earnings beat). The price goes up because buyers are aggressive, not because shorts are trapped.
- The Gamma Squeeze: Massive volume in Out-of-the-Money (OTM) call options forces Market Makers to hedge by buying the underlying stock. This creates a buying loop that looks like a short squeeze but is driven by derivatives (options).
- Momentum & Crowd Sentiment: Algorithmic trading and retail FOMO chase the green candles, amplifying the "Short Squeeze" narrative even when shorts are comfortably exiting.
3. Case Study: The "Highly Liquid" Short
Imagine a stock with 12% Short Interest but a Days to Cover of 1.2.
- The Narrative: "Shorts are trapped! Gamma squeeze incoming!"
- The Reality: Because the volume is so high, shorts can exit their entire position in just over a single day. There is no "mechanical" door-jam. Any rally is likely driven by external catalysts rather than "forced covering."
4. The Professional Framework
When you see a "Squeeze" idea, ask yourself these three questions:
- Is the DTC high? (>5 is a real threat, <2 is a non-event).
- Is the volume extreme? (High liquidity = easy exit for shorts).
- Is there a catalyst? (Is it moving because of the shorts, or because of a fundamental reason?).
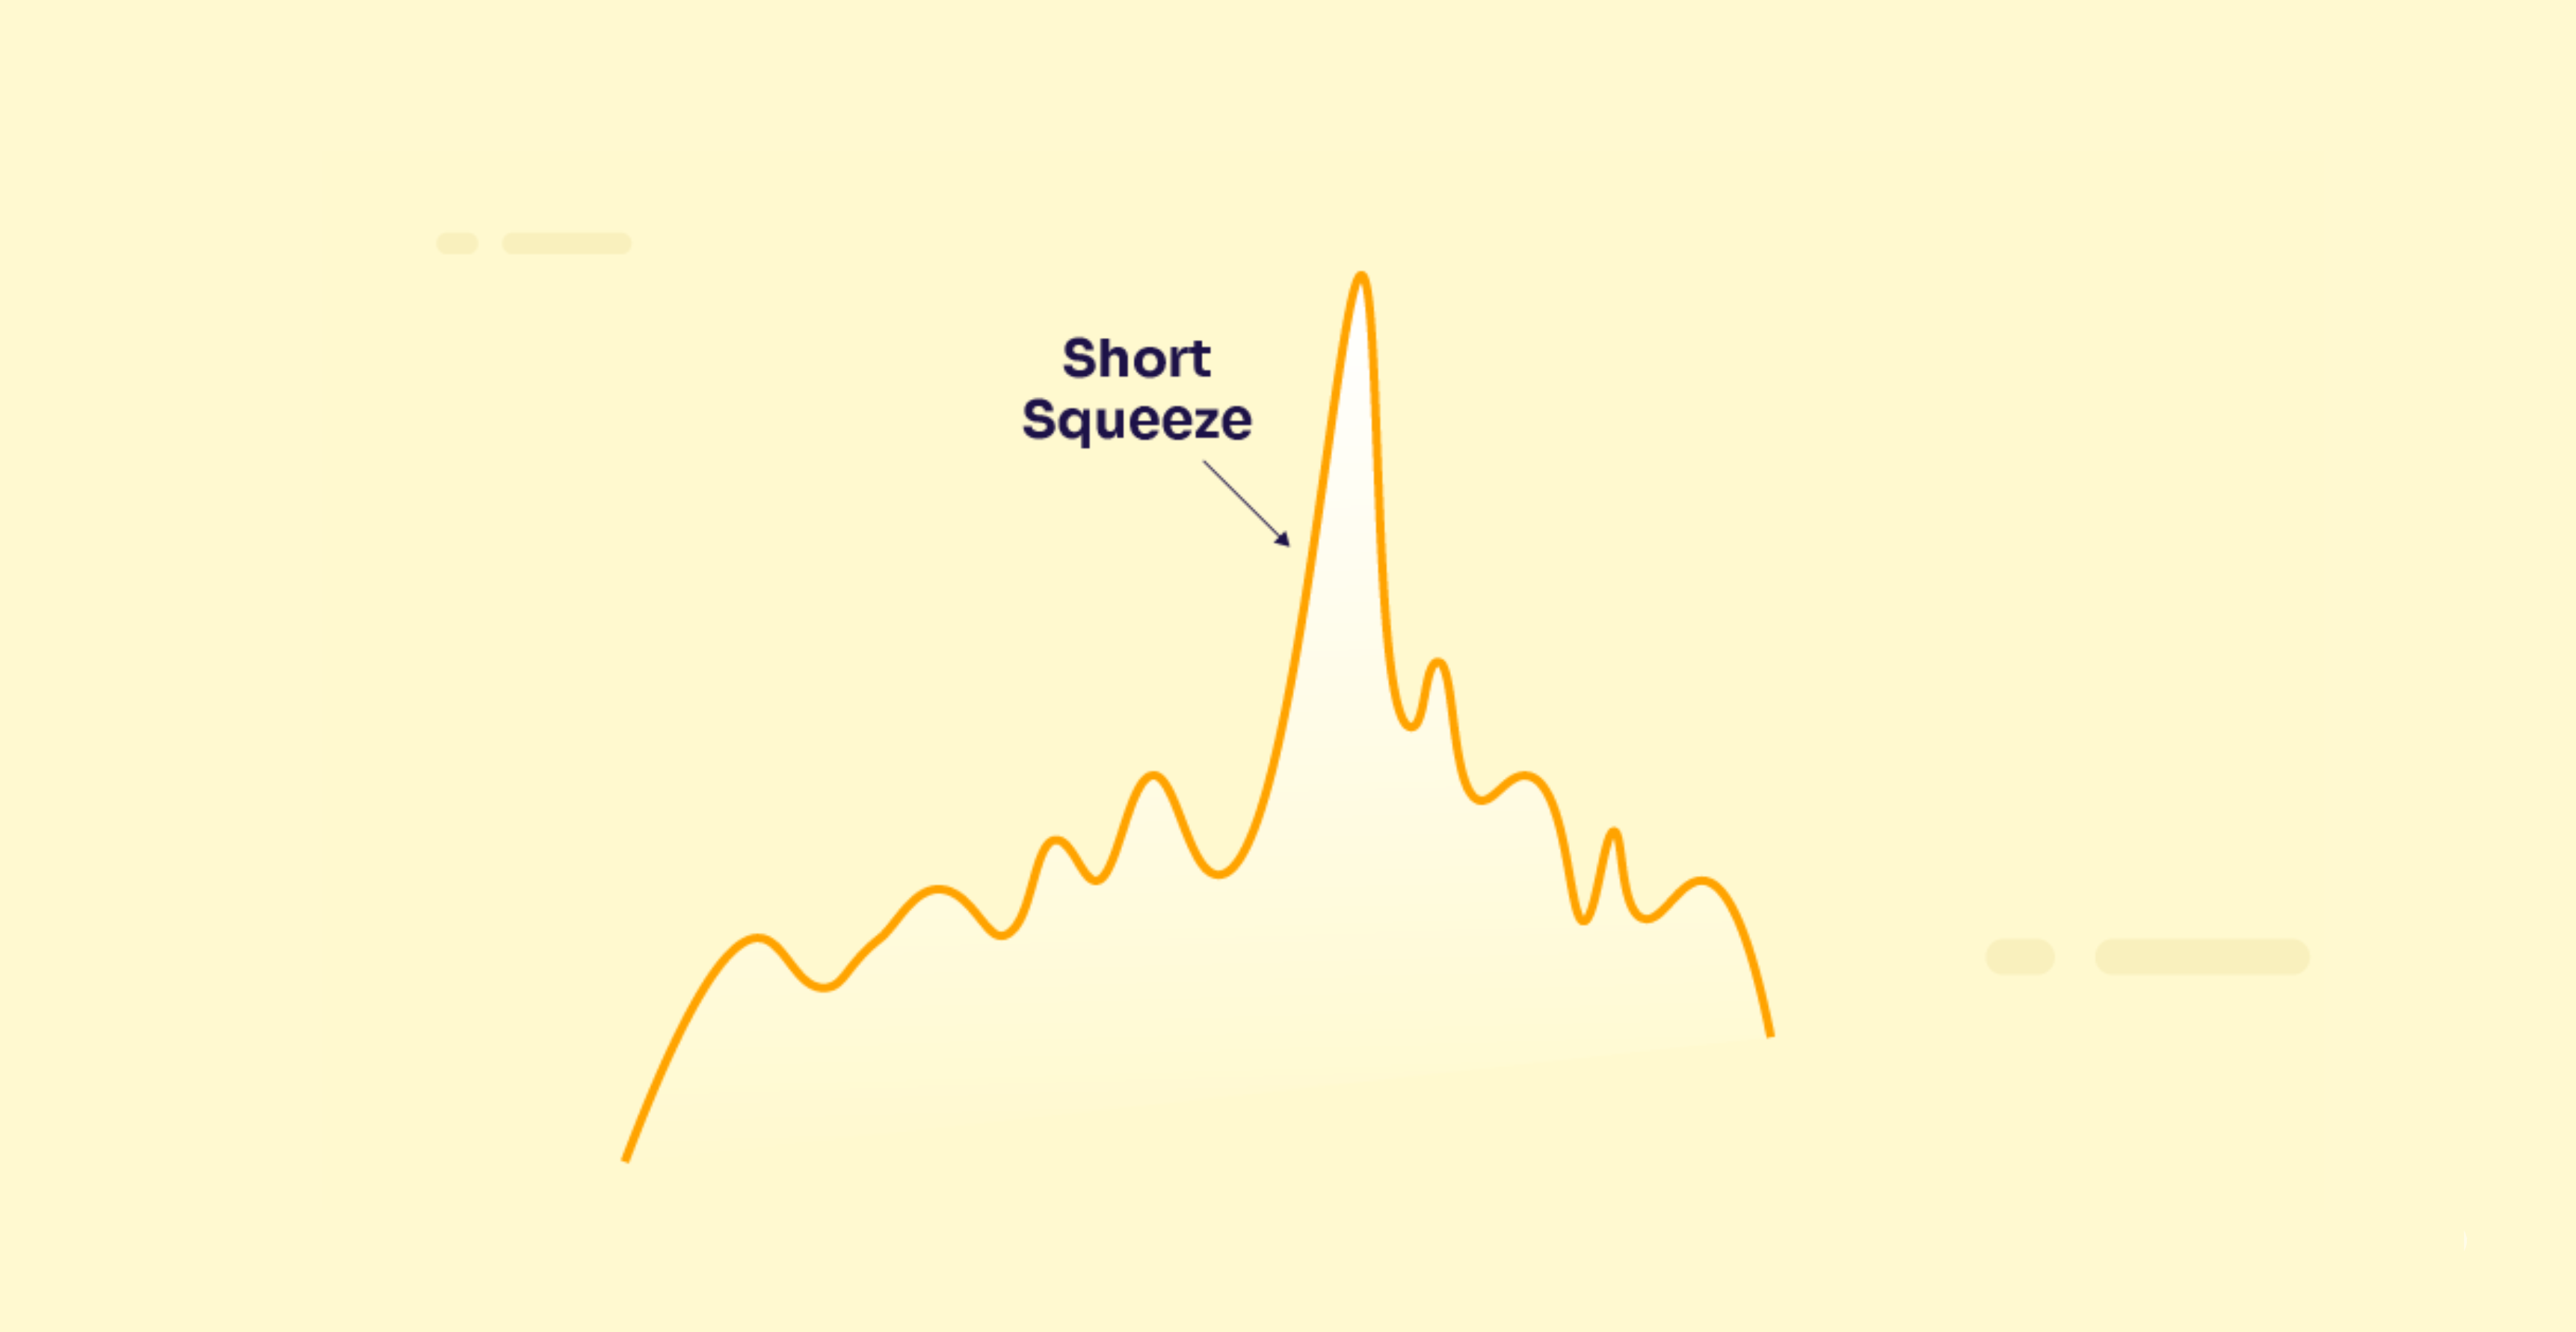
5. The Anatomy of a Squeeze
A classic short squeeze unfolds in a highly predictable, multi-phase cycle:
- Phase 1 — The Crowded Short: The stock is in a persistent downtrend. Negative news or poor fundamentals attract short sellers. Short Interest builds, borrow fees rise, and the trade becomes crowded.
- Phase 2 — The Spark (Trigger): A sudden positive event occurs (unexpected earnings beat, buyout rumors, or momentum spikes).
- Phase 3 — The Stop Sweep: Rising prices sweep past technical stop-losses, triggering buy-to-cover market orders from smaller shorts.
- Phase 4 — The Margin Chain Reaction: As losses expand, brokers liquidate accounts that cannot meet margin calls, forcing automatic buying at any price.
- Phase 5 — The Liquidity Vacuum: The order book thins out. Sellers pull their offers higher, forcing trapped shorts to buy at vertical heights.
- Phase 6 — Exhaustion & Re-Shorting: Forced buying exhaustively finishes. Professional short sellers step back in at highly overvalued prices, starting the descent back to reality.
6. Risk Management & Common Pitfalls
Trading short squeezes is highly lucrative but carries extreme risk. Here is how professionals protect their capital:
- Never Chase the Peak: By the time a stock is up 100% in a session, the mechanical squeeze is likely near its end. You are buying the peak of forced liquidation.
- Avoid Market Orders: Spreads widen dramatically during a squeeze. A market order can execute at a highly unfavorable price. Always use limit orders.
- Do Not Short the Peak Early: Just because a stock is overvalued doesn't mean forced buying has stopped. Wait for structure to break on lower timeframes (e.g., a lower high or CHoCH on the 15-minute chart) before shorting.
7. Indicators & Tools for Spotting Squeezes
To identify a potential squeeze before it occurs, professionals monitor:
- Cost to Borrow (CTB): The annualized fee to borrow shares. Rising CTB (e.g., >30-50%) indicates scarce supply, putting constant financial pressure on shorts.
- Short Utilization Rate: The percentage of borrowed shares actually shorted. 100% utilization means zero shares remain to borrow, increasing mechanical tension.
- Option Flow & Volume: Large blocks of short-dated OTM call options indicate high probability of an incoming Gamma Squeeze.
8. The Re-Short Strategy
The most high-probability way to trade a short squeeze is shorting the backside of the exhaustion:
- Wait for Exhaustion: Do not attempt to top-tick the parabolic move.
- Identify Structure Shift: Look for a clear lower high and structure shift (BOS/CHoCH) on the 15-minute timeframe.
- Volume Exhaustion: Confirm that daily volume is declining as the price begins to roll over.
- Target: Short the lower high retest, place the stop loss above the squeeze high, and target the pre-squeeze base.
9. Criteria for a High-Probability Squeeze
To determine if a setup offers a high probability for a short squeeze (or a long squeeze), you need the convergence of three critical factors:
- X (The Setup): High Short Interest (SI), Days to Cover (DTC), and Cost to Borrow (CTB). The Short Interest should typically be over 15-20% of the float. There must also be a lack of liquidity (DTC > 5) combined with high financial pressure (CTB > 30-50%) on the trapped side.
- Y (The Catalyst): A fundamental or momentum-driven spark. This could be an earnings beat, unexpected positive news, or a significant macro shift that forces the initial wave of buying (or selling, in a long squeeze).
- Z (The Trap): A technical breach of key levels. The price must break through major resistance (or support) and sweep stop-losses, triggering the automatic market orders that fuel the mechanical squeeze.