Volume is one of the most crucial yet often overlooked aspects of trading. It represents the total number of shares, contracts, or lots traded in a given period and provides insight into the strength of price movements. By analyzing volume effectively, traders can identify trends, confirm breakouts, and detect potential reversals before they happen.
Unlike price action alone, volume adds a critical layer of confirmation. A price move supported by high volume is more likely to be sustainable, while a move on low volume may indicate weakness or manipulation. Institutions, hedge funds, and large market players leave footprints through volume, and understanding these patterns can give traders an edge.
Volume Types 🎯
- Volume
- Buy/Sell Volume
- Delta Volume
- Cumulative Delta Volume
- Relative Volume
- Cumulative Relative Volume
- Open Interest
- Volume Profile
01. Volume 🔥
In trading, volume refers to the total quantity of assets traded during a specific time frame, whether they are stocks, futures contracts, options, or currencies. It measures the activity level of a security and provides insights into the strength or weakness of price movements.
Volume Analysis
Key aspects:
- Market sentiment: High volume often indicates strong interest in a security and can signal the strength of a price move. Conversely, low volume may suggest a lack of interest and can indicate that price movements may not be sustainable.
- Liquidity: High volume generally indicates better liquidity, meaning it is easier to enter and exit positions without significantly impacting the asset’s price. Low volume may lead to higher slippage and greater price volatility.
- Volume spikes: Extremely high volume after a prolonged trend may signal the end of that trend (blow-off tops or panic selling bottoms).
- Market types: Volume can vary by market type. In stock markets, it is usually reported in shares. In futures and options, it is reported in contracts, while in Forex, it is often measured by tick volume (the number of price changes).
- Impact on market orders & liquidity:
- High Volume = Lower Slippage: Large orders can be executed more efficiently in high-volume environments.
- Low Volume = Higher Volatility: Thin order books in low-volume markets can lead to erratic price swings and wider bid-ask spreads.
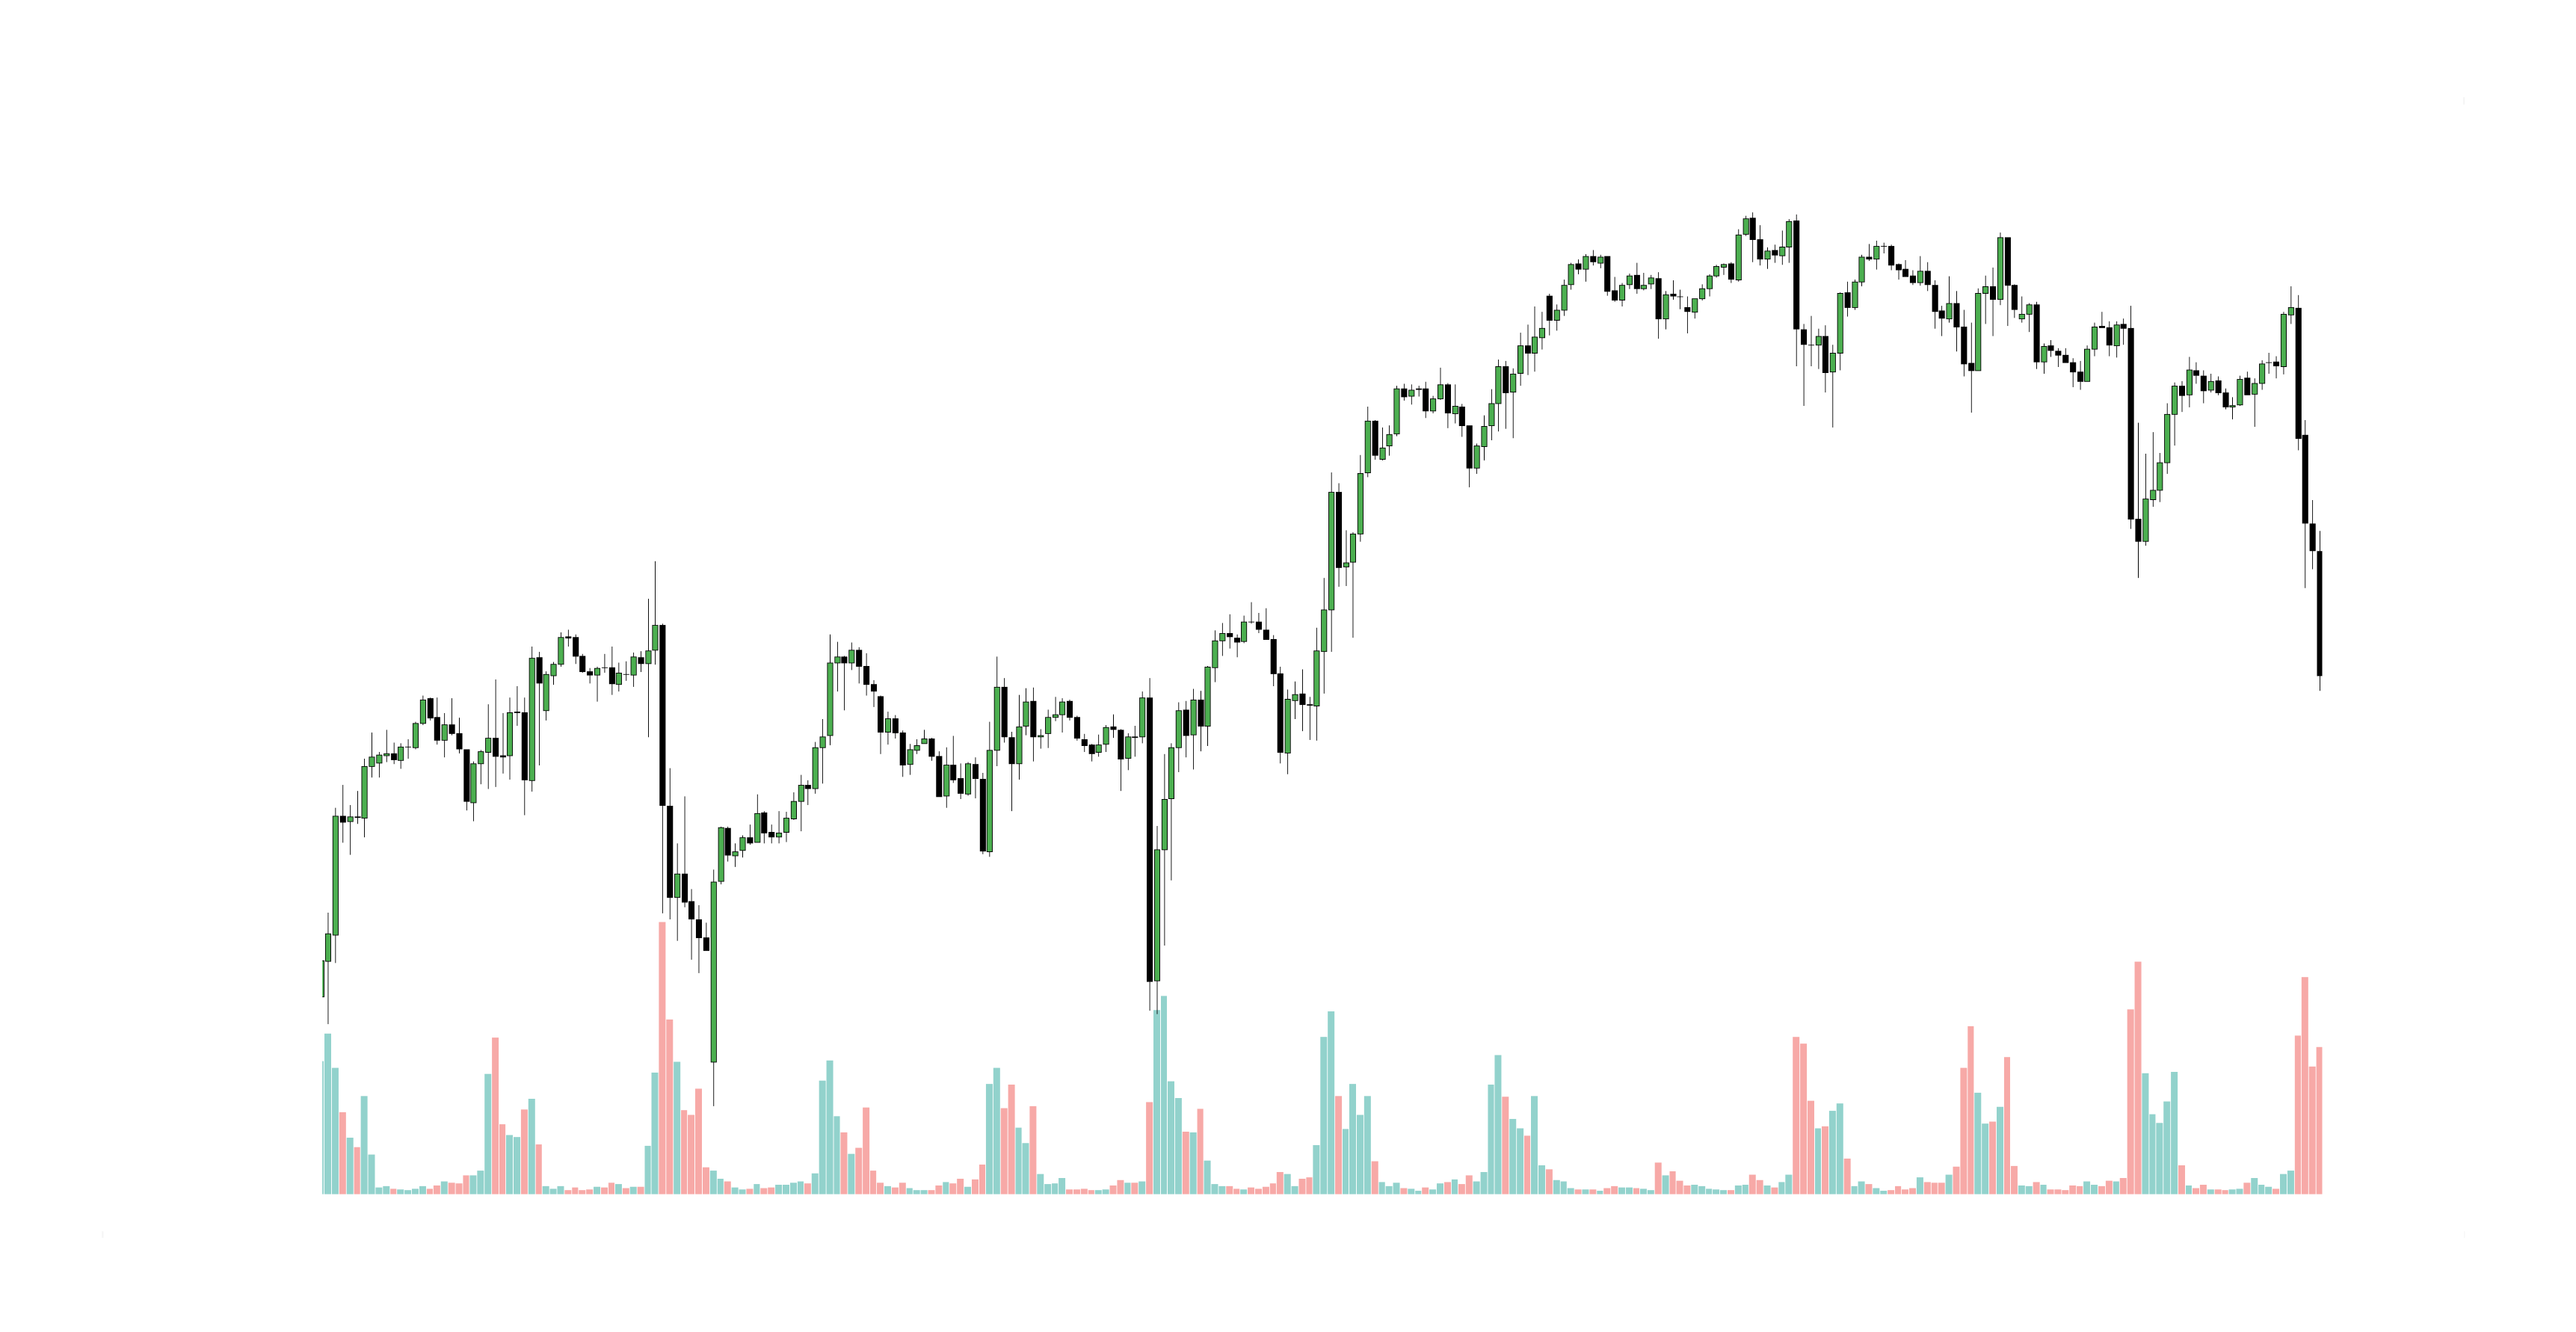
02. Buy/Sell Volume 💹
Buy volume and sell volume are key metrics that indicate the level of buying and selling activity in a market. They help traders assess the strength of price movements and market sentiment.
Buy/Sell Volume Pressure
Buy Volume
Buy volume represents the number of shares, contracts, or lots traded at the ask price (or higher). It occurs when buyers are willing to pay the seller’s asking price, indicating buying pressure and potential bullish sentiment.
How buy volume is measured:
- Transactions that execute at the ask price are counted as buy volume.
- In some cases, aggressive market orders (where buyers take liquidity) are considered buy volume.
- Buy volume is often compared to total volume to determine demand strength.
Sell Volume
Sell volume represents the number of shares, contracts, or lots traded at the bid price (or lower). It occurs when sellers accept the buyer’s bid price, indicating selling pressure and potential bearish sentiment.
How sell volume is measured:
- Transactions executed at the bid price are counted as sell volume.
- Market sell orders (where sellers take liquidity) contribute to sell volume.
- Higher sell volume relative to buy volume suggests downward price pressure.
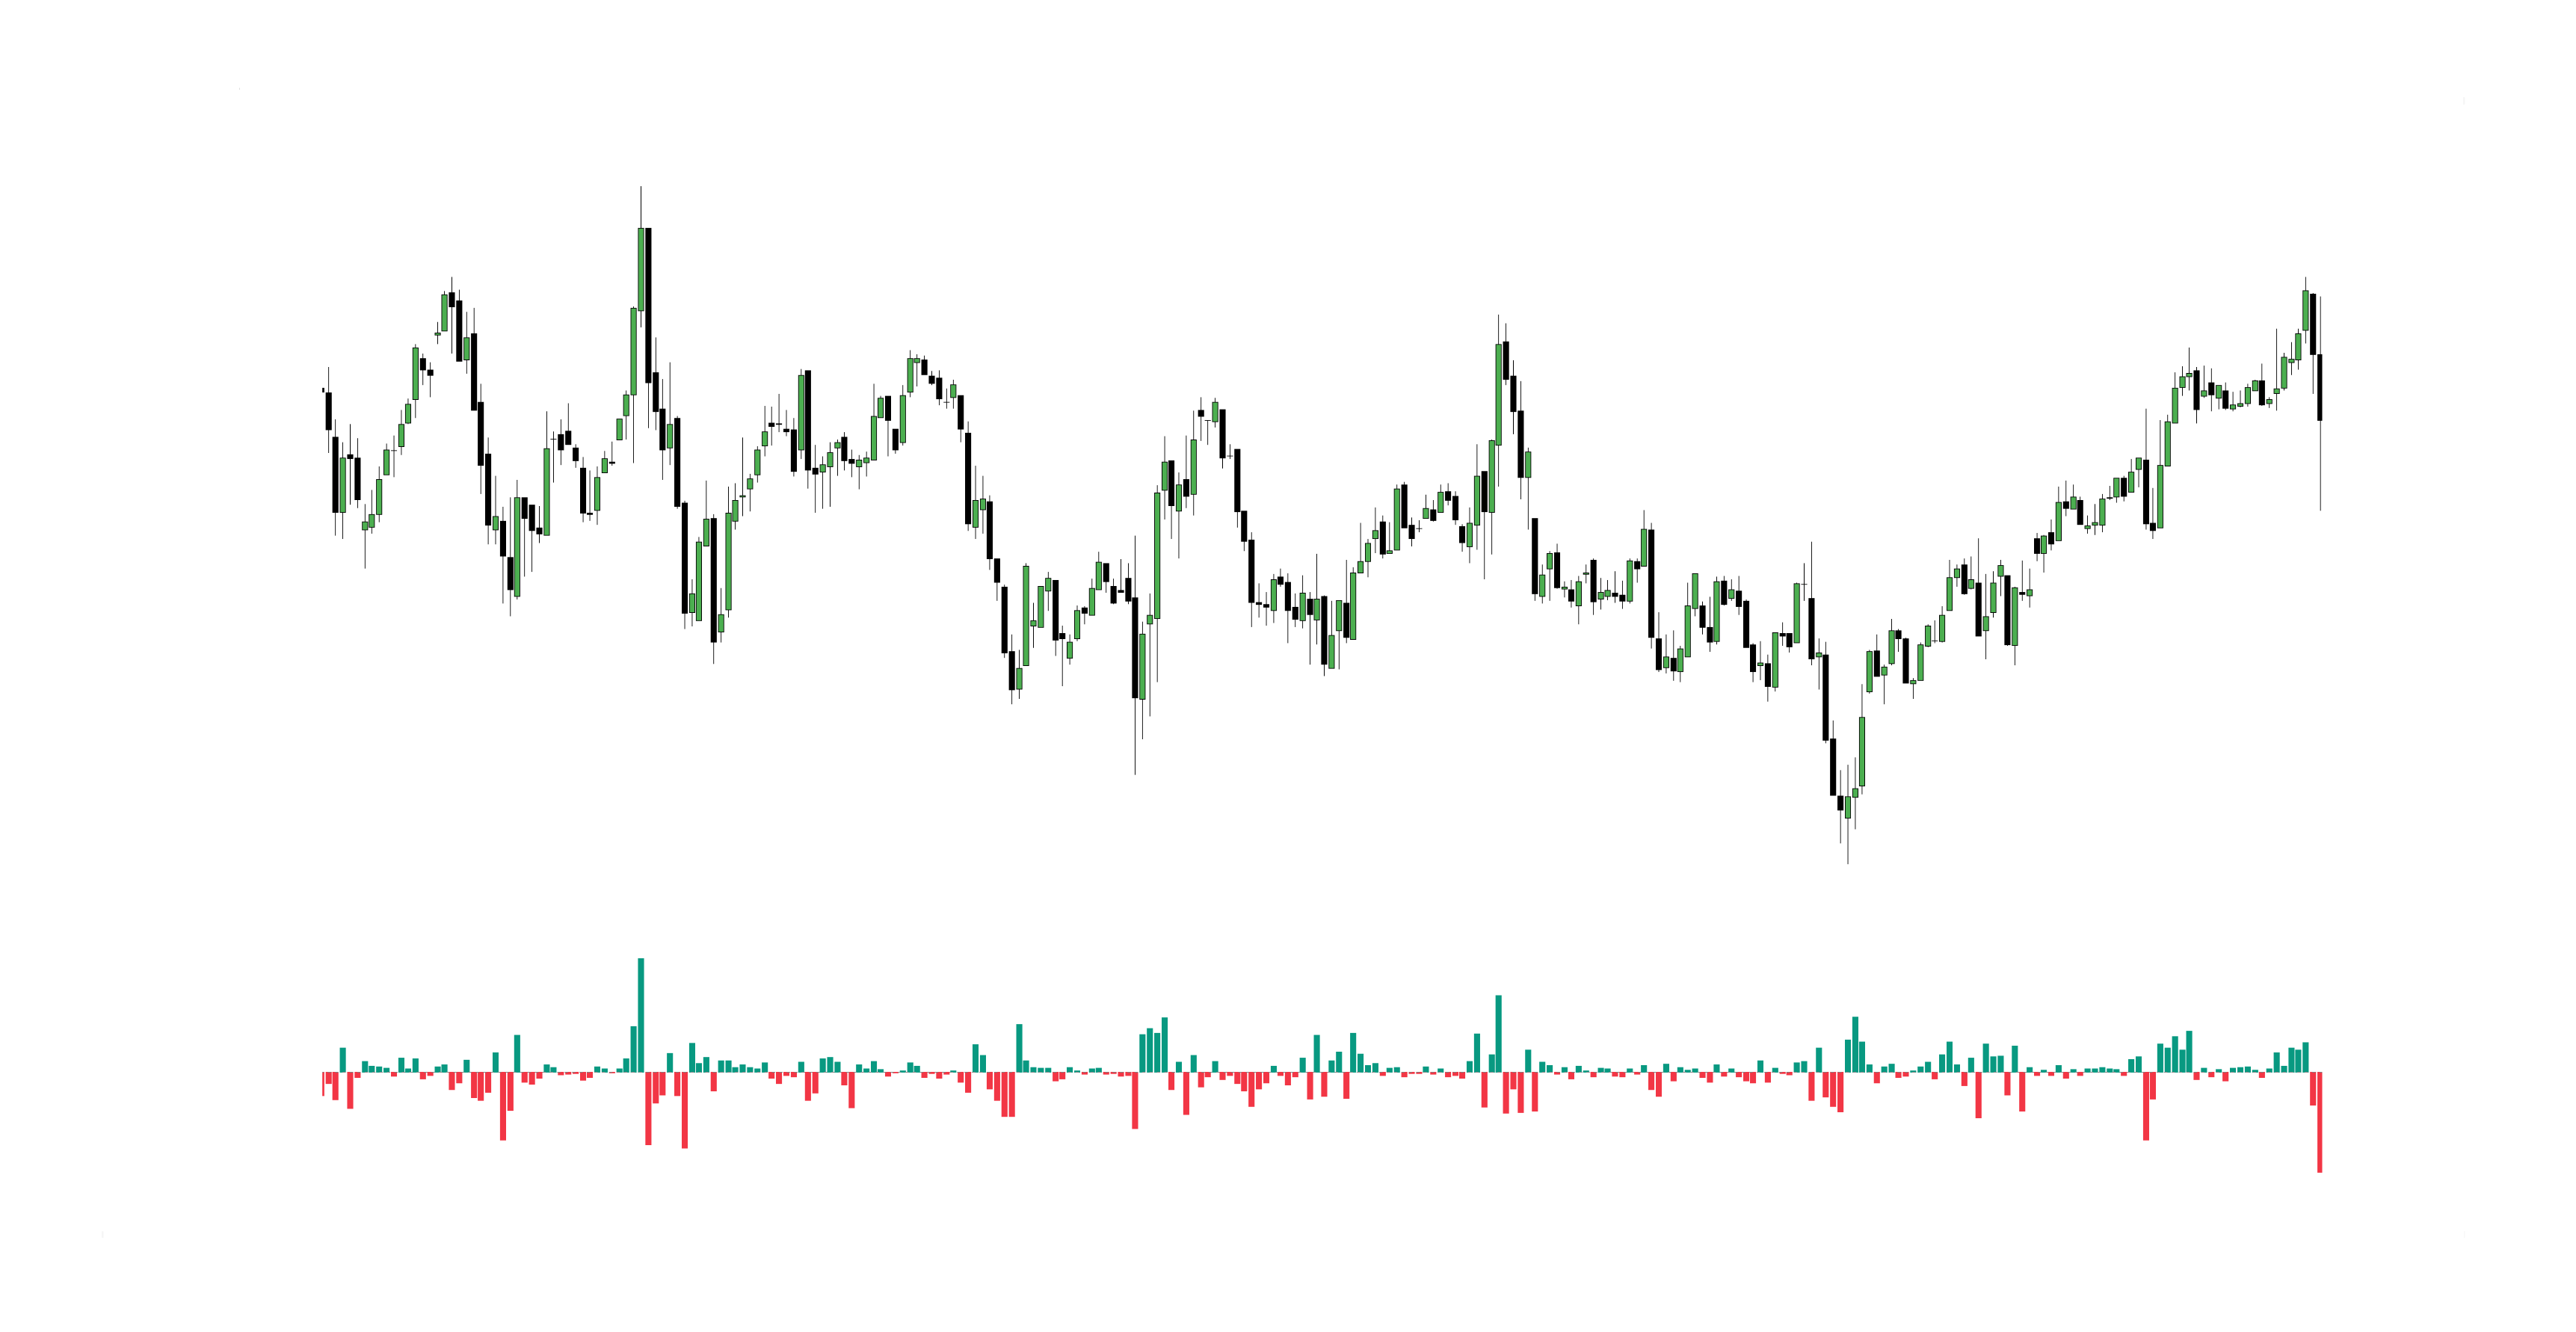
03. Delta Volume ✨
Delta Volume (often referred to as Volume Delta) is a key order flow metric that measures the difference between buy volume and sell volume over a given period.
Delta Volume Order Flow
Calculation
Delta Volume is defined as: Delta Volume = Buy Volume − Sell Volume
Where:
- Buy Volume is the total volume transacted at the ask price (aggressive buying).
- Sell Volume is the total volume transacted at the bid price (aggressive selling).
Interpretation
- Positive Delta (Buy Volume > Sell Volume): Indicates more aggressive buying, suggesting bullish momentum.
- Negative Delta (Sell Volume > Buy Volume): Indicates more aggressive selling, suggesting bearish momentum.
- Near Zero Delta: Indicates a balance between buyers and sellers, often seen in range-bound markets.
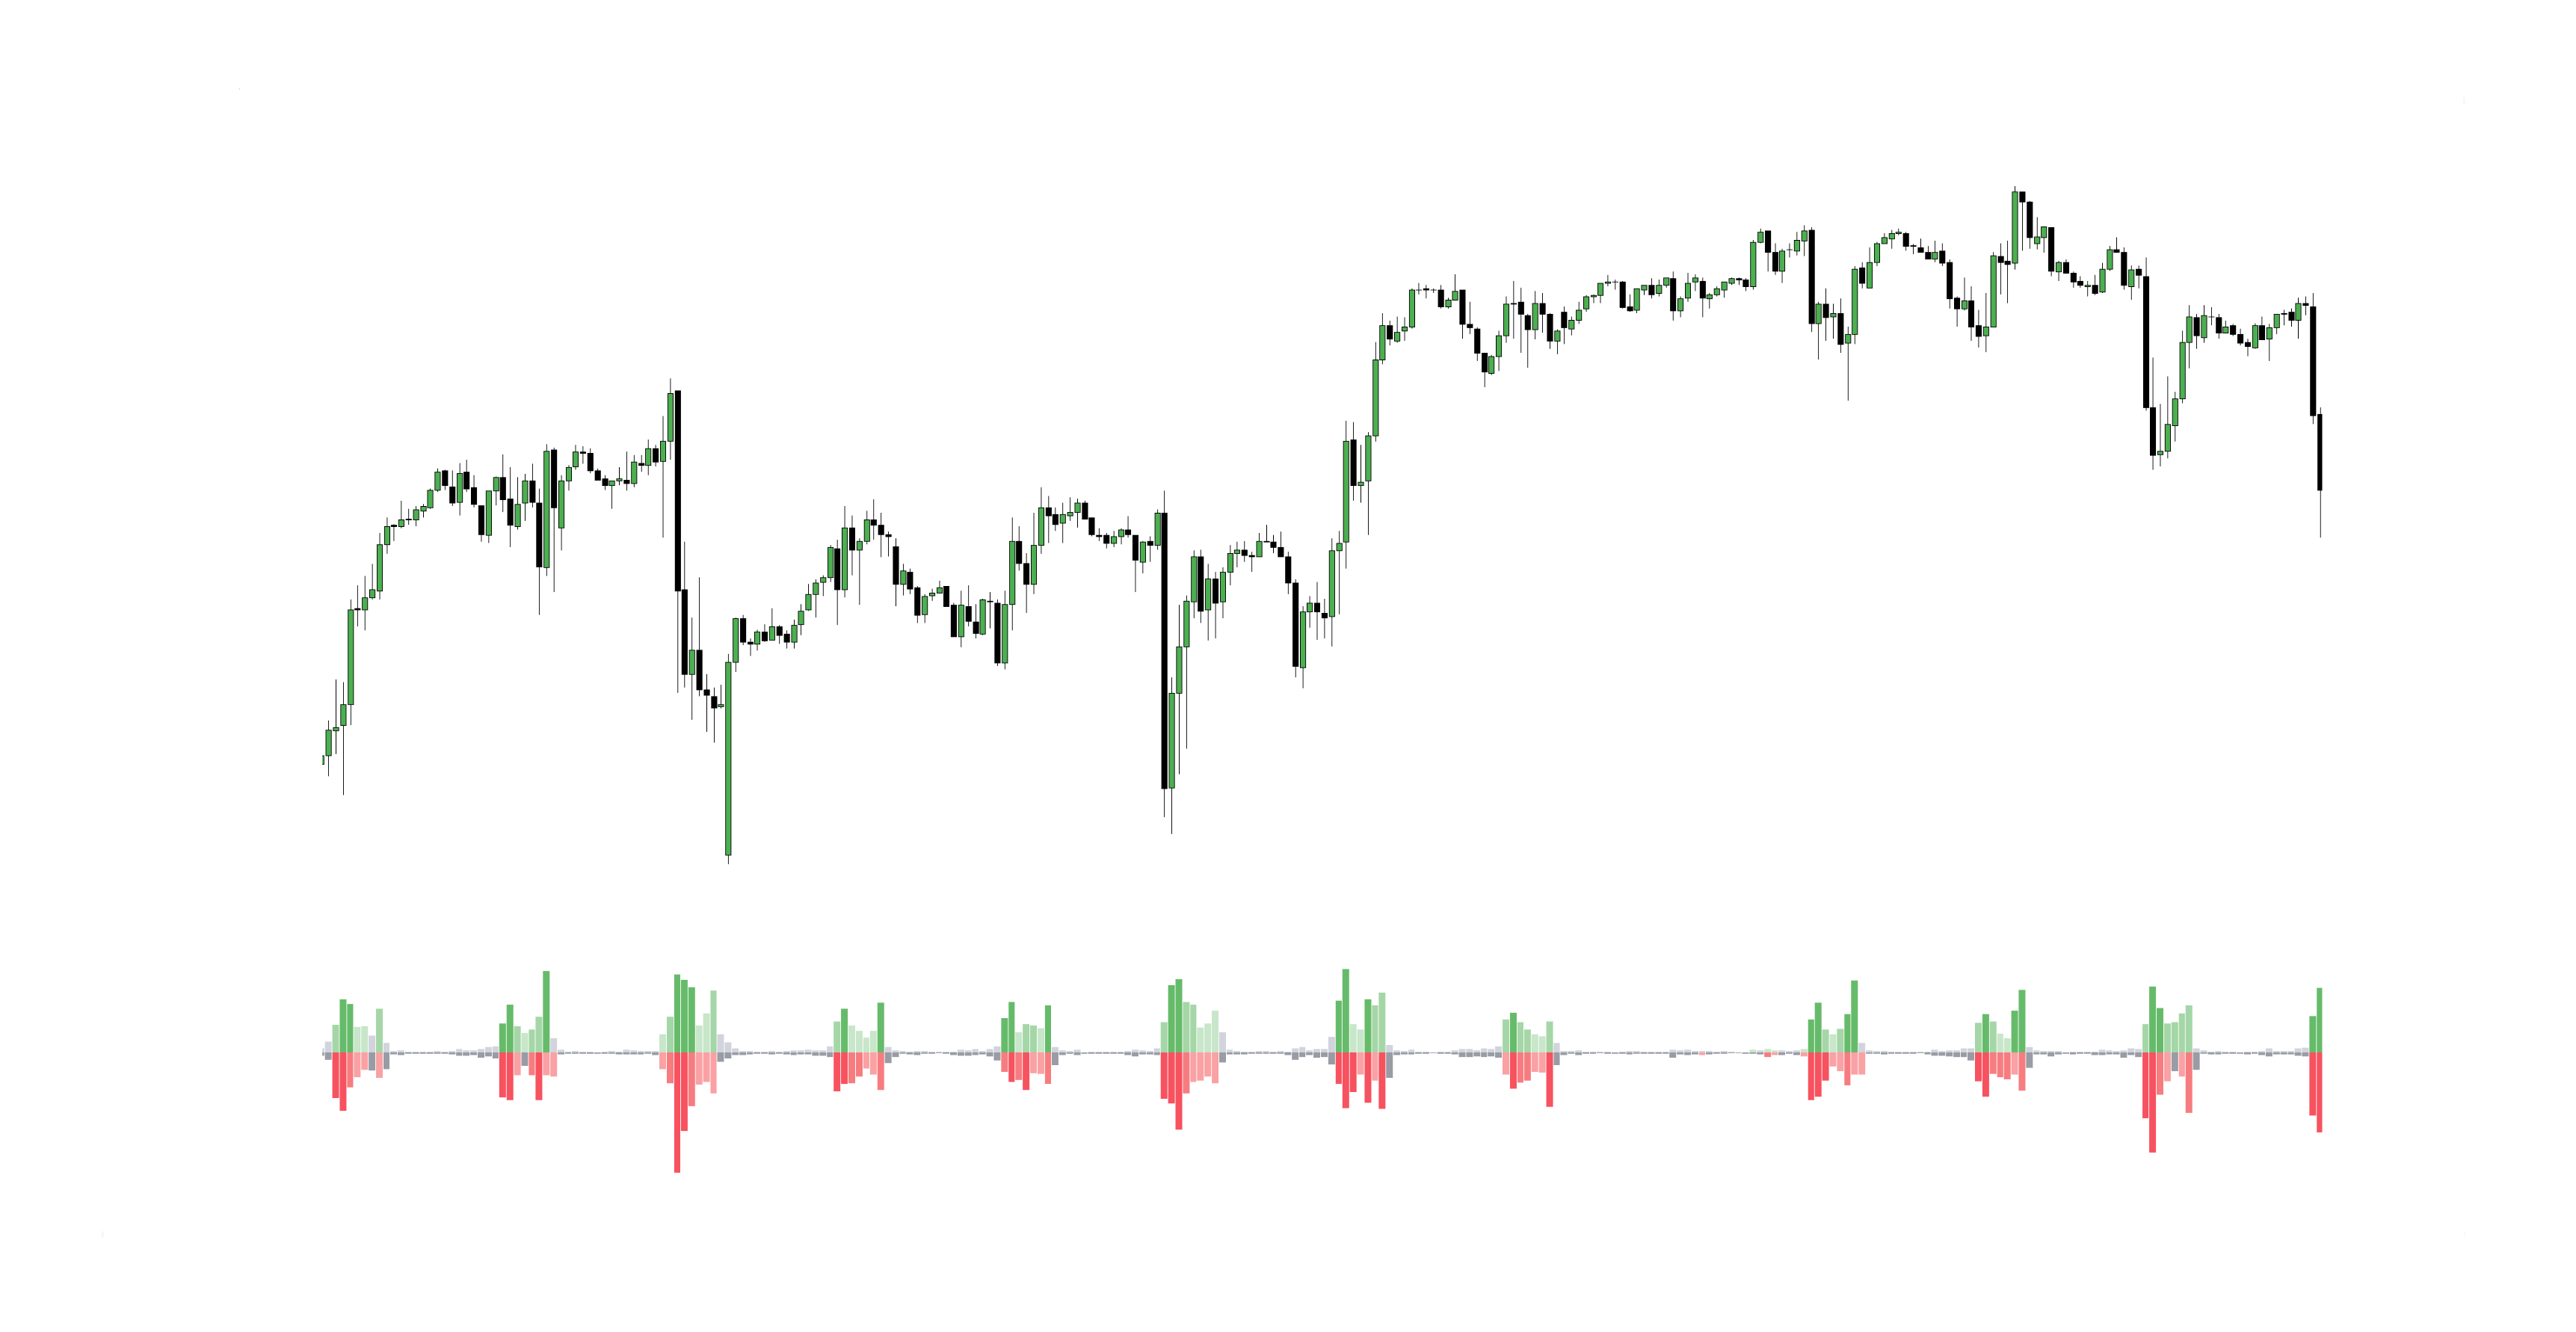
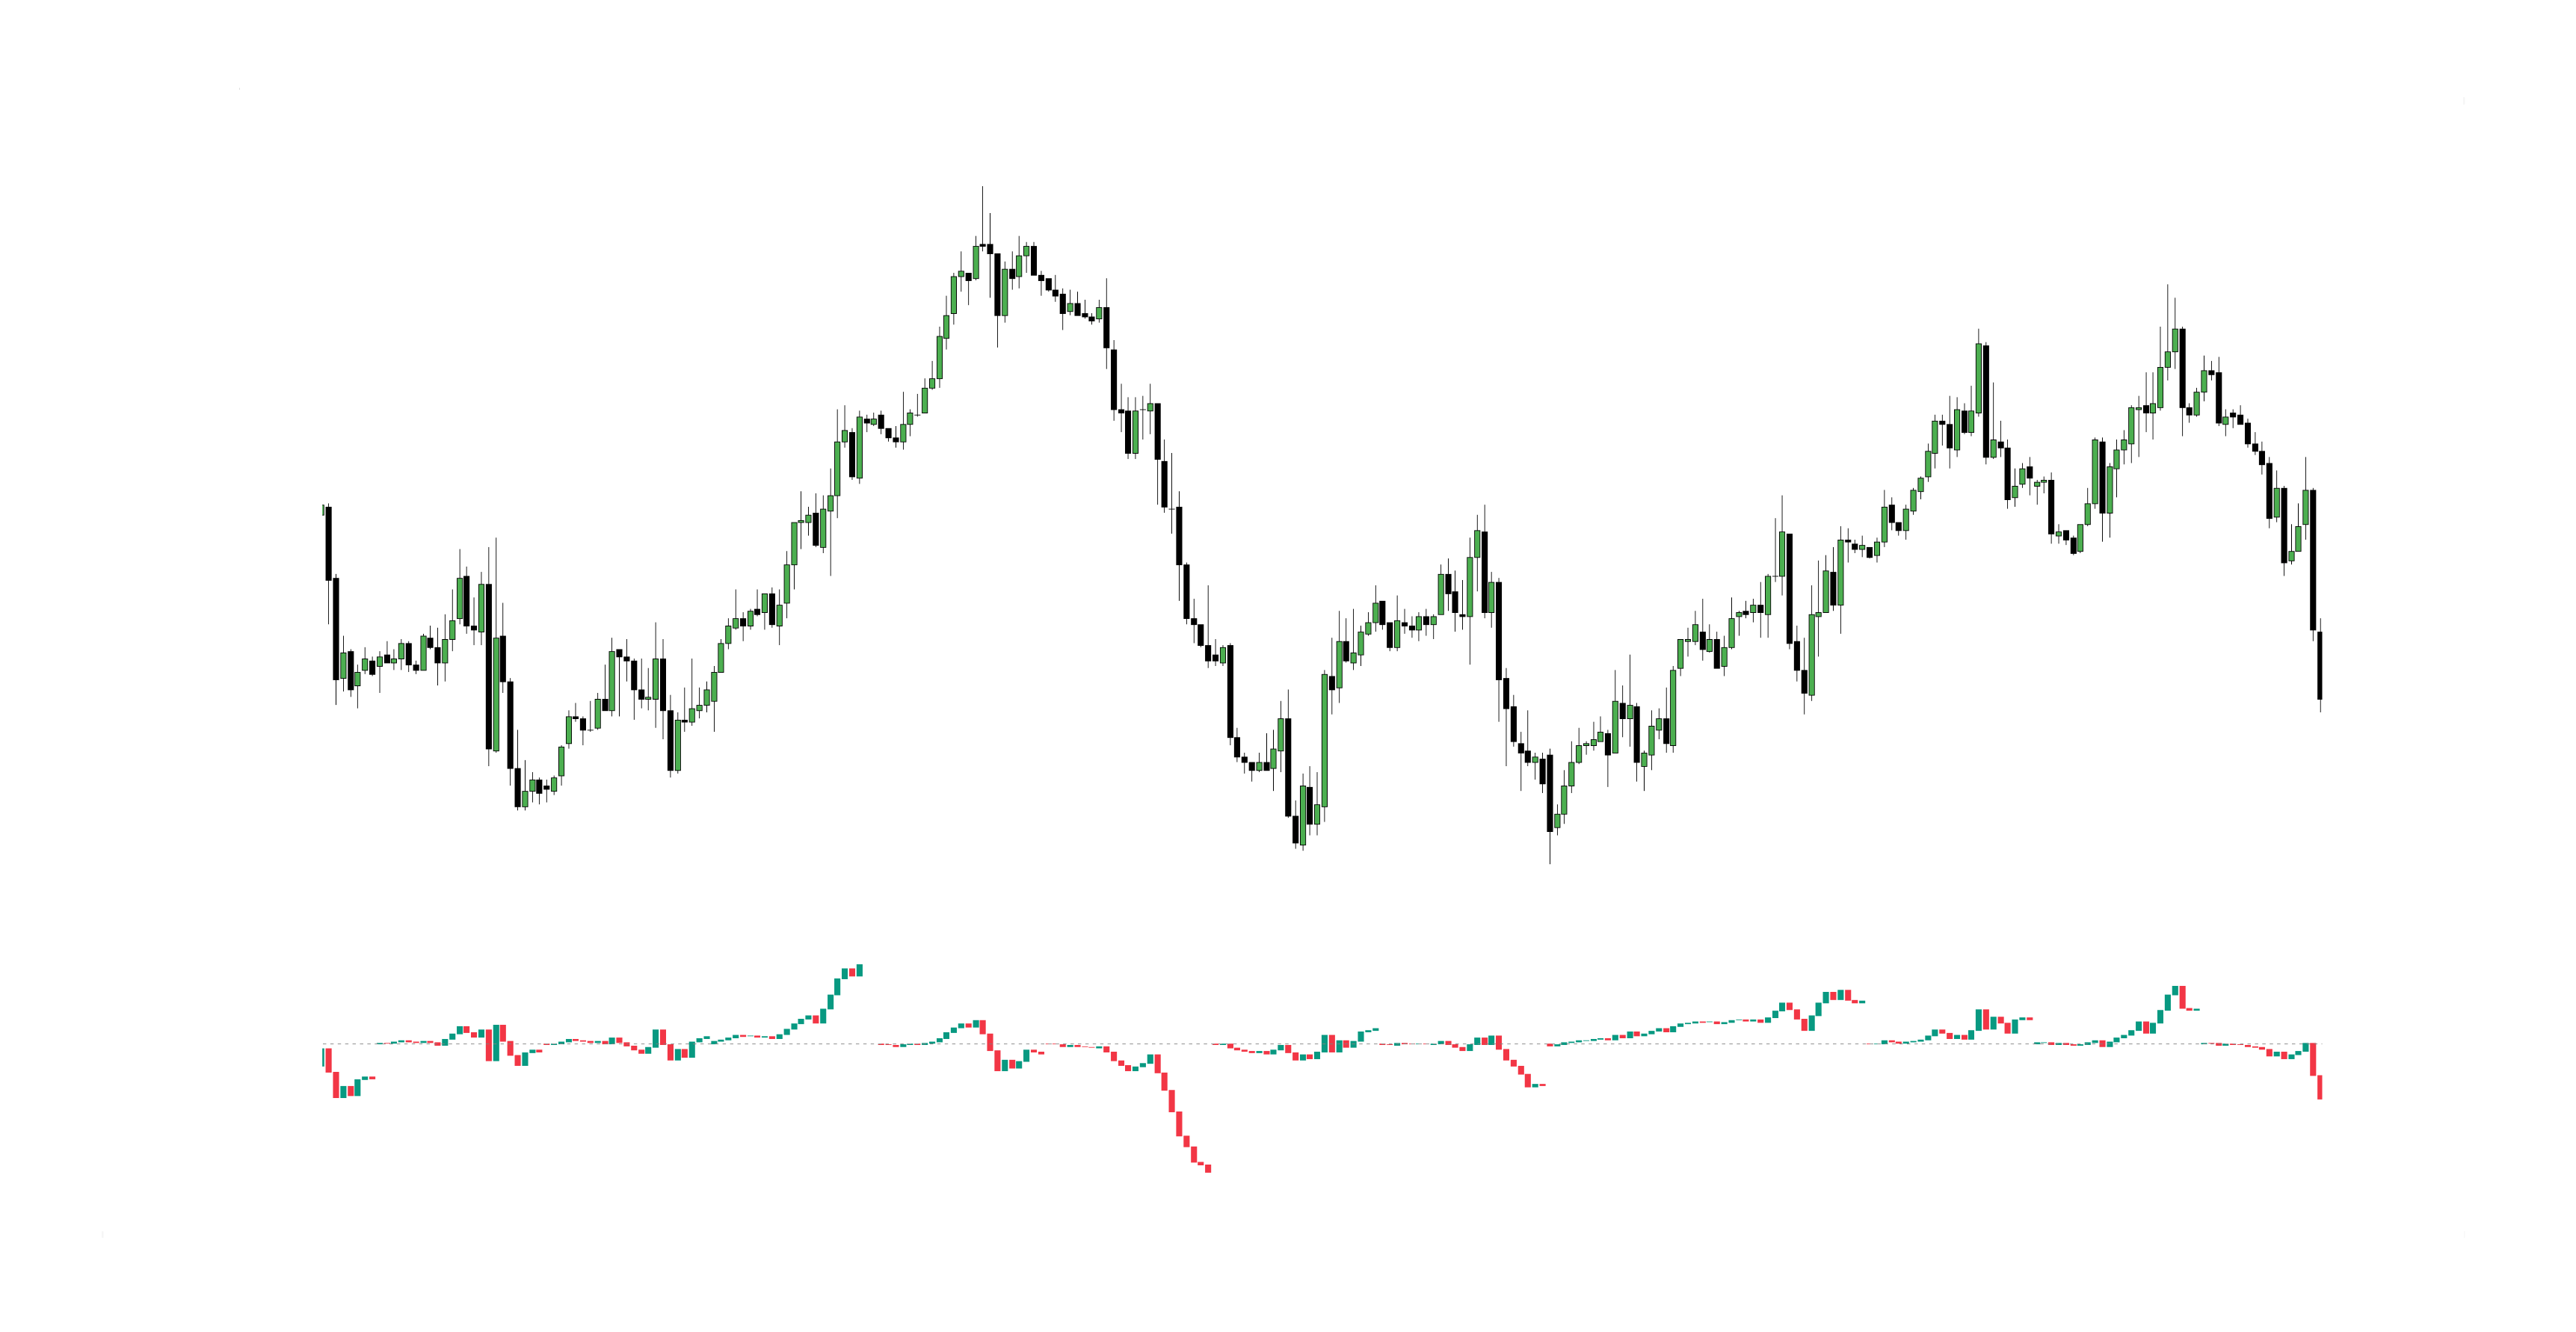
04. Cumulative Delta Volume ⚡
Cumulative Delta Volume (CVD) is an advanced order flow metric that tracks the cumulative sum of Delta Volume over time.
Cumulative Delta Volume (CVD)
Calculation
CVD_t = CVD_{t-1} + (Buy Volume − Sell Volume)
Where:
- Buy Volume = Volume transacted at the ask price (aggressive buying).
- Sell Volume = Volume transacted at the bid price (aggressive selling).
- CVD_t = Current cumulative delta value.
- CVD_{t-1} = Previous cumulative delta value.
Interpretation
- Rising CVD (Positive Delta Accumulation): Buyers are dominating, indicating bullish momentum.
- Falling CVD (Negative Delta Accumulation): Sellers are in control, signaling bearish momentum.
- Flat or Divergent CVD: A divergence between price and CVD can indicate potential reversals or absorption by large traders.
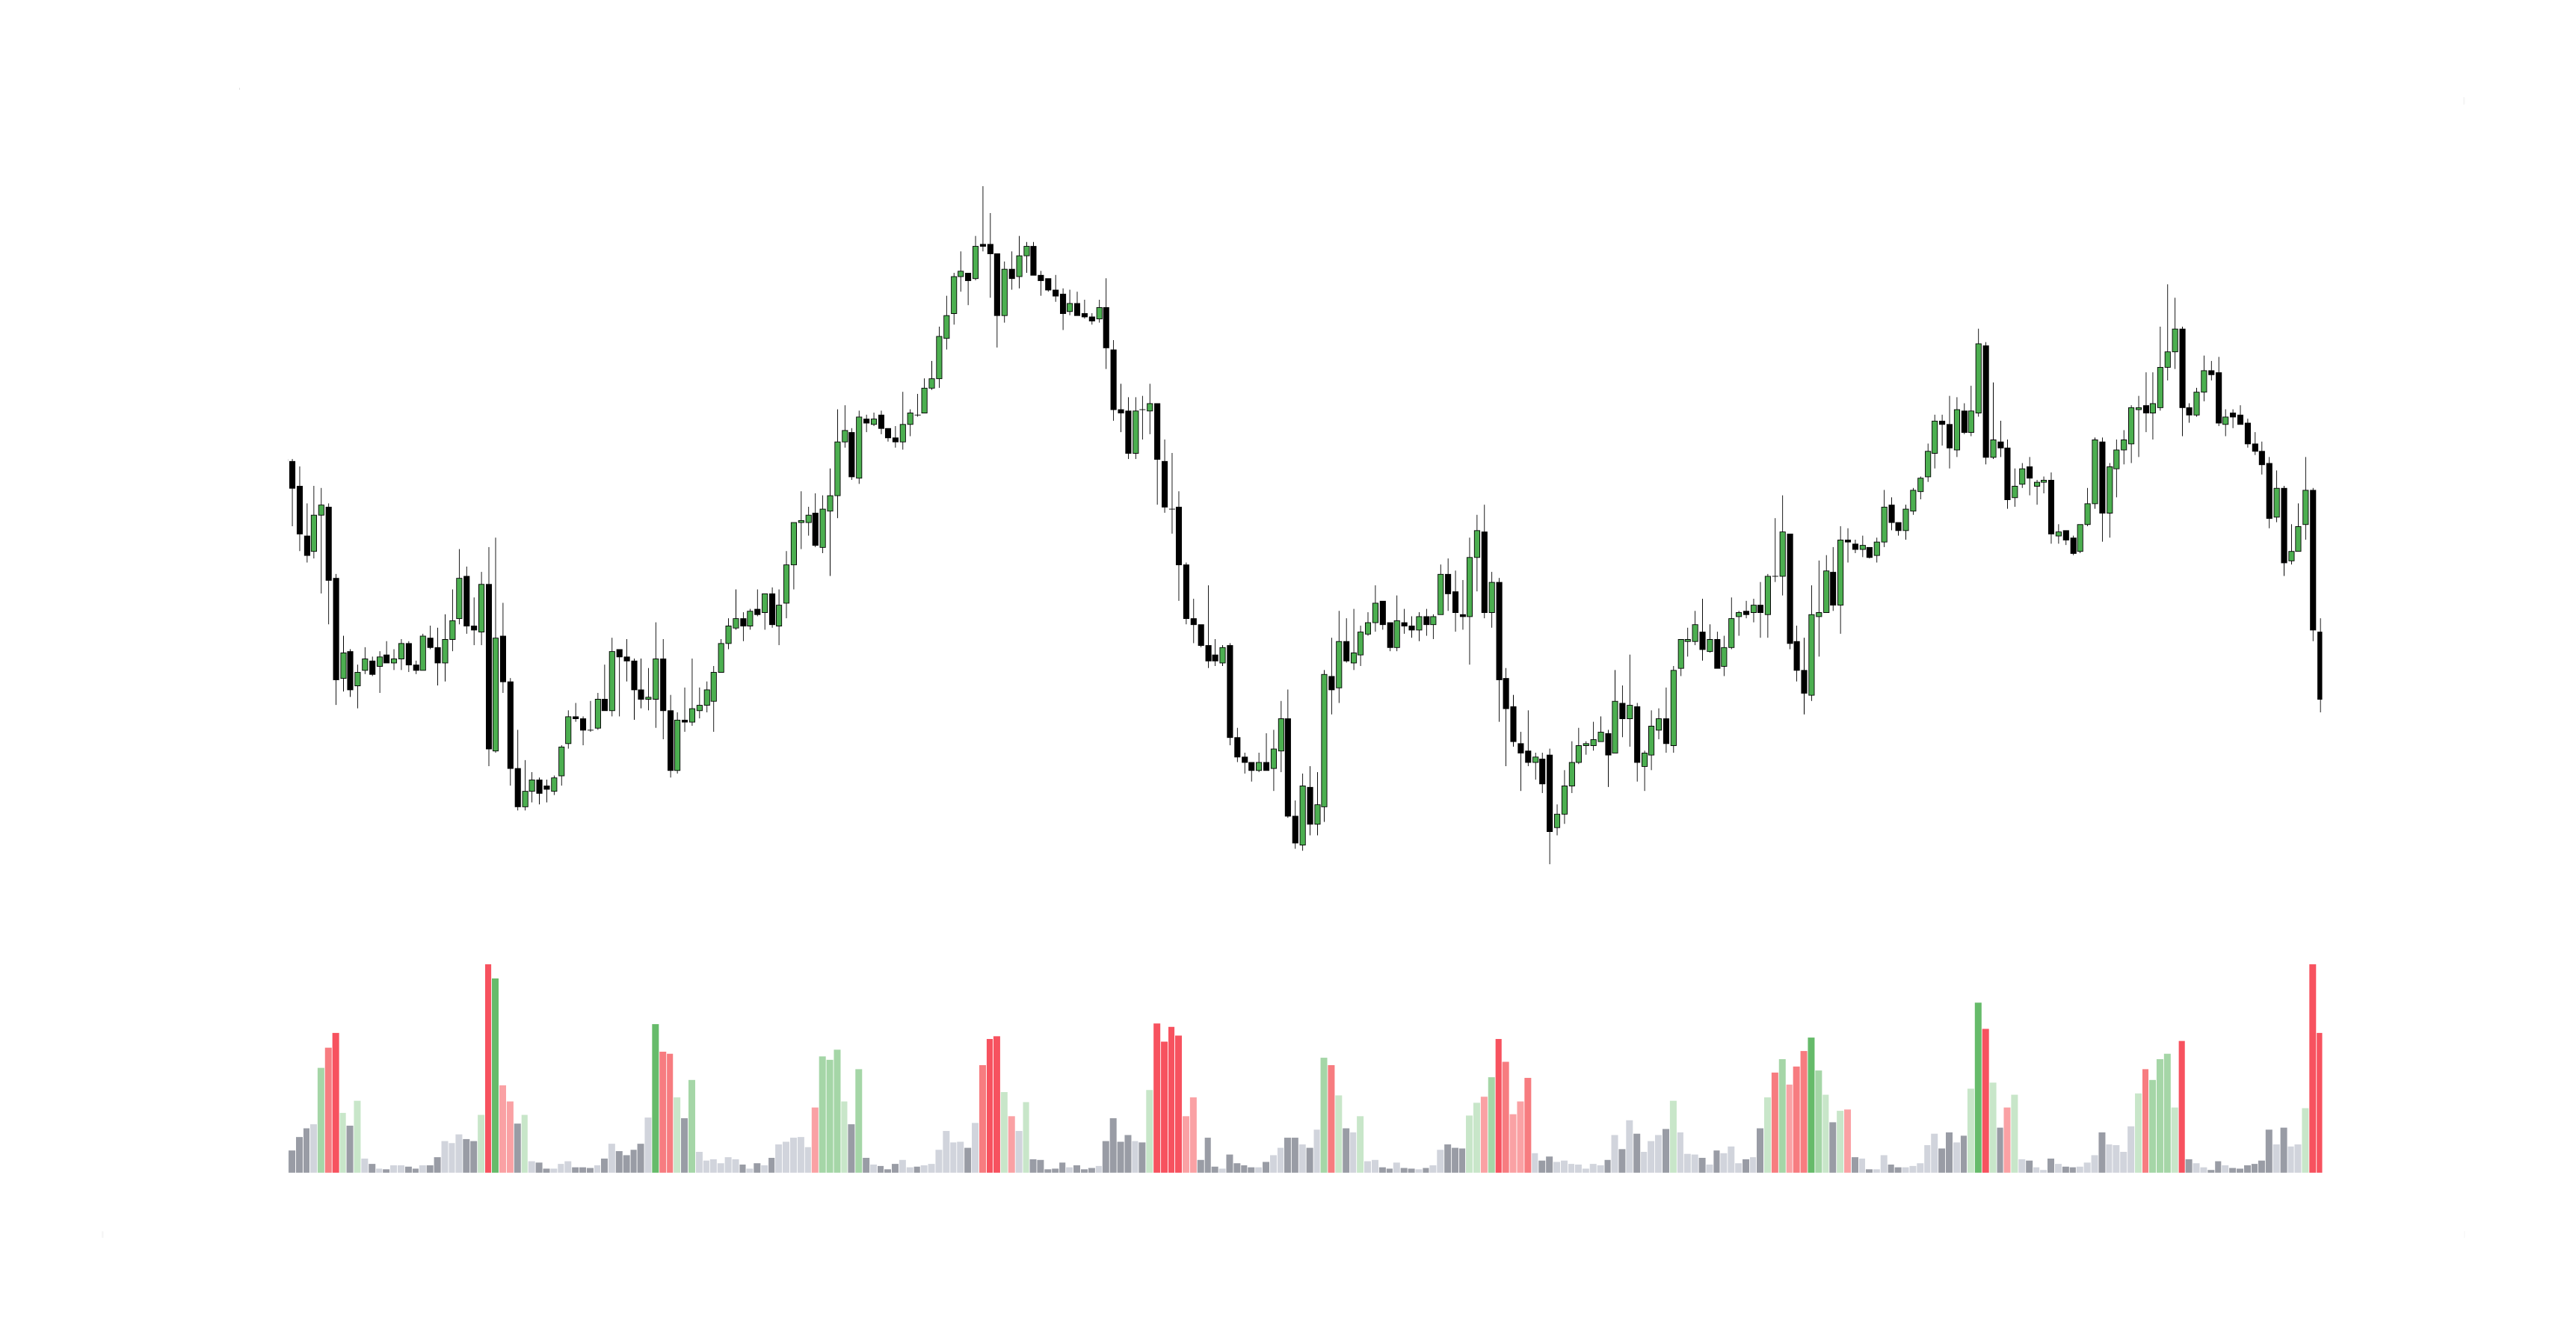
05. Relative Volume 📉
Relative Volume (RVOL) is a key trading metric that measures current trading volume compared to its historical average over a specified period. It helps traders assess whether a security is experiencing unusual trading activity and provides insights into liquidity, volatility, and potential price movements.
Relative Volume (RVOL) Activity
Calculation
Relative Volume is typically expressed as a ratio:
RVOL = Current Volume / Average Volume Over A Given Period
Where:
- Current Volume = The total shares/contracts traded in the current period (e.g., 1-minute, 5-minute, daily).
- Average Volume = The average volume over a past period (e.g., 10-day average, 50-day average).
A higher RVOL (>1) means the security is trading at above-average volume, while a lower RVOL (<1) indicates below-average activity.
Interpretation
- RVOL > 2: Indicates significantly higher-than-normal volume, often linked to news events, earnings reports, or breakout trends.
- RVOL around 1: Suggests normal trading activity with no unusual volume spikes.
- RVOL < 1: Indicates low trading activity, which may lead to weak price movements and lower liquidity.
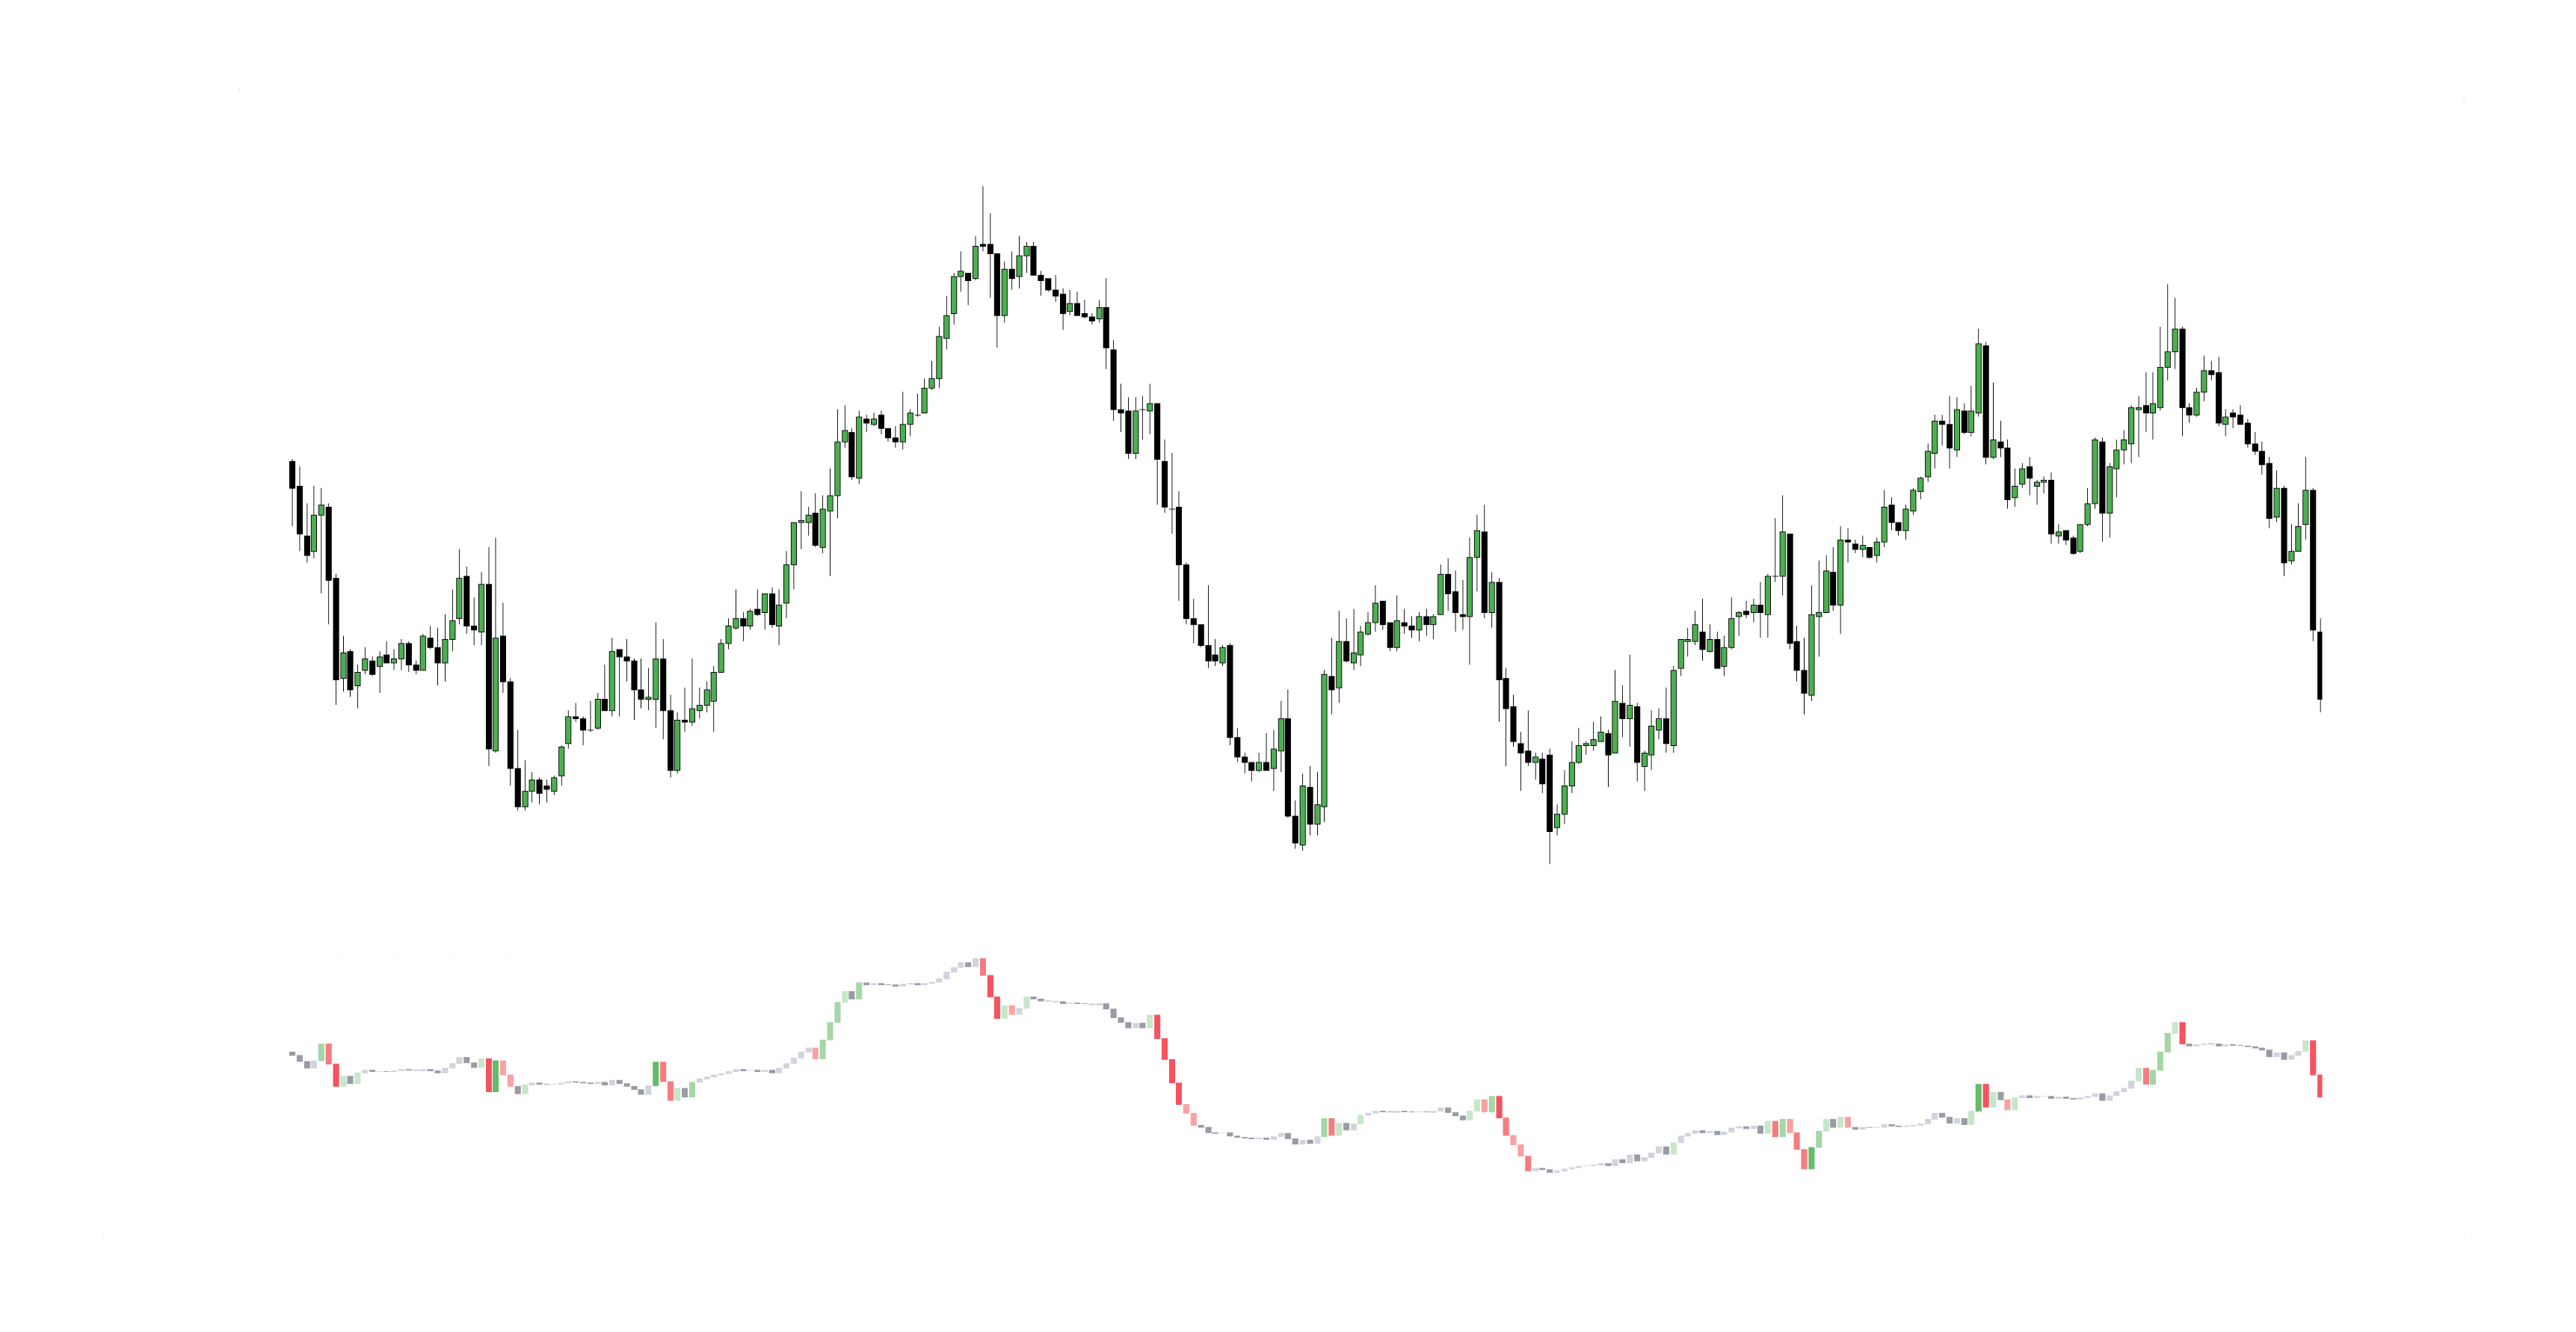
06. Cumulative Relative Volume 💥
Cumulative Relative Volume (CRVOL) is an advanced volume metric that tracks the total volume traded throughout a session relative to its historical average at the same time of day.
Cumulative Relative Volume (CRVOL)
Calculation
Cumulative Relative Volume compares the ongoing total volume at a given point in time to the average cumulative volume at that same time over a historical period.
CRVOL = Cumulative Volume at Time X / Average Cumulative Volume at Time X over N periods
Where:
- Cumulative Volume at Time X = The total volume traded from market open up to time X.
- Average Cumulative Volume at Time X = The average total volume at that point in time over a selected historical period (e.g., 10 days).
- N periods = The number of historical sessions used for comparison.
A CRVOL > 1 indicates higher-than-normal trading activity, while CRVOL < 1 suggests lower-than-average activity.
Interpretation
- CRVOL > 1.5: Significantly higher trading activity than usual, often linked to news events, earnings reports, or institutional participation.
- CRVOL ≈ 1: Normal trading volume, suggesting typical market conditions.
- CRVOL < 0.8: Below-average trading volume, often indicating low liquidity and reduced volatility.
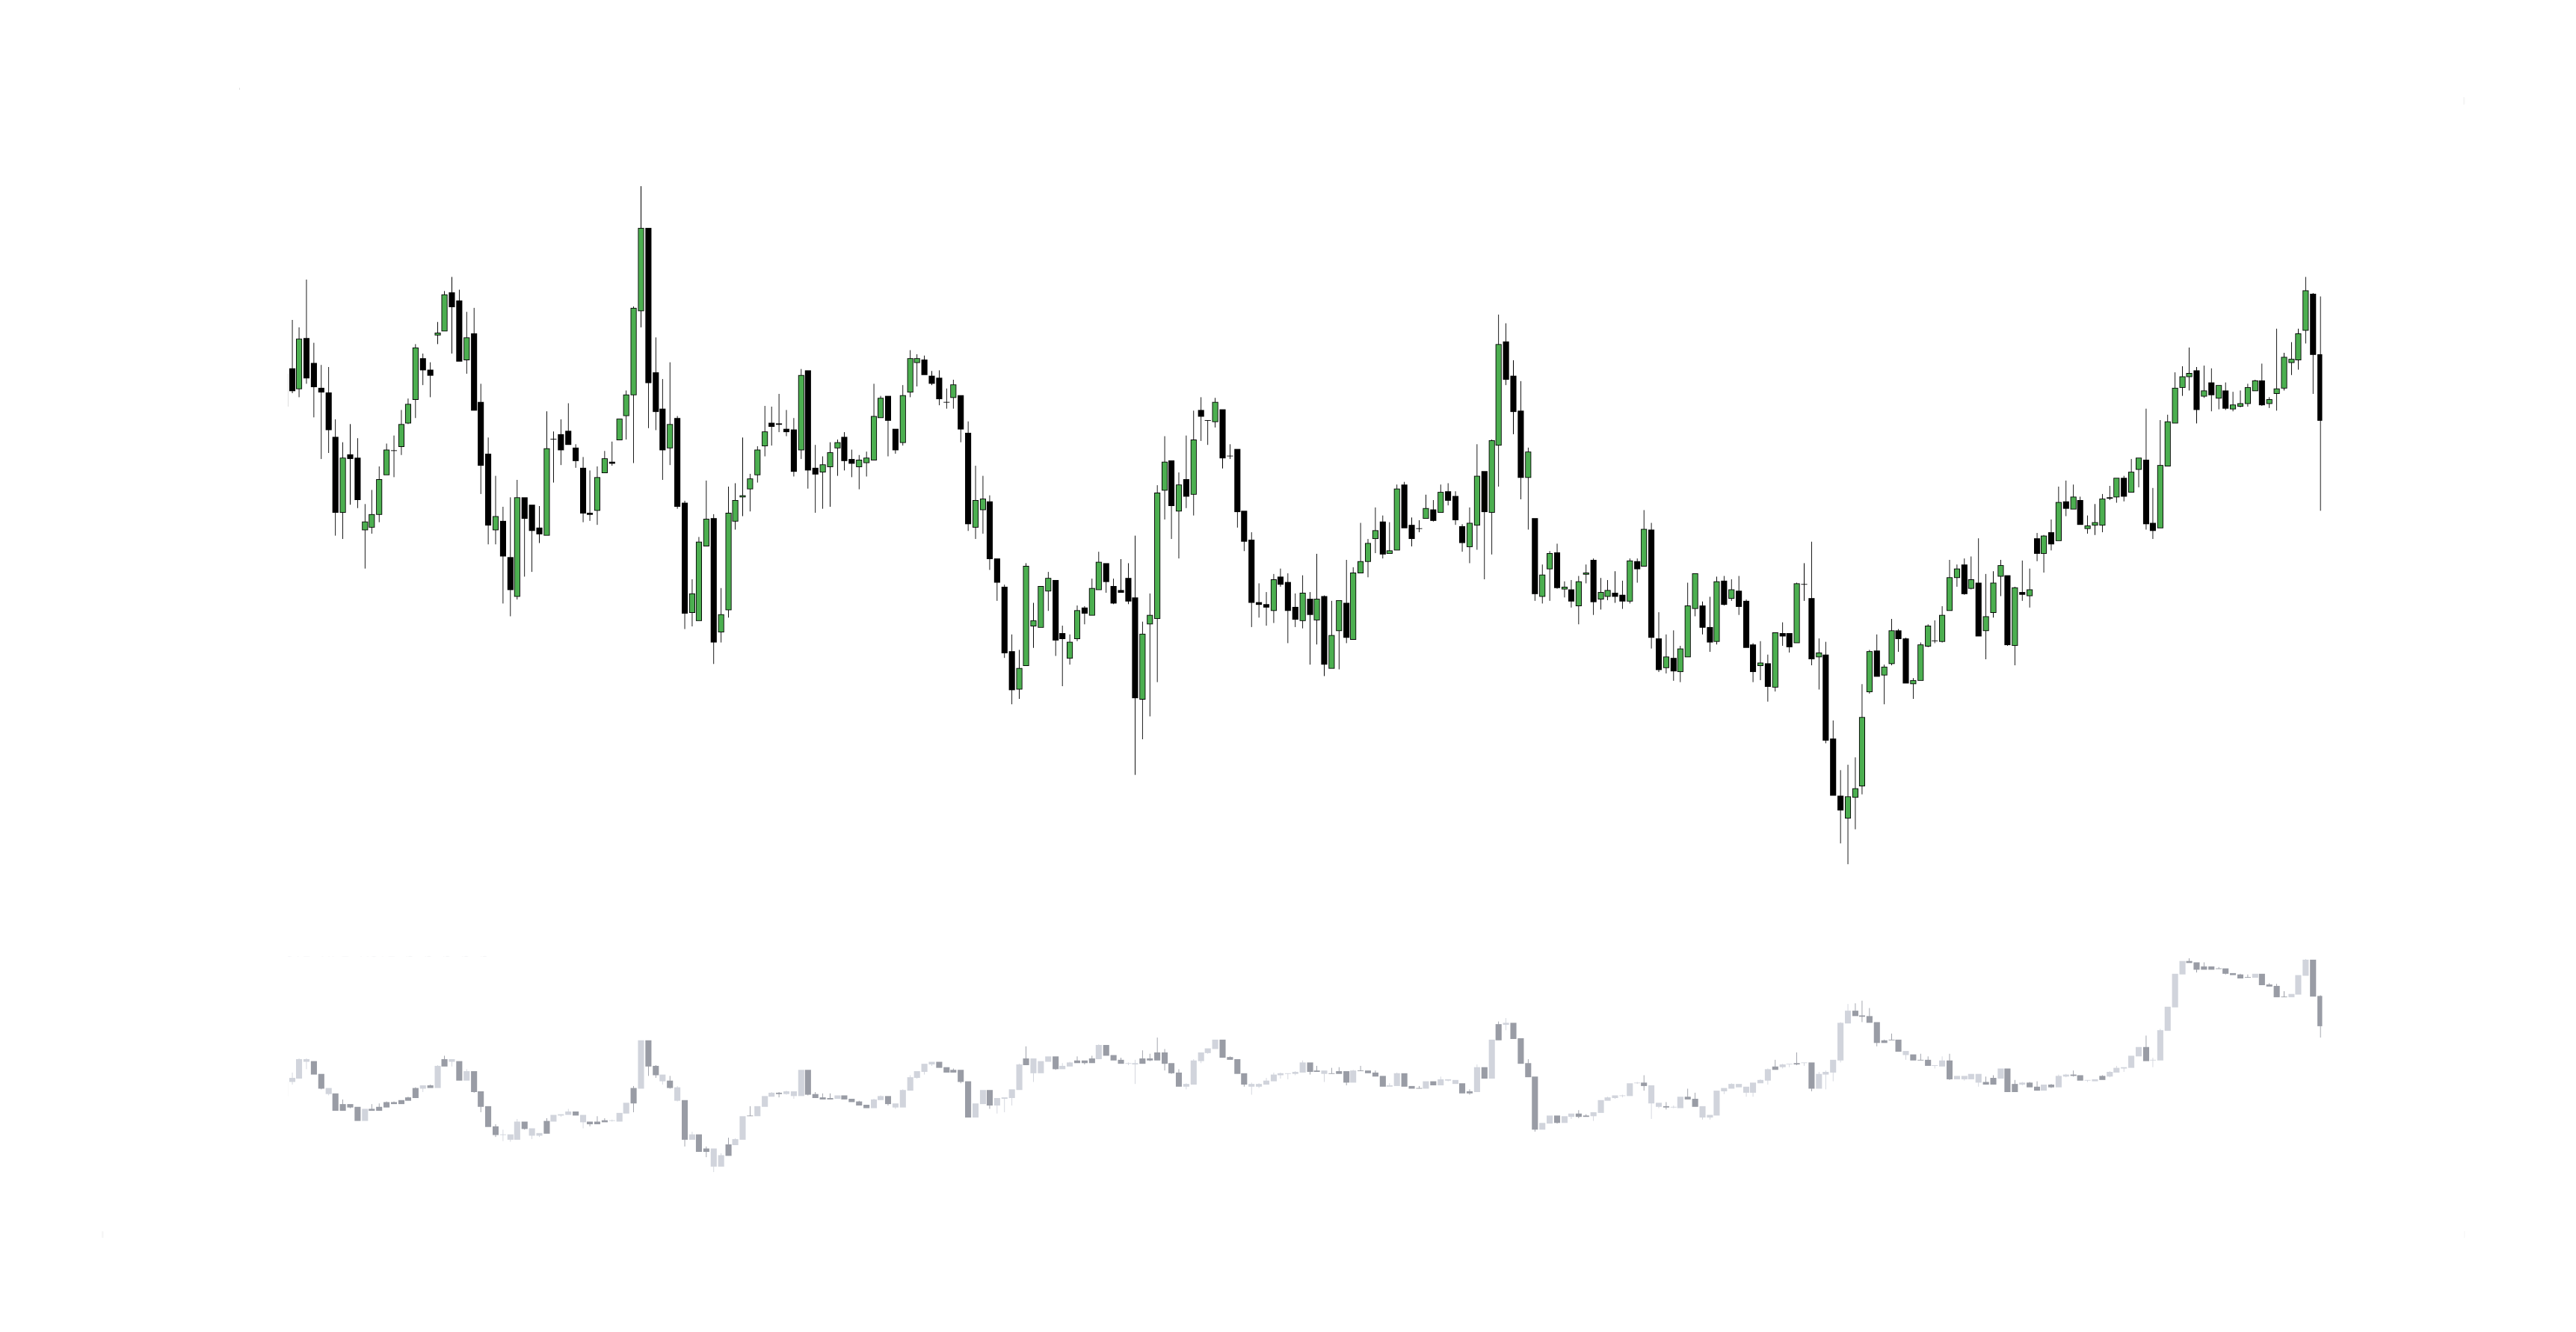
07. Open Interest 📊
Open Interest (OI) is a key metric in derivatives markets (futures and options) that represents the total number of outstanding contracts that have not been settled or closed. It is an important indicator of market activity, liquidity, and trader commitment.
Open Interest (OI) Commitment
How it works?
Open Interest increases or decreases based on the interaction between buyers and sellers:
- OI Increases: When a new buyer and a new seller enter the market, creating a fresh contract.
- OI Decreases: When an existing buyer and seller close their positions (either by offsetting trades or expiration).
- OI Unchanged: If an existing contract is transferred between traders (one trader closes, another opens an equal position).
Interpretation
- Rising OI + Rising Price: Suggests strong buying interest, indicating a bullish trend with conviction.
- Rising OI + Falling Price: Indicates strong selling pressure, confirming a bearish trend.
- Falling OI + Rising Price: Signals a short-covering rally or weakening trend, as traders close positions.
- Falling OI + Falling Price: Suggests a lack of commitment to further declines, indicating potential trend exhaustion.
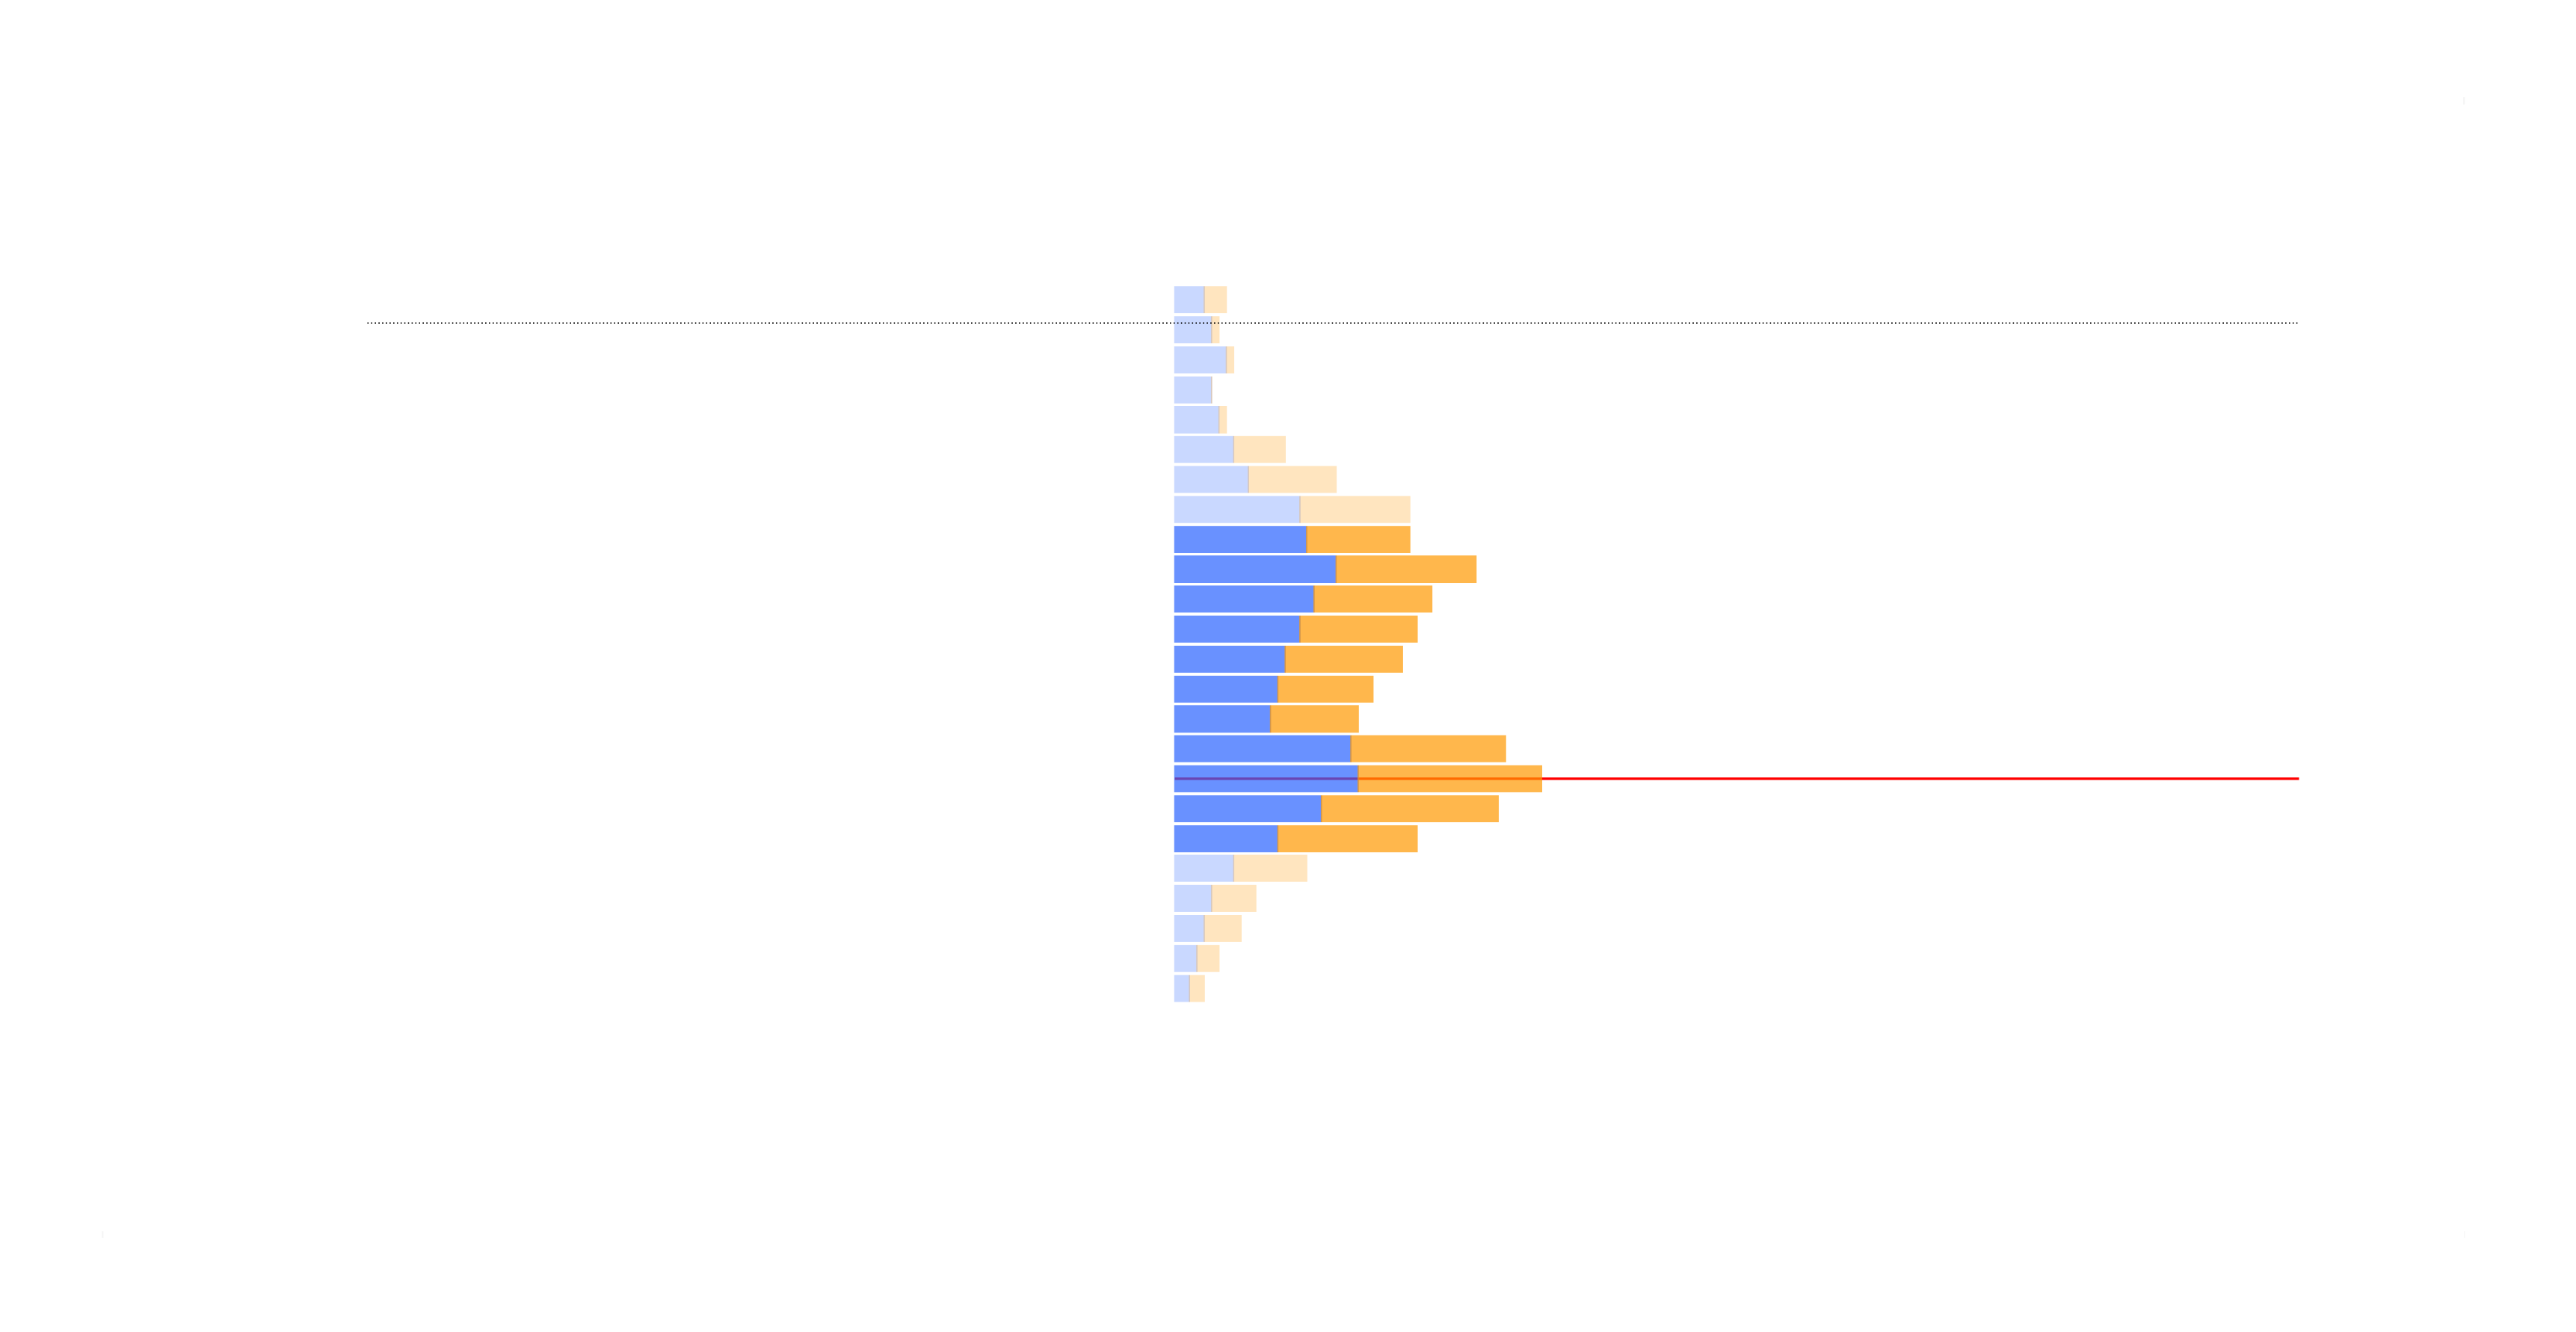
08. Volume Profile 🎢
Volume Profile is a powerful market analysis tool that plots trading volume at different price levels over a specific period. Unlike traditional volume indicators, which show volume per time interval, Volume Profile reveals where the most buying and selling activity occurred.
Volume Profile (VP) Distribution
Components
- Point of Control (POC): The price level where the highest volume was traded, acting as a major support/resistance zone.
- High Volume Nodes (HVN): Price areas with heavy trading activity, indicating consolidation zones where price is likely to stabilize.
- Low Volume Nodes (LVN): Price areas with little trading activity, often leading to fast price movements.
- Value Area (VA): The price range where 70% of the total volume was traded.
- Value Area High (VAH) & Value Area Low (VAL): The upper and lower boundaries of the Value Area.
Interpretation
- POC as a Magnet: Price tends to revisit the POC due to high liquidity and market agreement at that level.
- Breakouts from Value Area: If price breaks above VAH with strong volume, it signals a bullish trend; if it breaks below VAL, it signals a bearish trend.
- Reaction at LVN: Price moves quickly through LVN areas but may reverse or stall when approaching HVN.
Key Takeaways 📋
- Volume is a crucial market indicator that reflects trading activity and liquidity, often preceding price movements.
- High volume confirms trends and breakouts, while low volume can signal weak or false moves.
- Volume Profile identifies key support and resistance zones, with High Volume Nodes (HVNs) acting as strong barriers.
- Relative Volume (RVOL) highlights unusual market activity, while Delta Volume and Cumulative Delta reveal buying and selling pressure.
- VWAP serves as a dynamic support/resistance tool commonly used by institutional traders.