
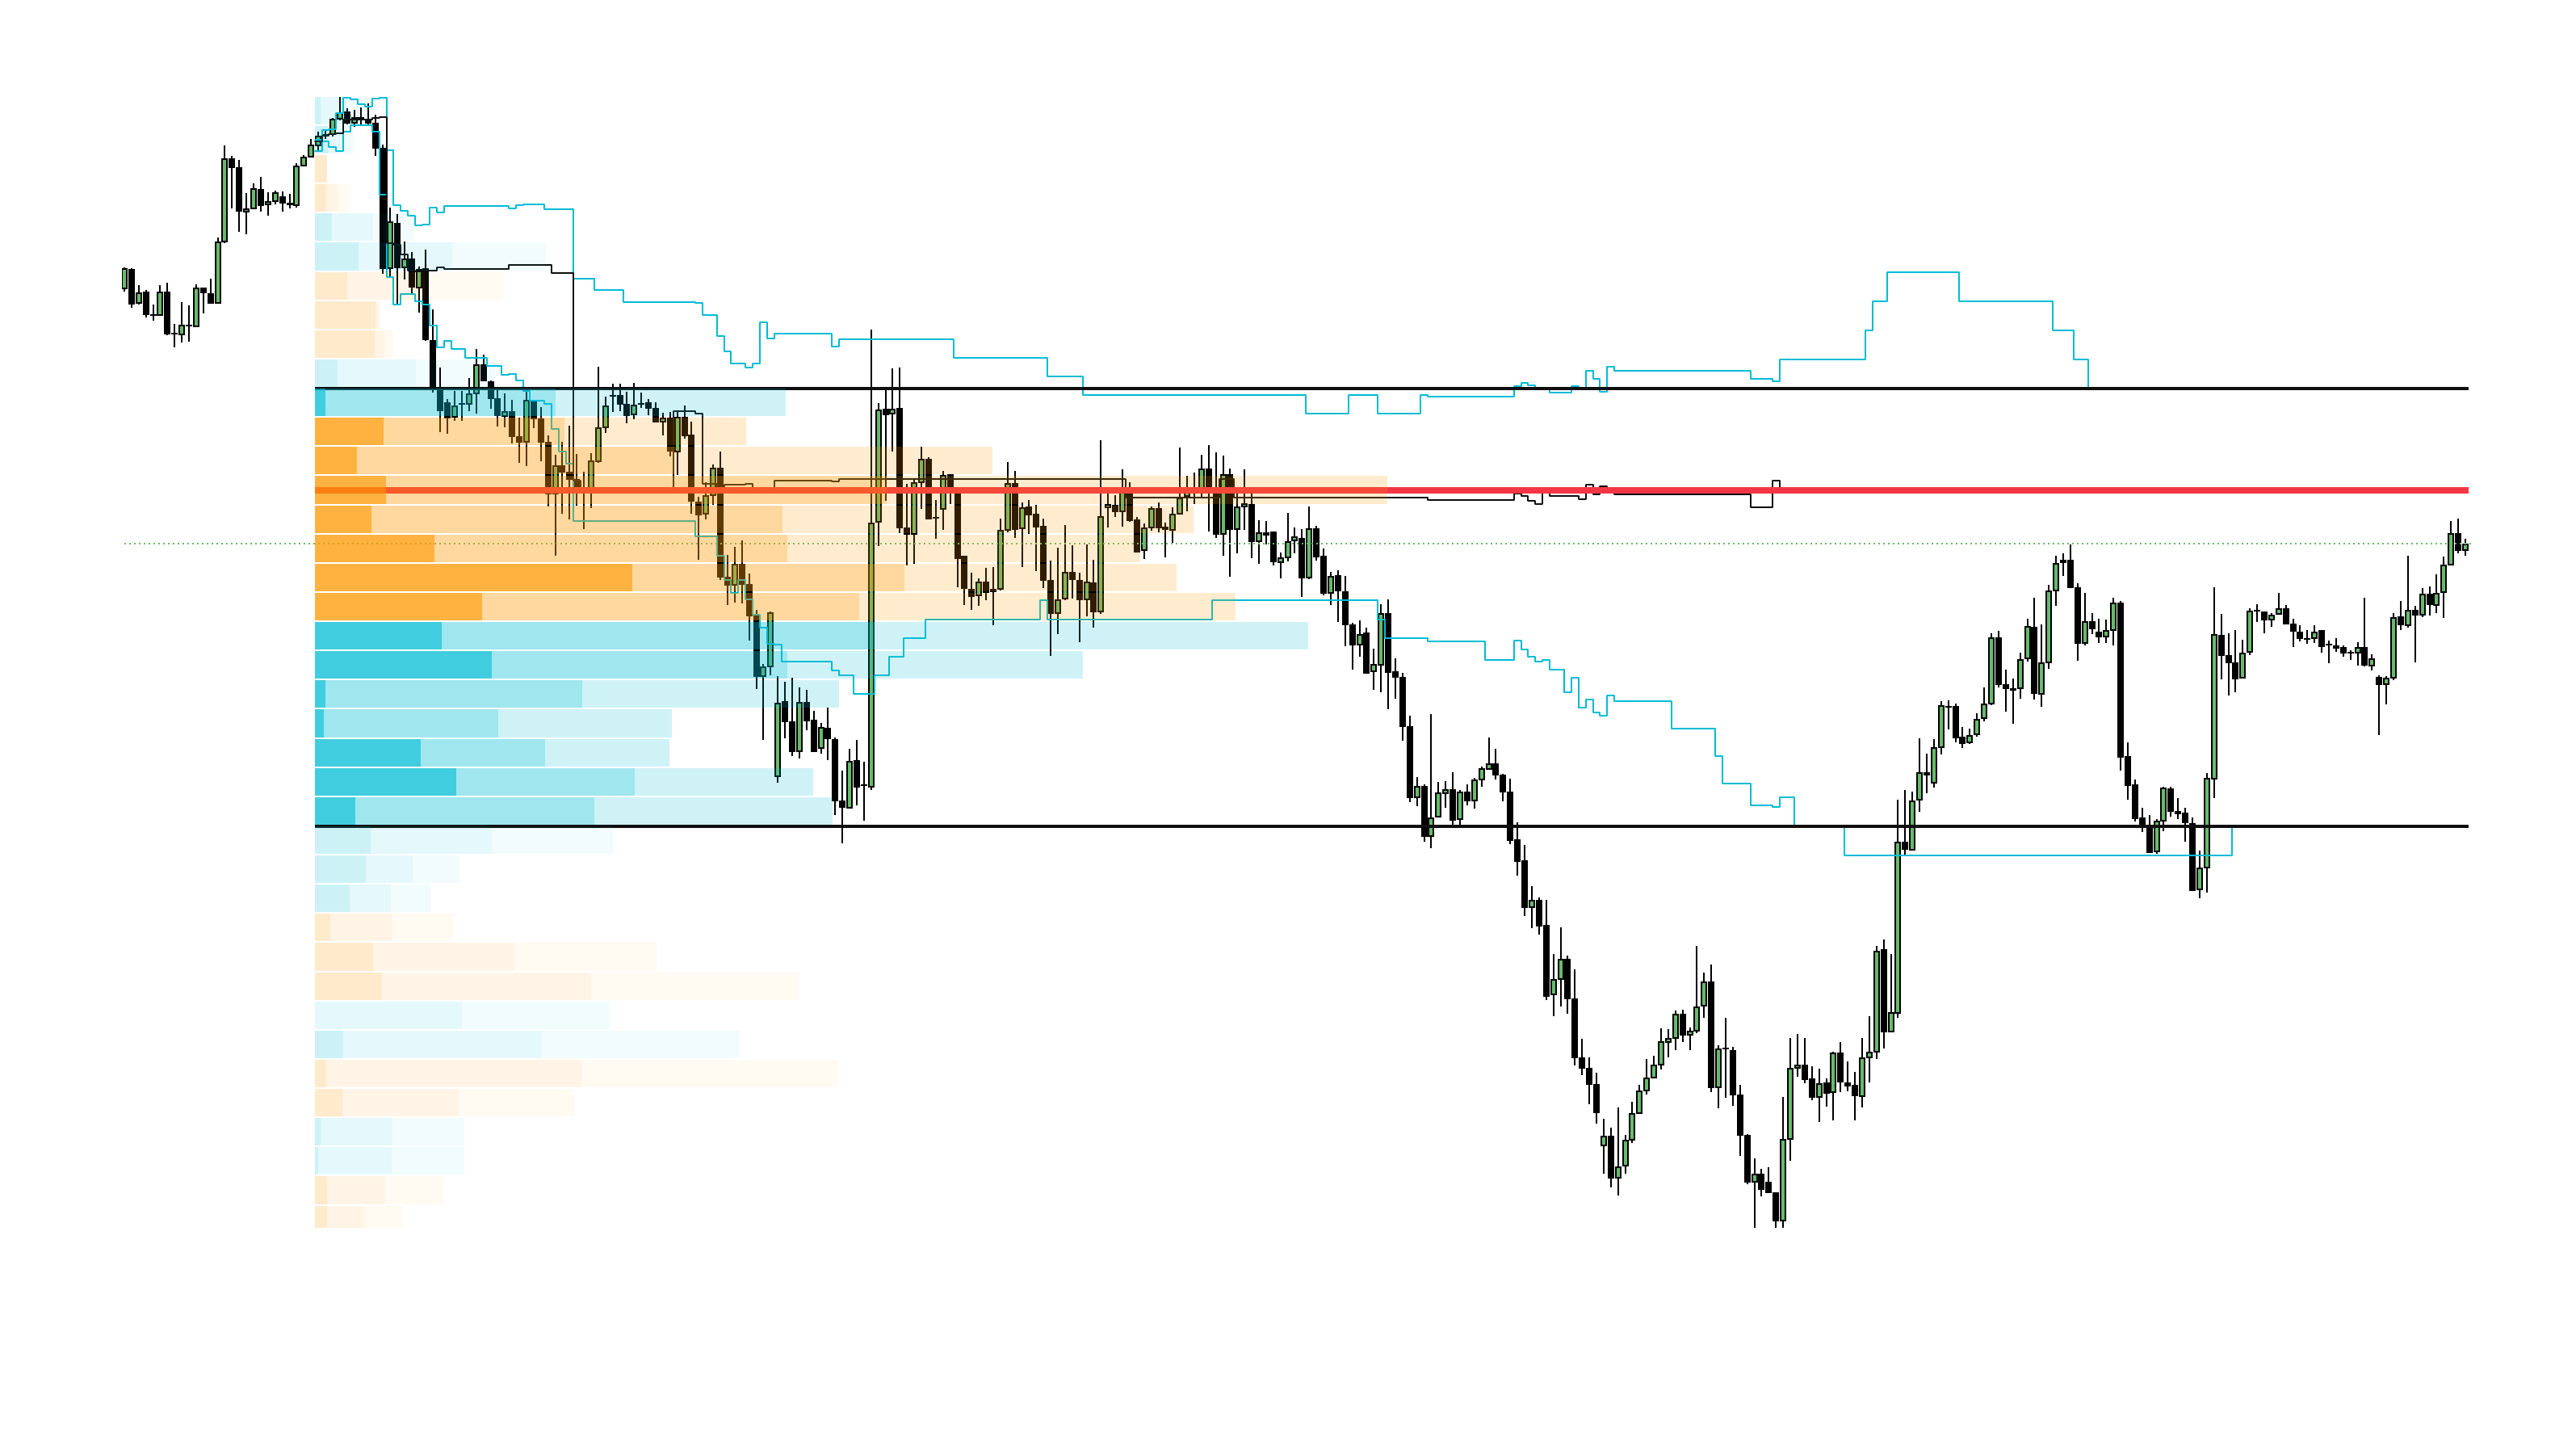
Volume Profile is one of the most effective and institutional-grade analytical tools available to modern traders. While traditional volume indicators plot market activity over time, Volume Profile displays trading activity over price. This fundamental shift in perspective enables traders to pinpoint where institutional market participants accepted fair value and where price was aggressively rejected.
Volume Profile Overview
1. The Evolution of Volume Analysis
Standard volume histograms plot vertical bars at the bottom of the chart, showing when volume occurred but failing to reveal the exact price levels where transactions took place.
- Time-Based Volume (Vertical): Measures trading effort across time intervals.
- Price-Based Volume (Horizontal): Measures institutional commitment across specific price nodes.
By analyzing horizontal volume distribution, traders can map out the exact price levels where large institutions accumulated or distributed major positions.
2. Core Mechanics: How Volume Profile Is Built
Volume Profile aggregates total trading volume across a chosen timeframe and plots it as a horizontal histogram along the price axis.
- Tick-Level Data: Professional profile algorithms utilize tick-level execution data to assign every single contract or share to its precise transaction price.
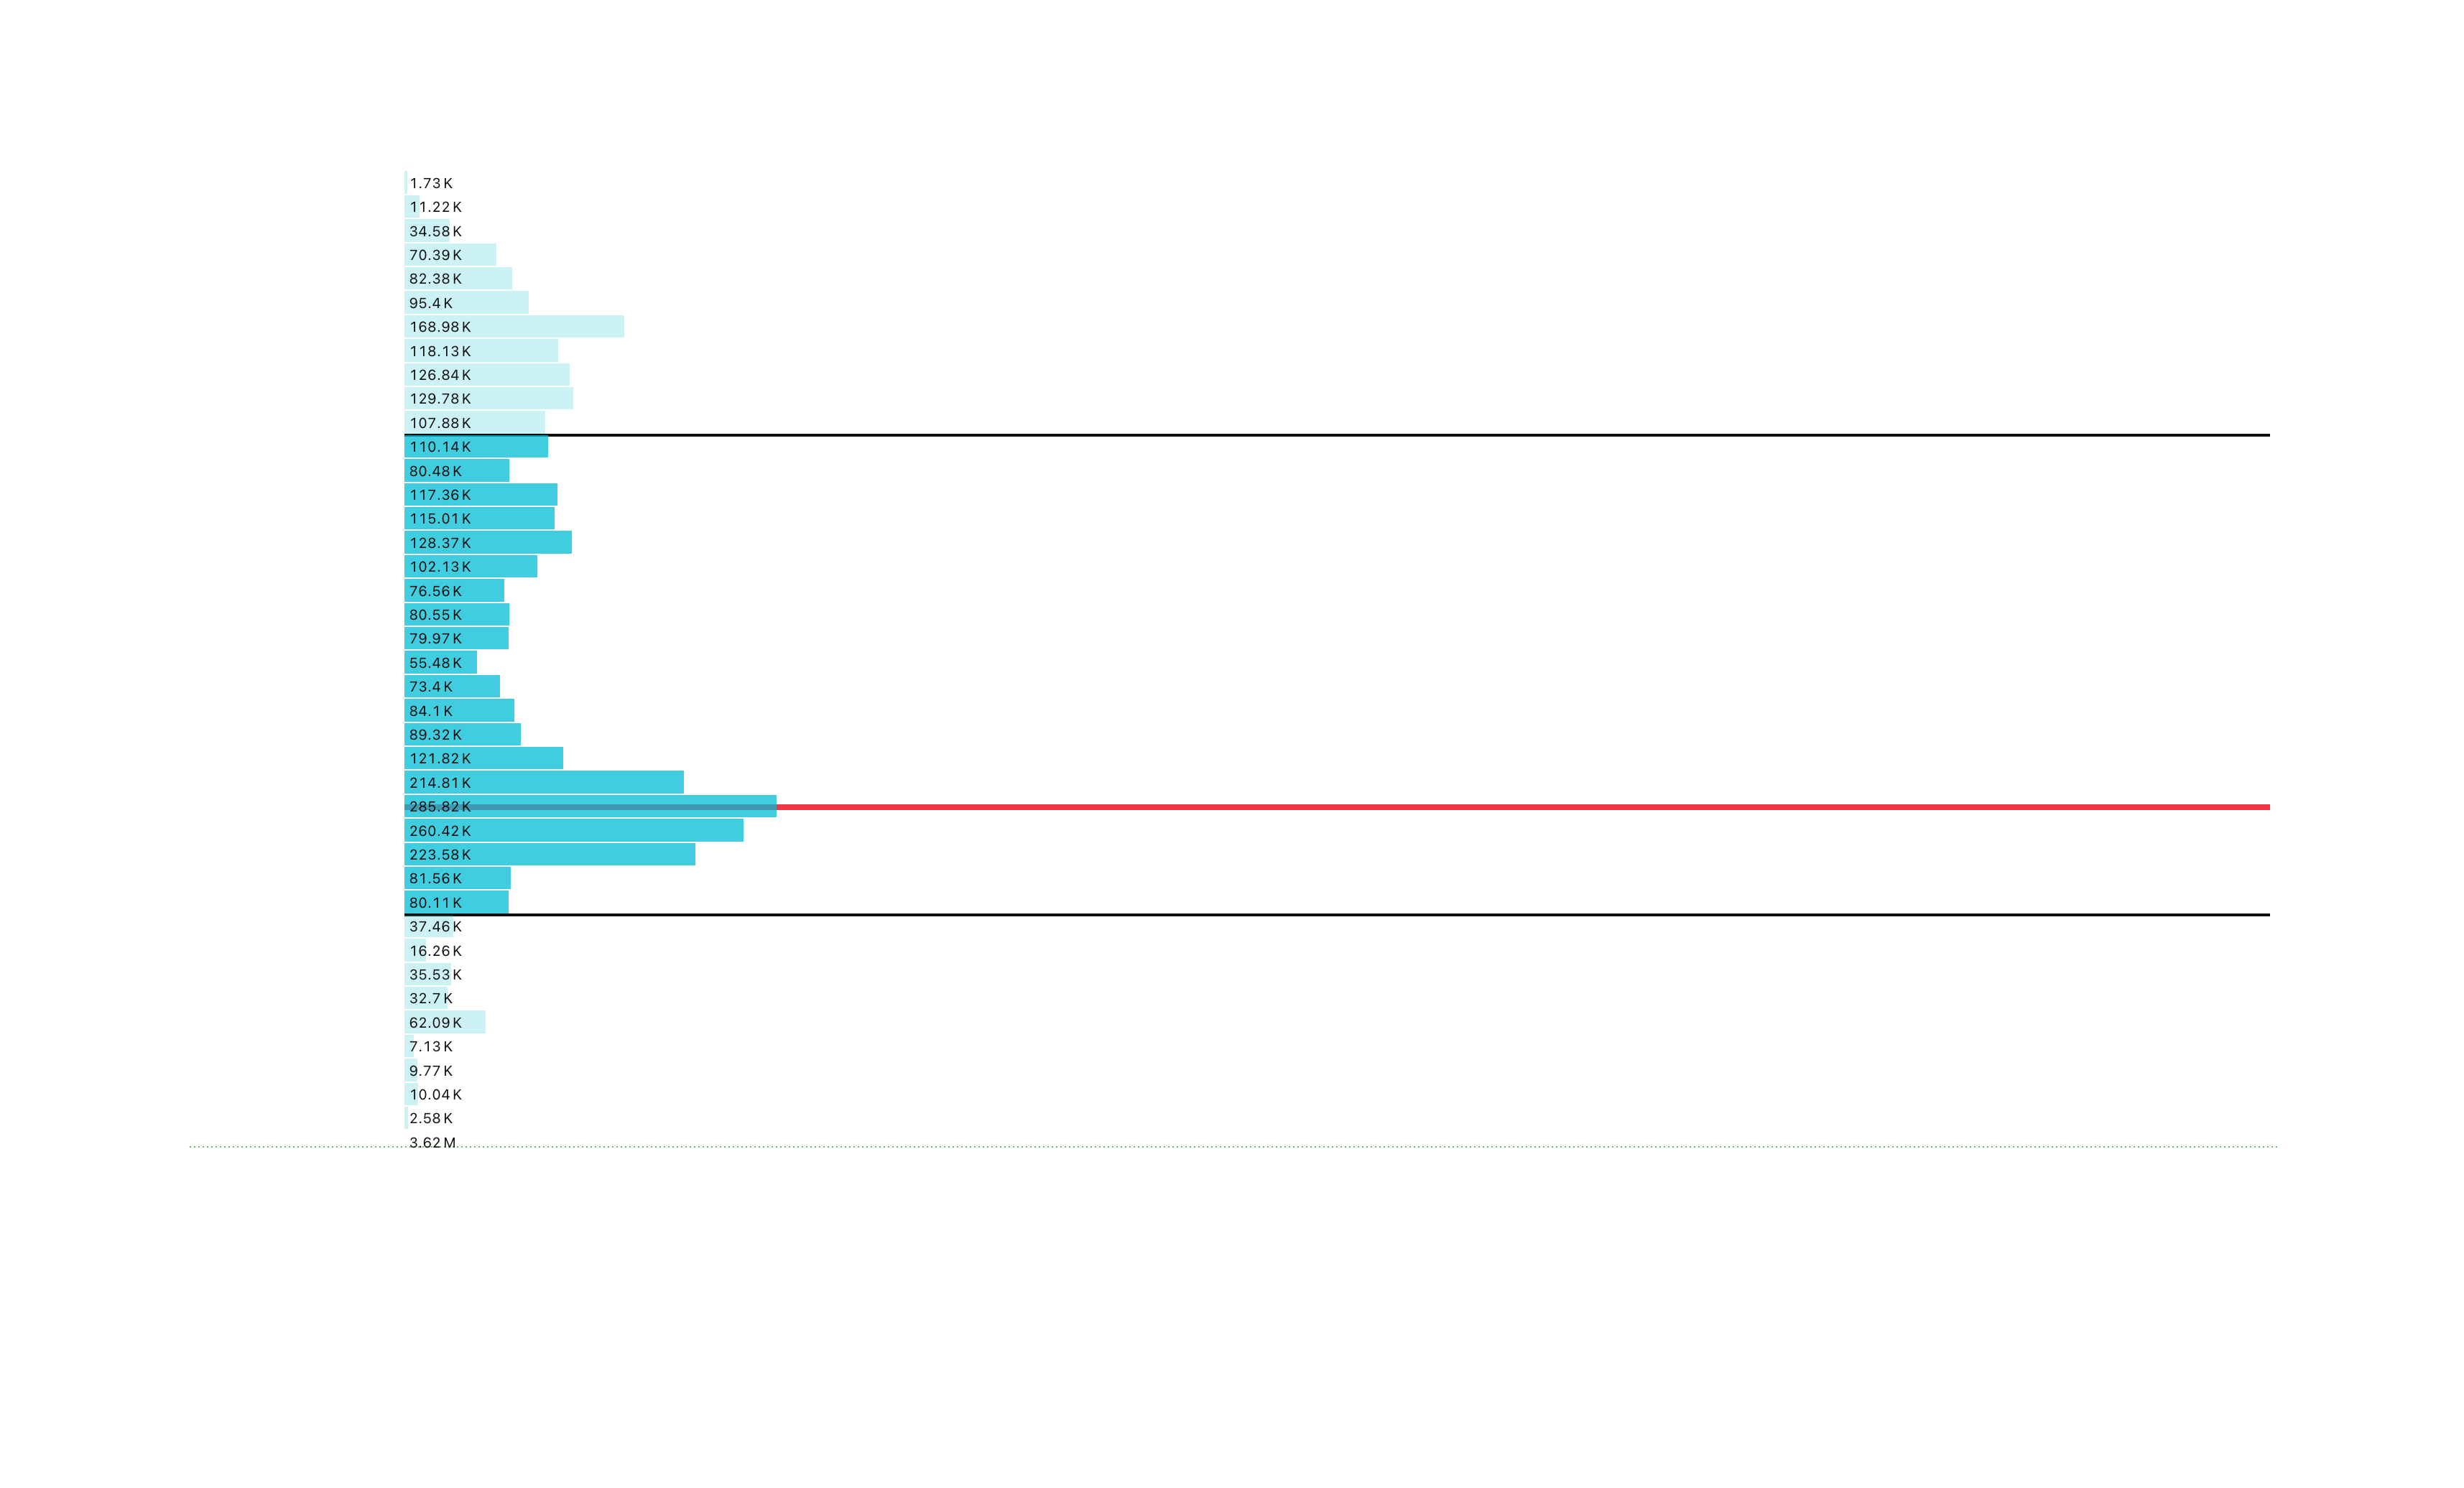
- Point of Control (POC): The price level with the single highest accumulated volume, representing true market equilibrium or "fair value."
- Value Area (VA): The price range accounting for 70% (one standard deviation) of total traded volume within the session or range.
3. Primary Components Deep Dive
Point of Control (POC)
The POC acts as a strong market magnet. Because it represents high historical liquidity, price frequently reverts to the POC during rotations.
Point of Control (POC)
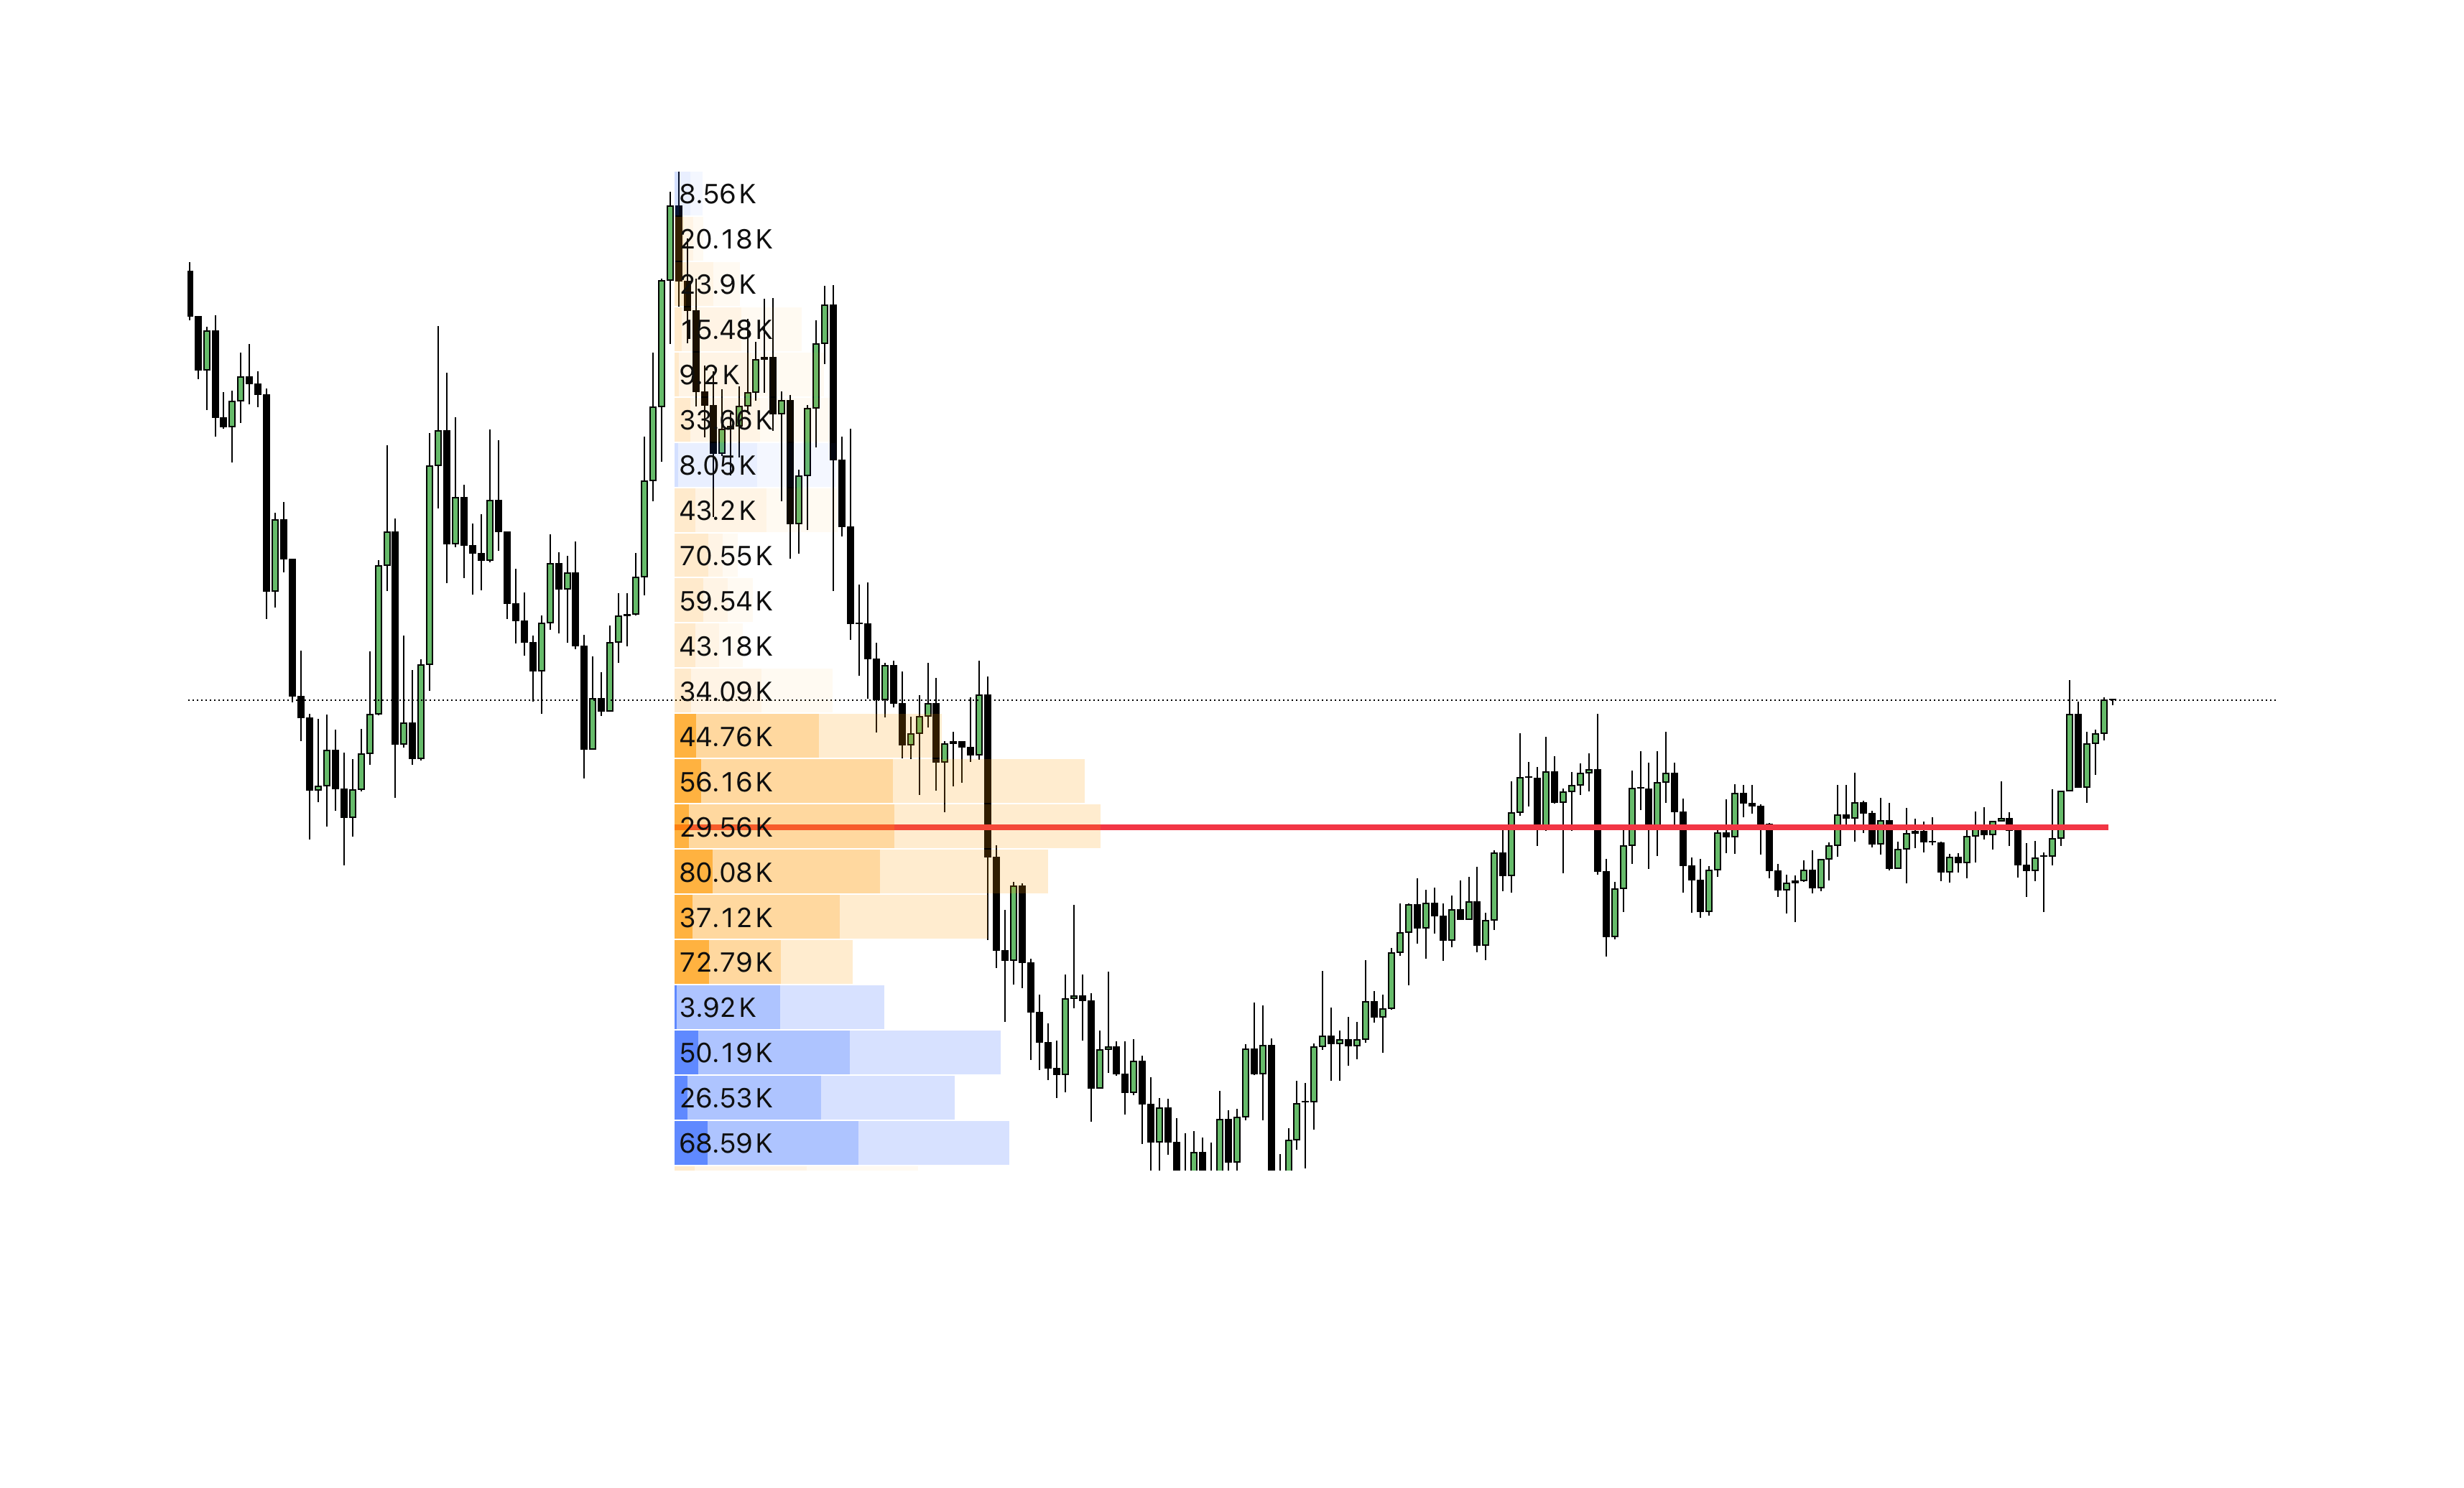
- Naked POC (nPOC): A Point of Control from a prior trading session that remains unvisited by price. Unvisited nPOCs serve as high-probability magnet targets.
Value Area High (VAH) & Value Area Low (VAL)
VAH and VAL define the boundaries of accepted fair value.
Value Area High & Low
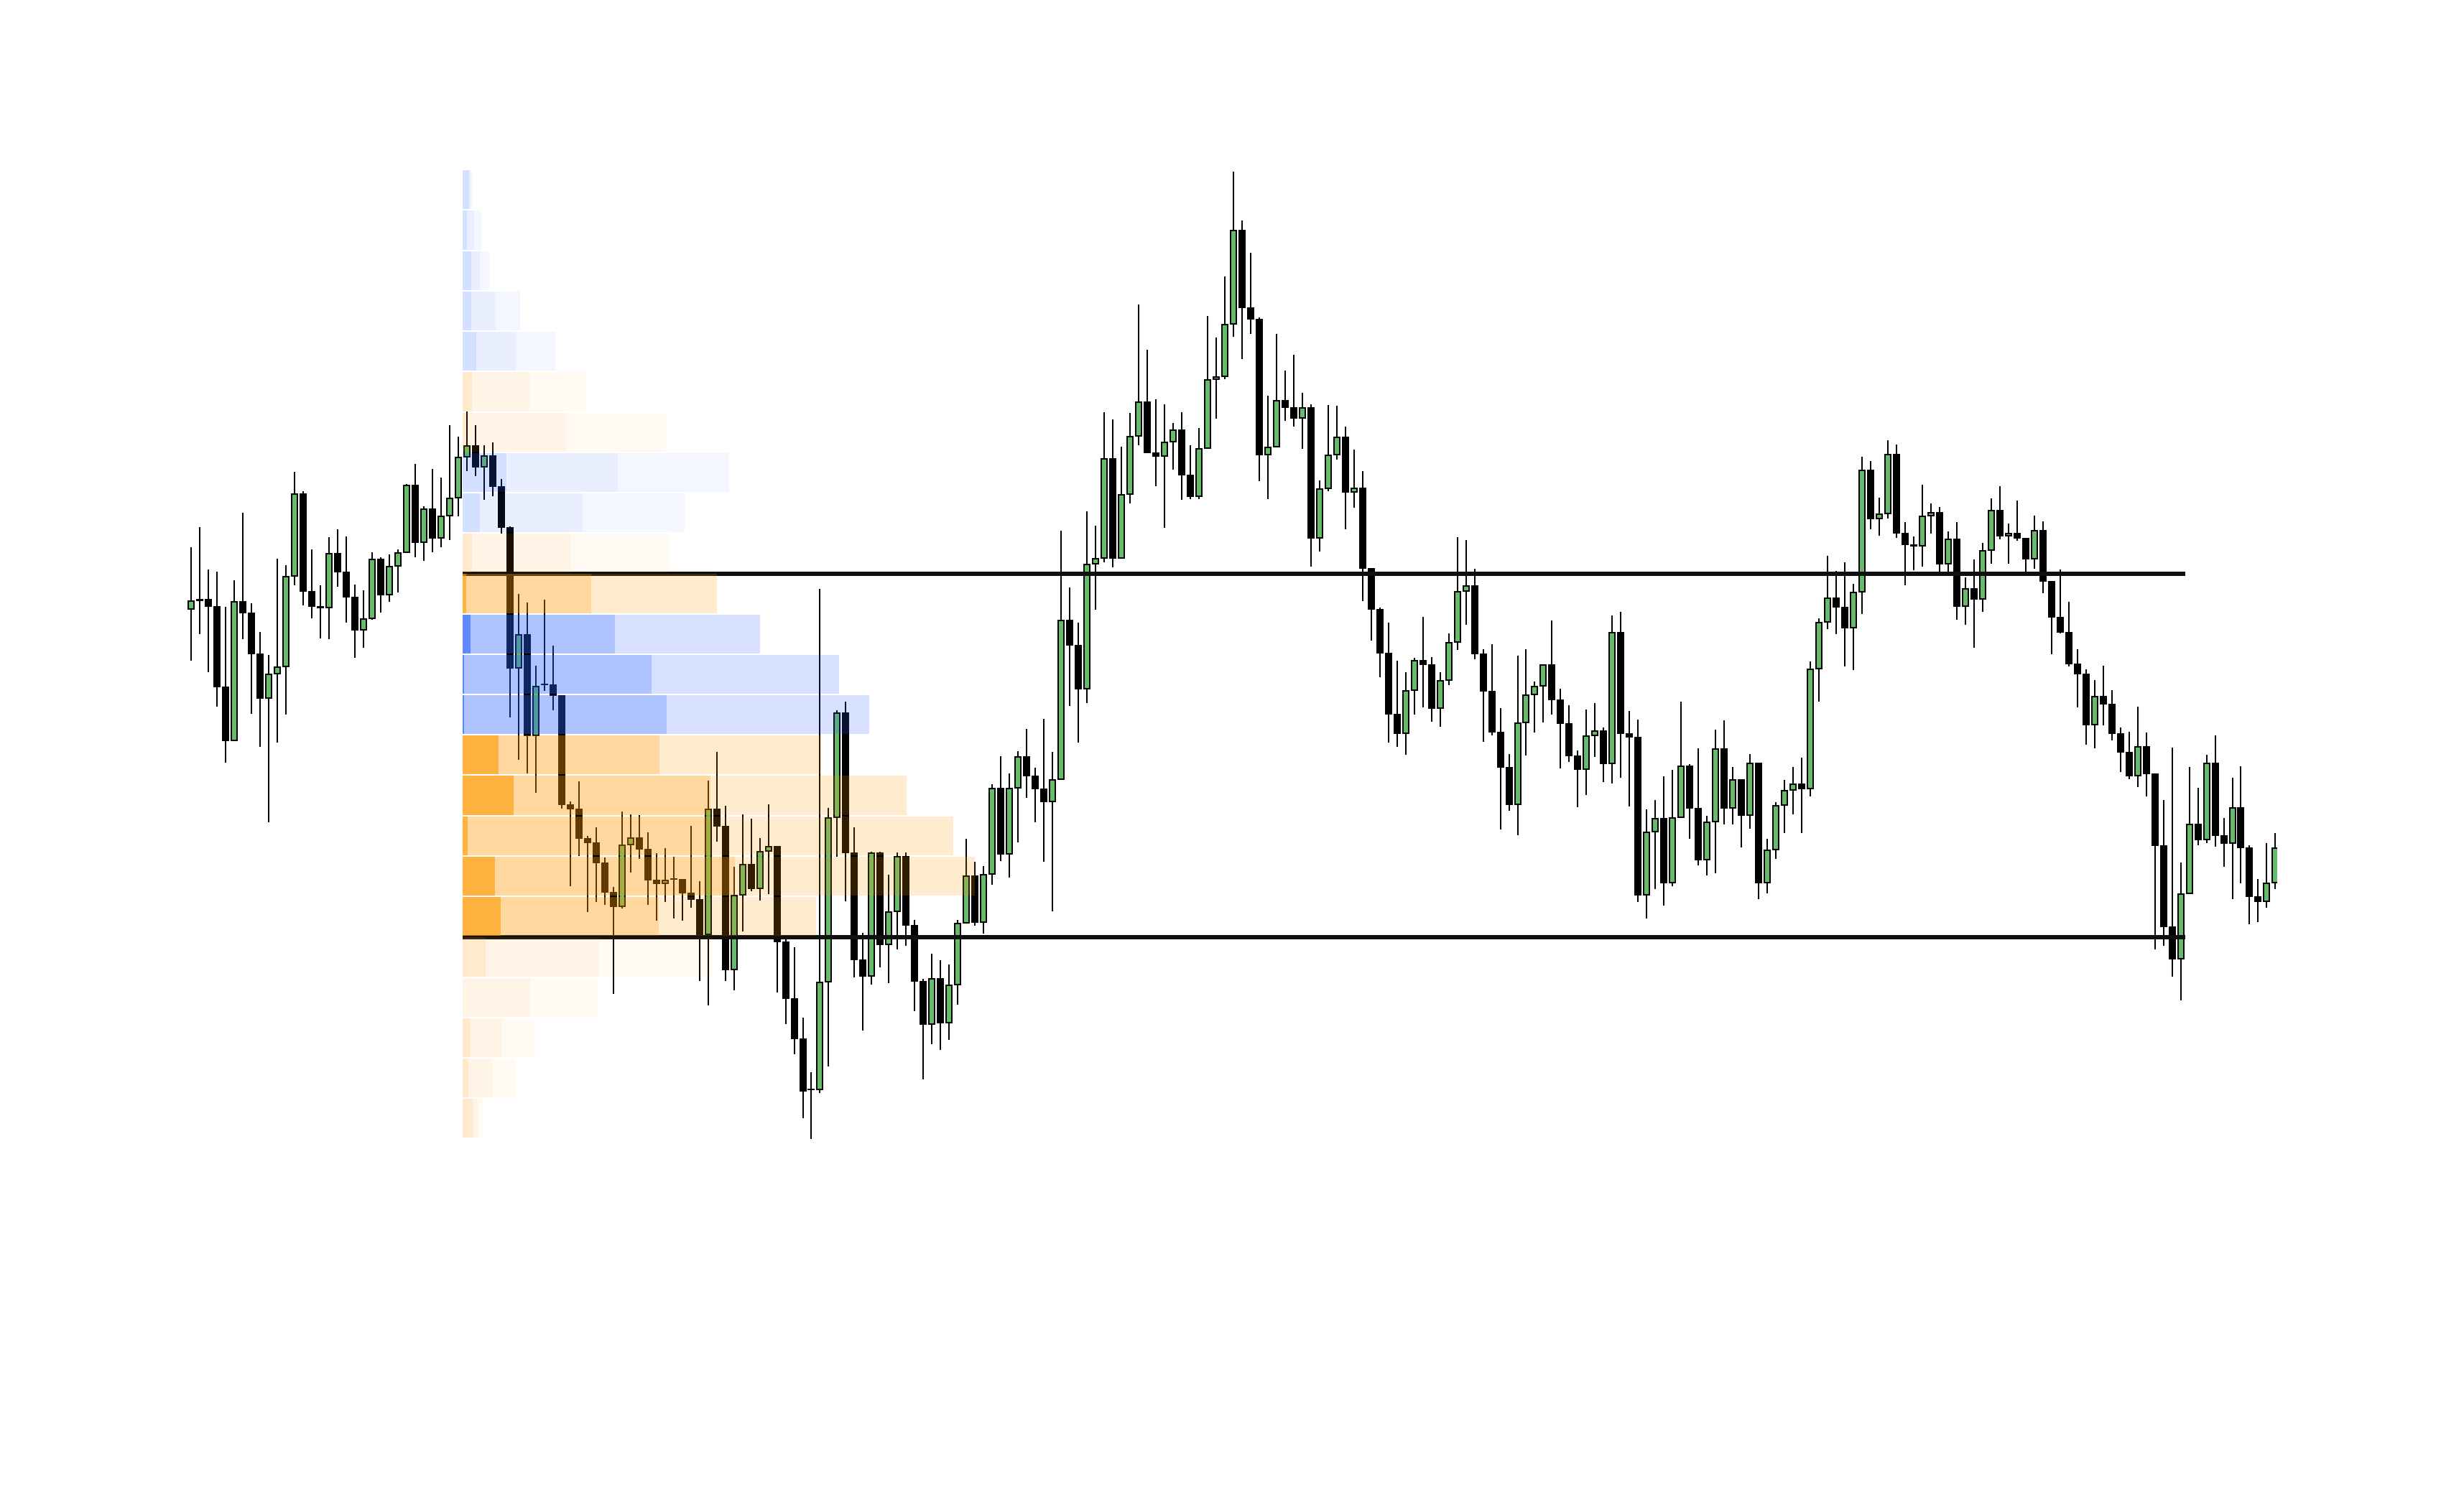
- When price trades inside the Value Area, the market is in a state of balance (consolidation).
- When price breaks outside the Value Area, the market is seeking imbalance (initiating a trend).
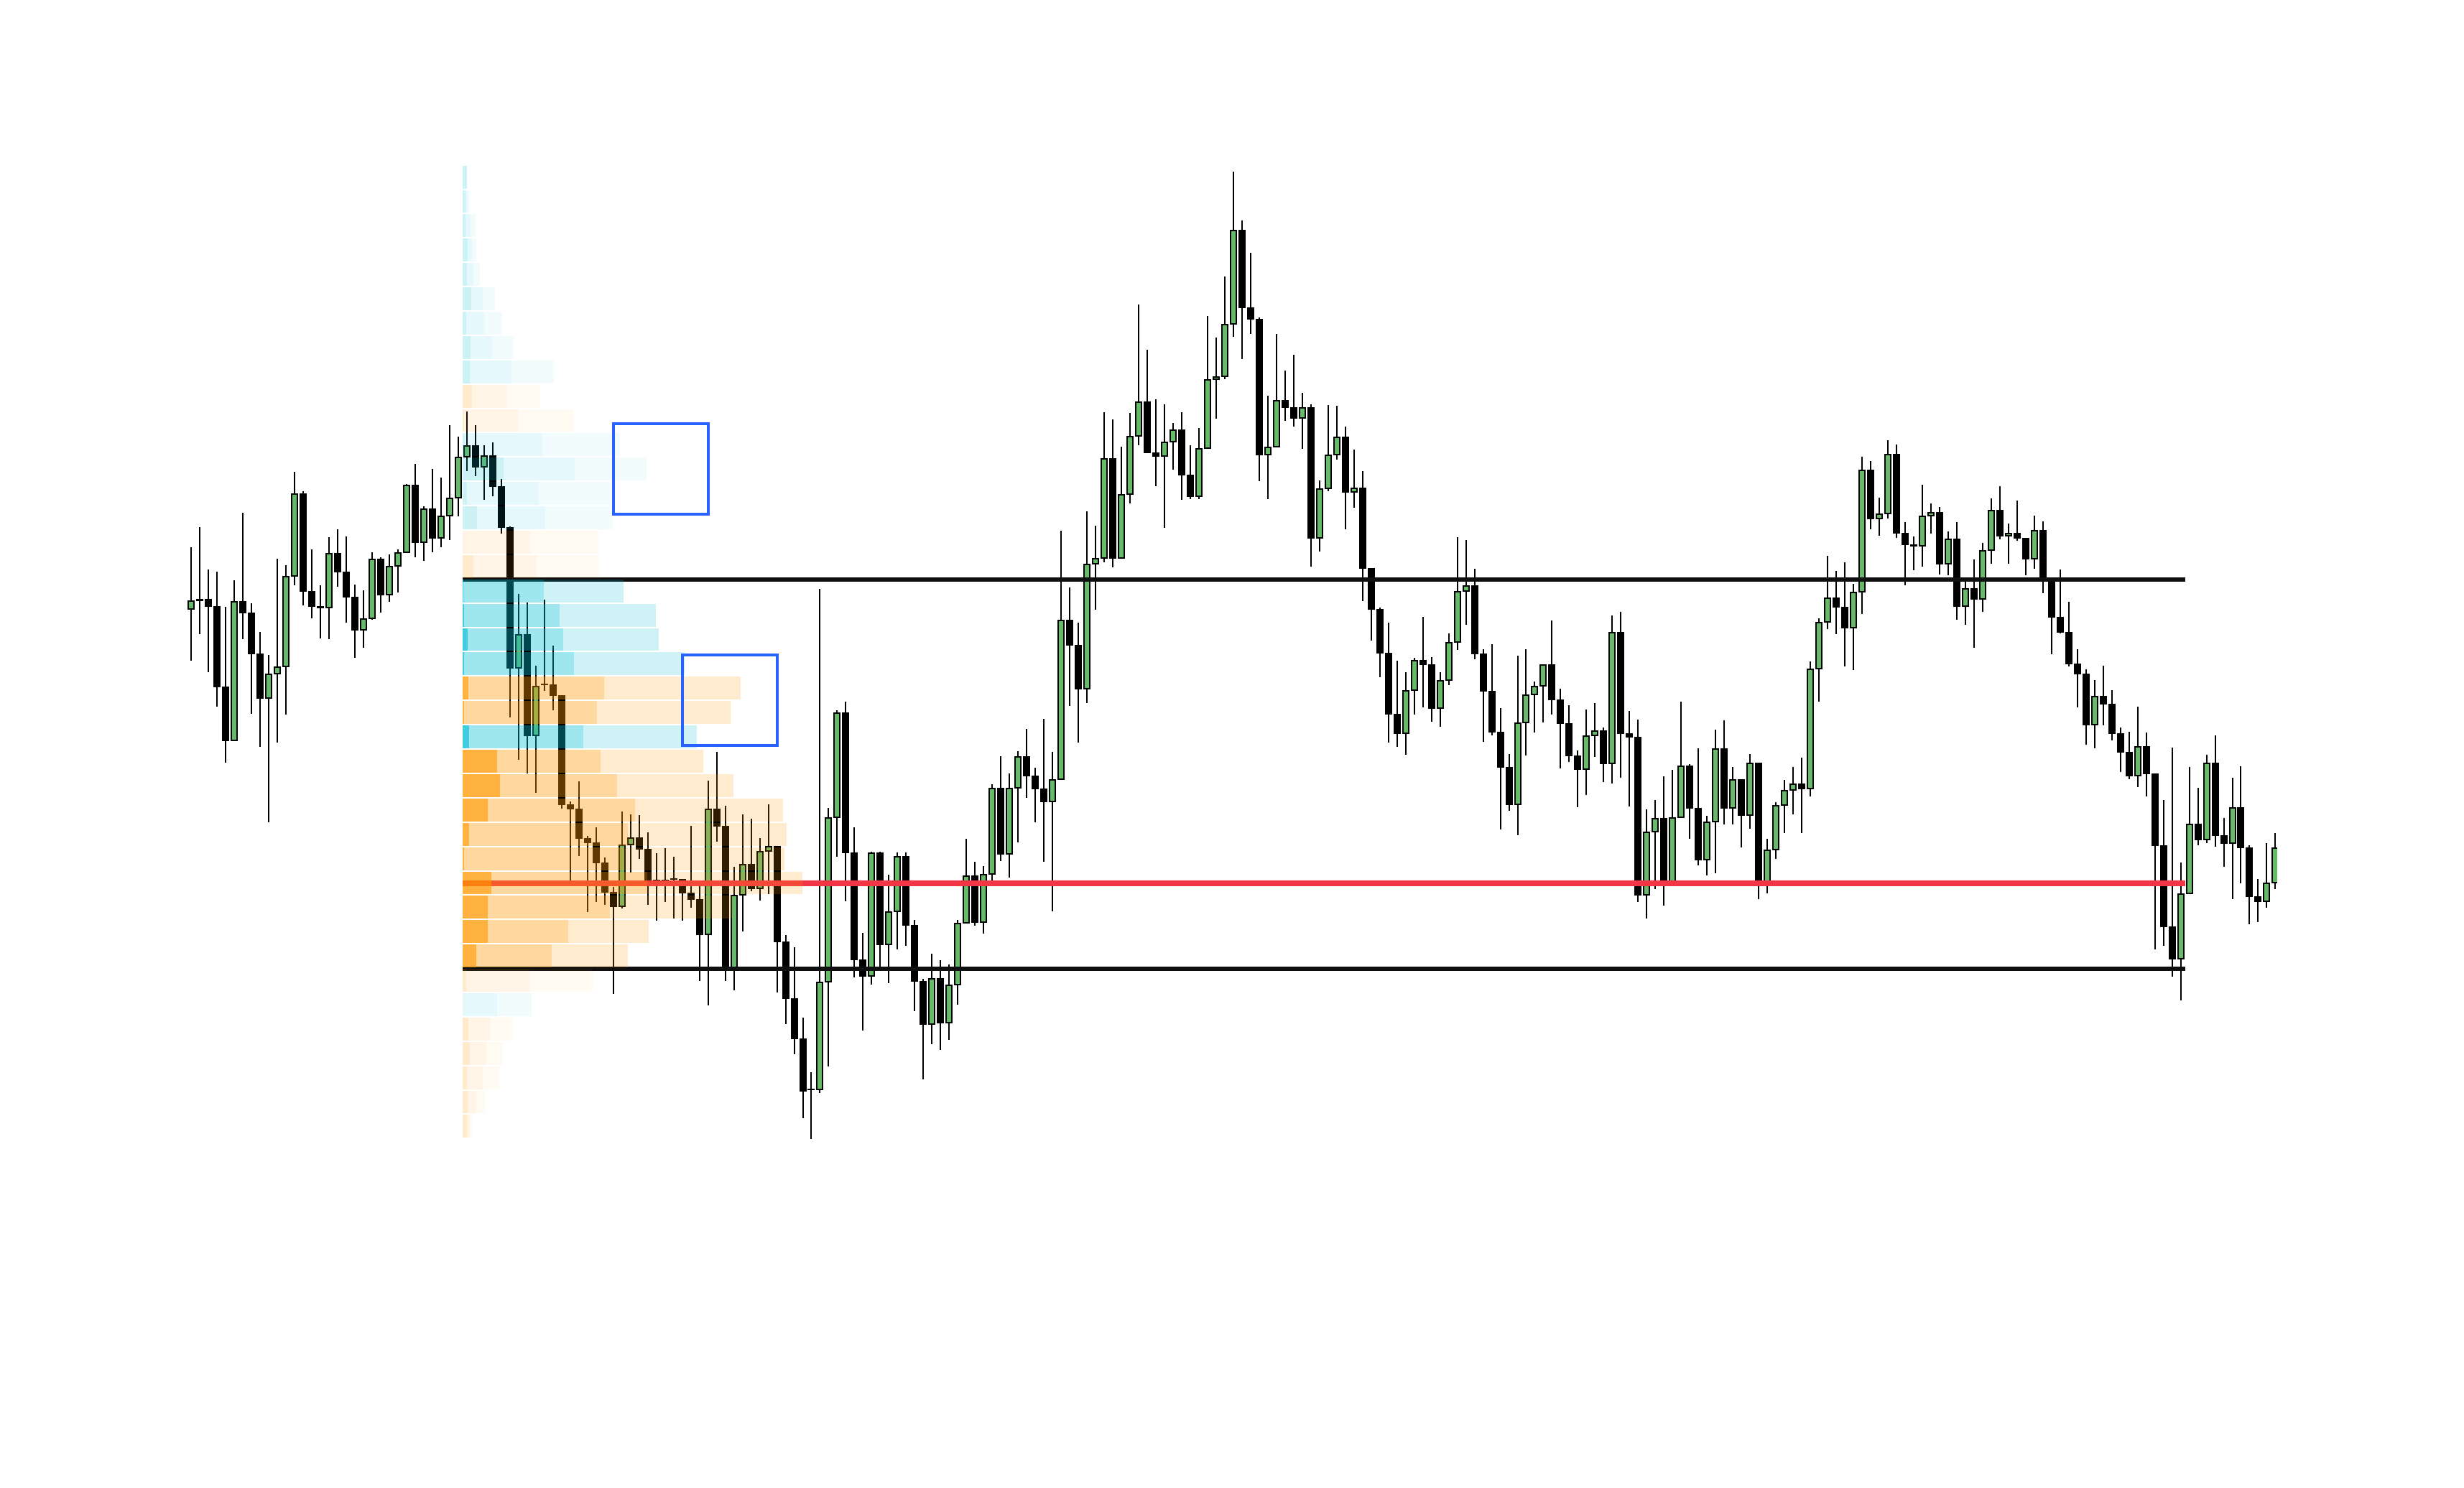
High Volume Nodes (HVN)
High Volume Nodes represent peaks in the volume distribution. They mark areas of heavy transaction history where price tends to consolidate, stall, or acceptance occurs.
High Volume Node (HVN)
Low Volume Nodes (LVN)
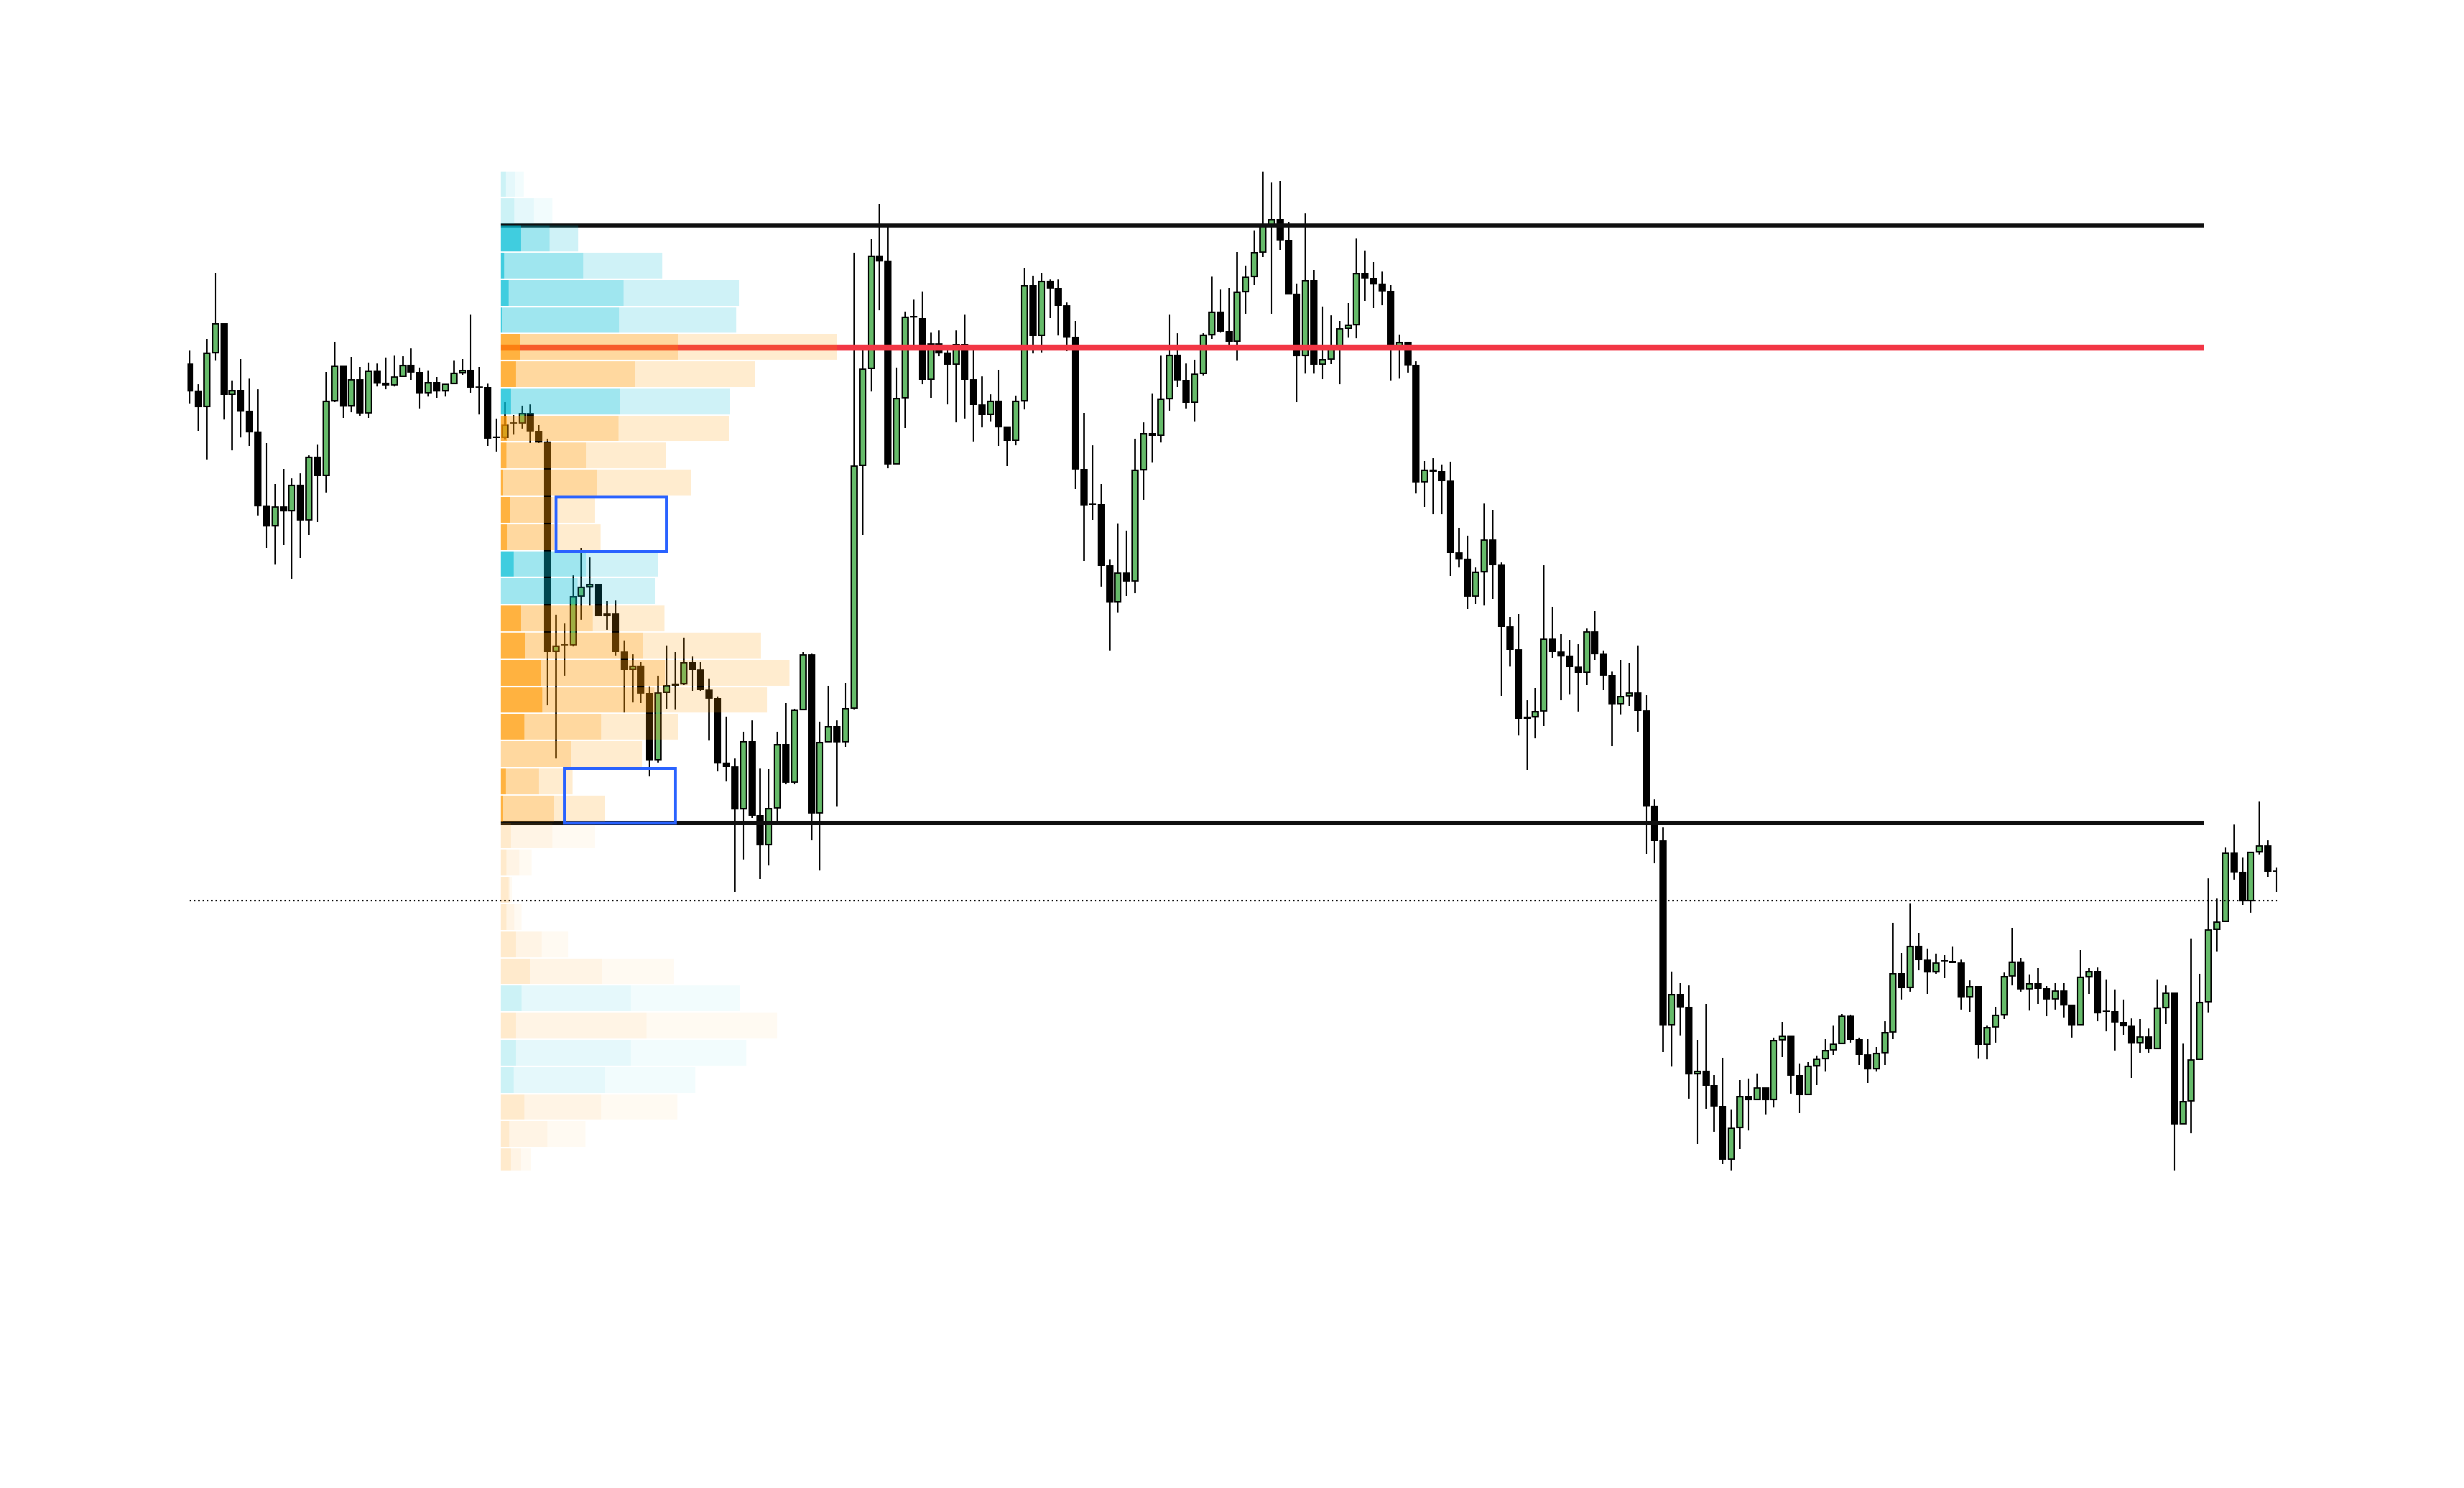
Low Volume Nodes represent valleys in the volume profile, indicating price rejection or rapid transit zones. Because minimal business occurred at these price levels, price typically moves through LVNs very rapidly.
Low Volume Node (LVN)
4. Volume Profile Shapes Catalog
The structural profile shape offers immediate context regarding market sentiment and auction dynamics.
D-Shape (Balanced Profile)
D-Shape Profile
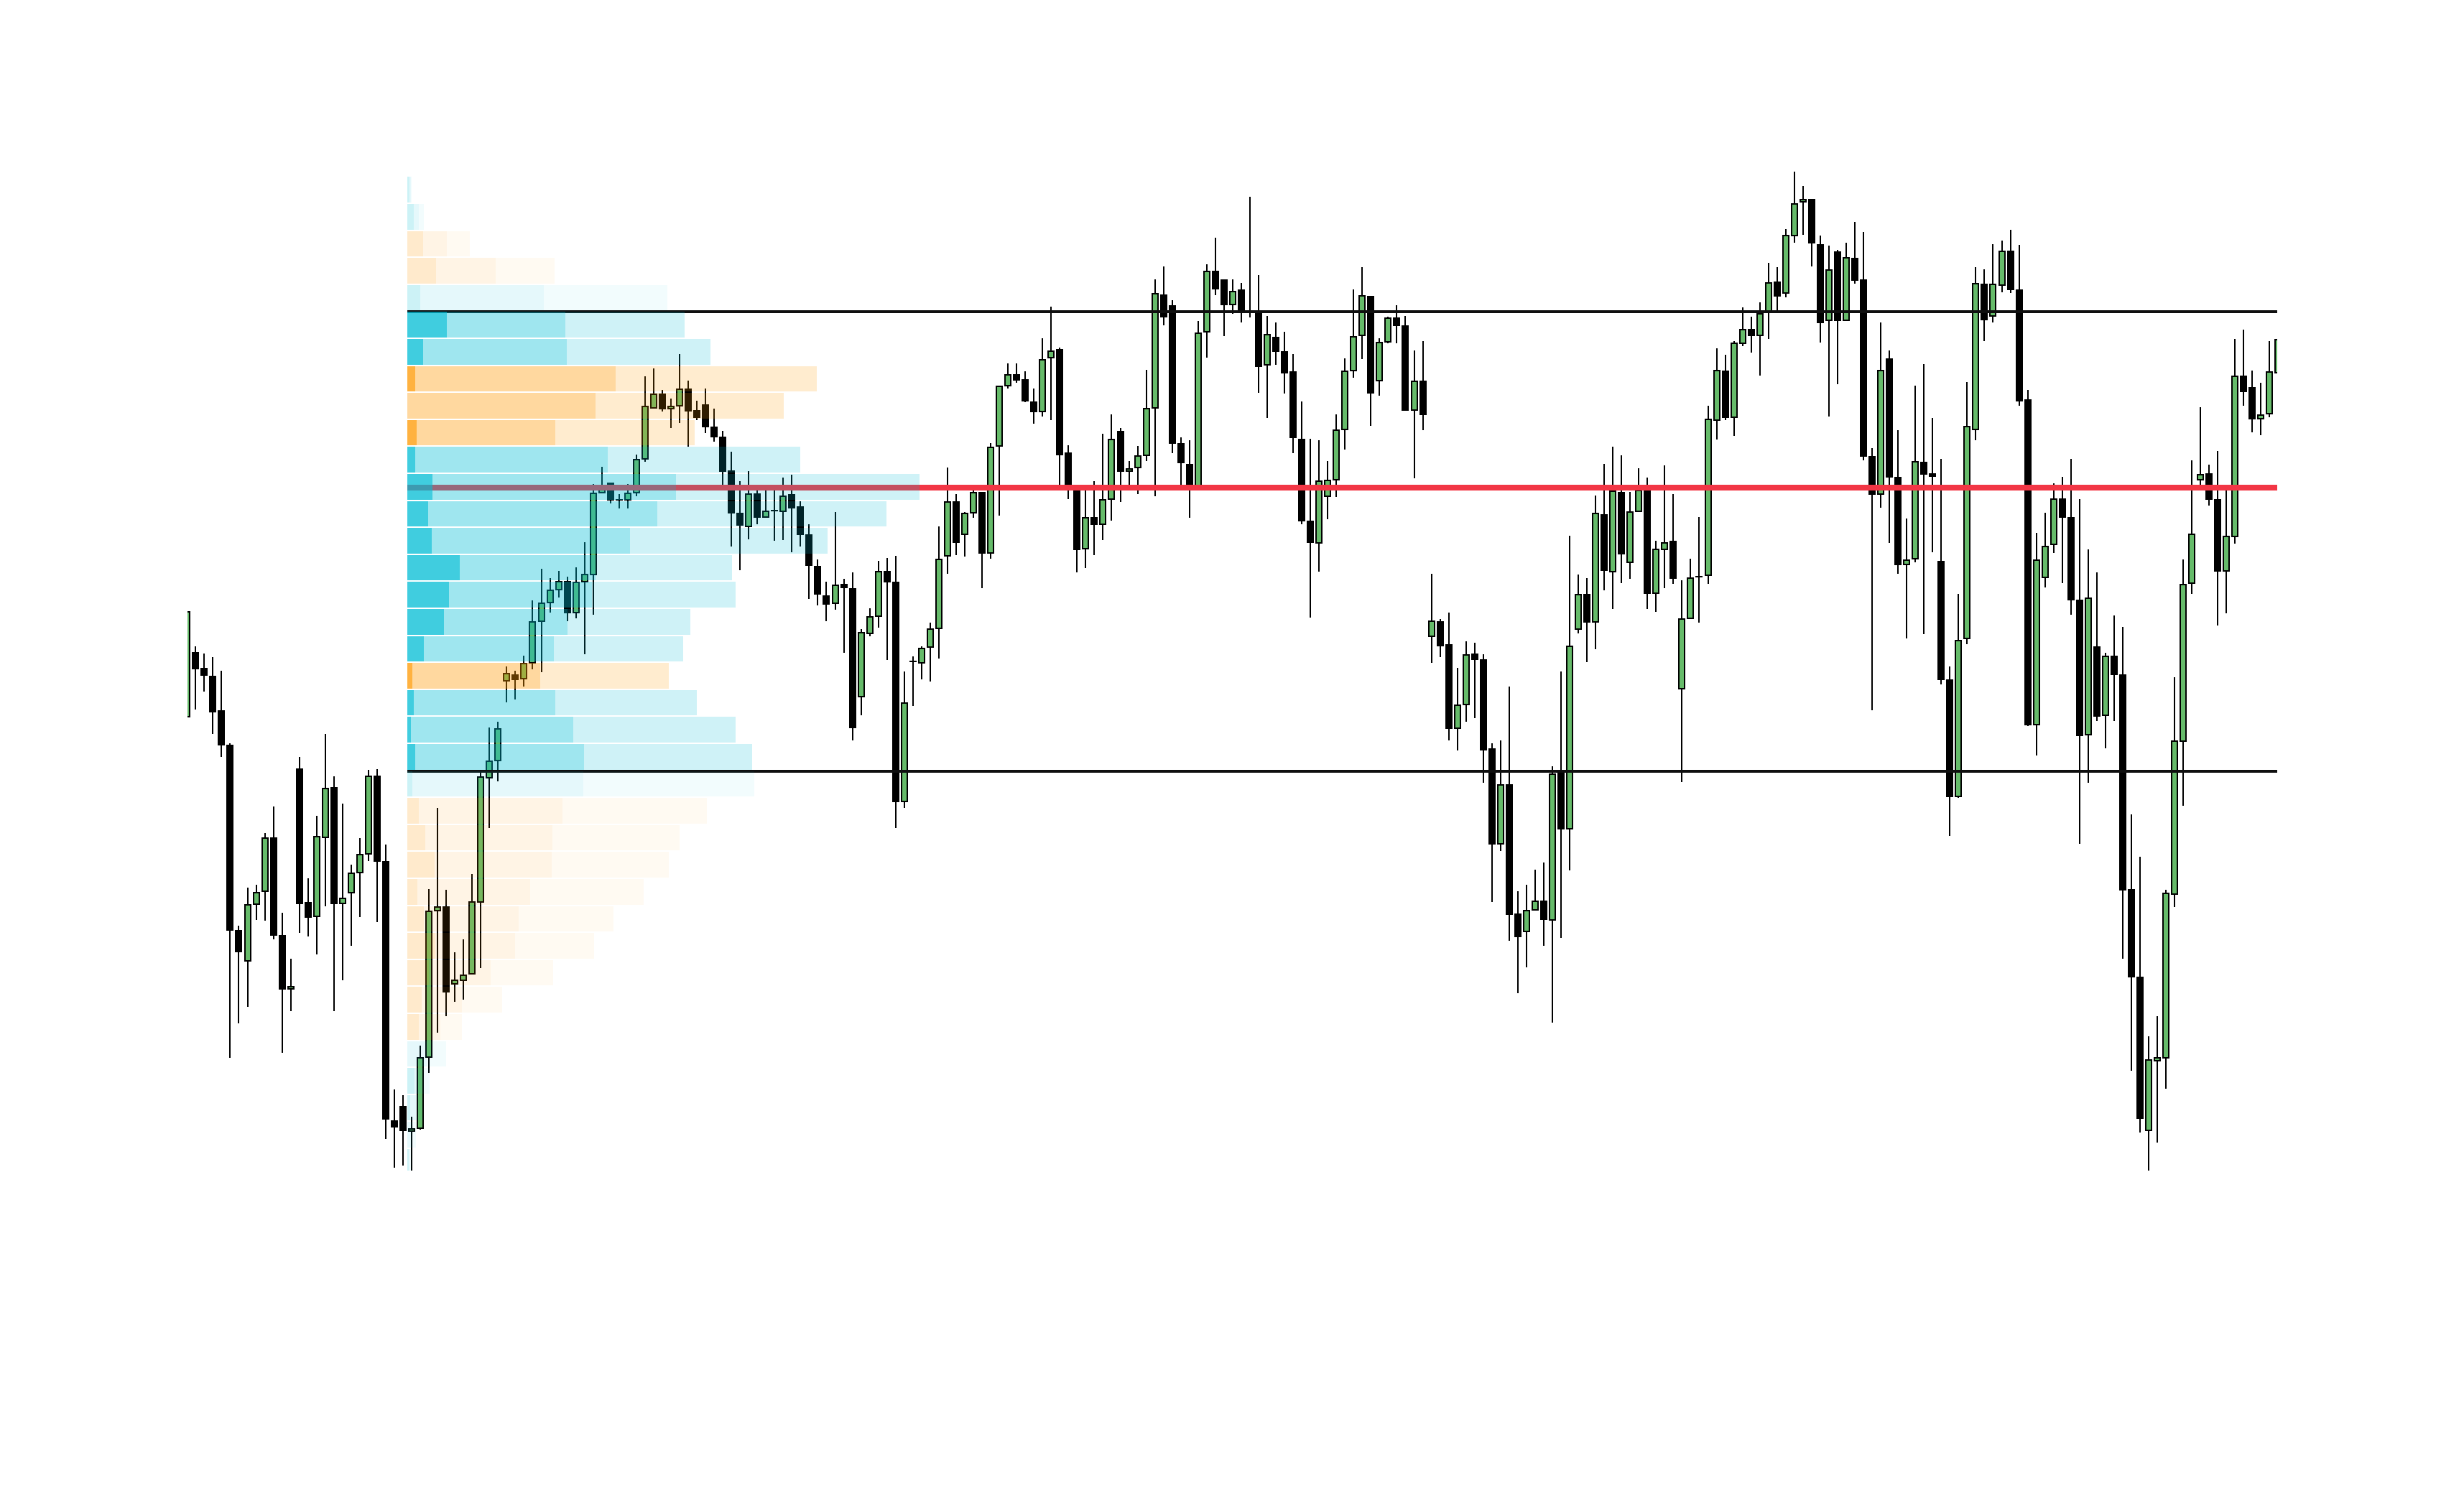
- Structure: Bell-shaped curve centered in the middle of the range.
- Context: Market is in equilibrium; buyers and sellers agree on value.
- Strategy: Trade mean-reversion at boundaries (sell VAH, buy VAL) or wait for confirmed breakout expansion.
P-Shape (Bullish / Short Covering Profile)
P-Shape Profile
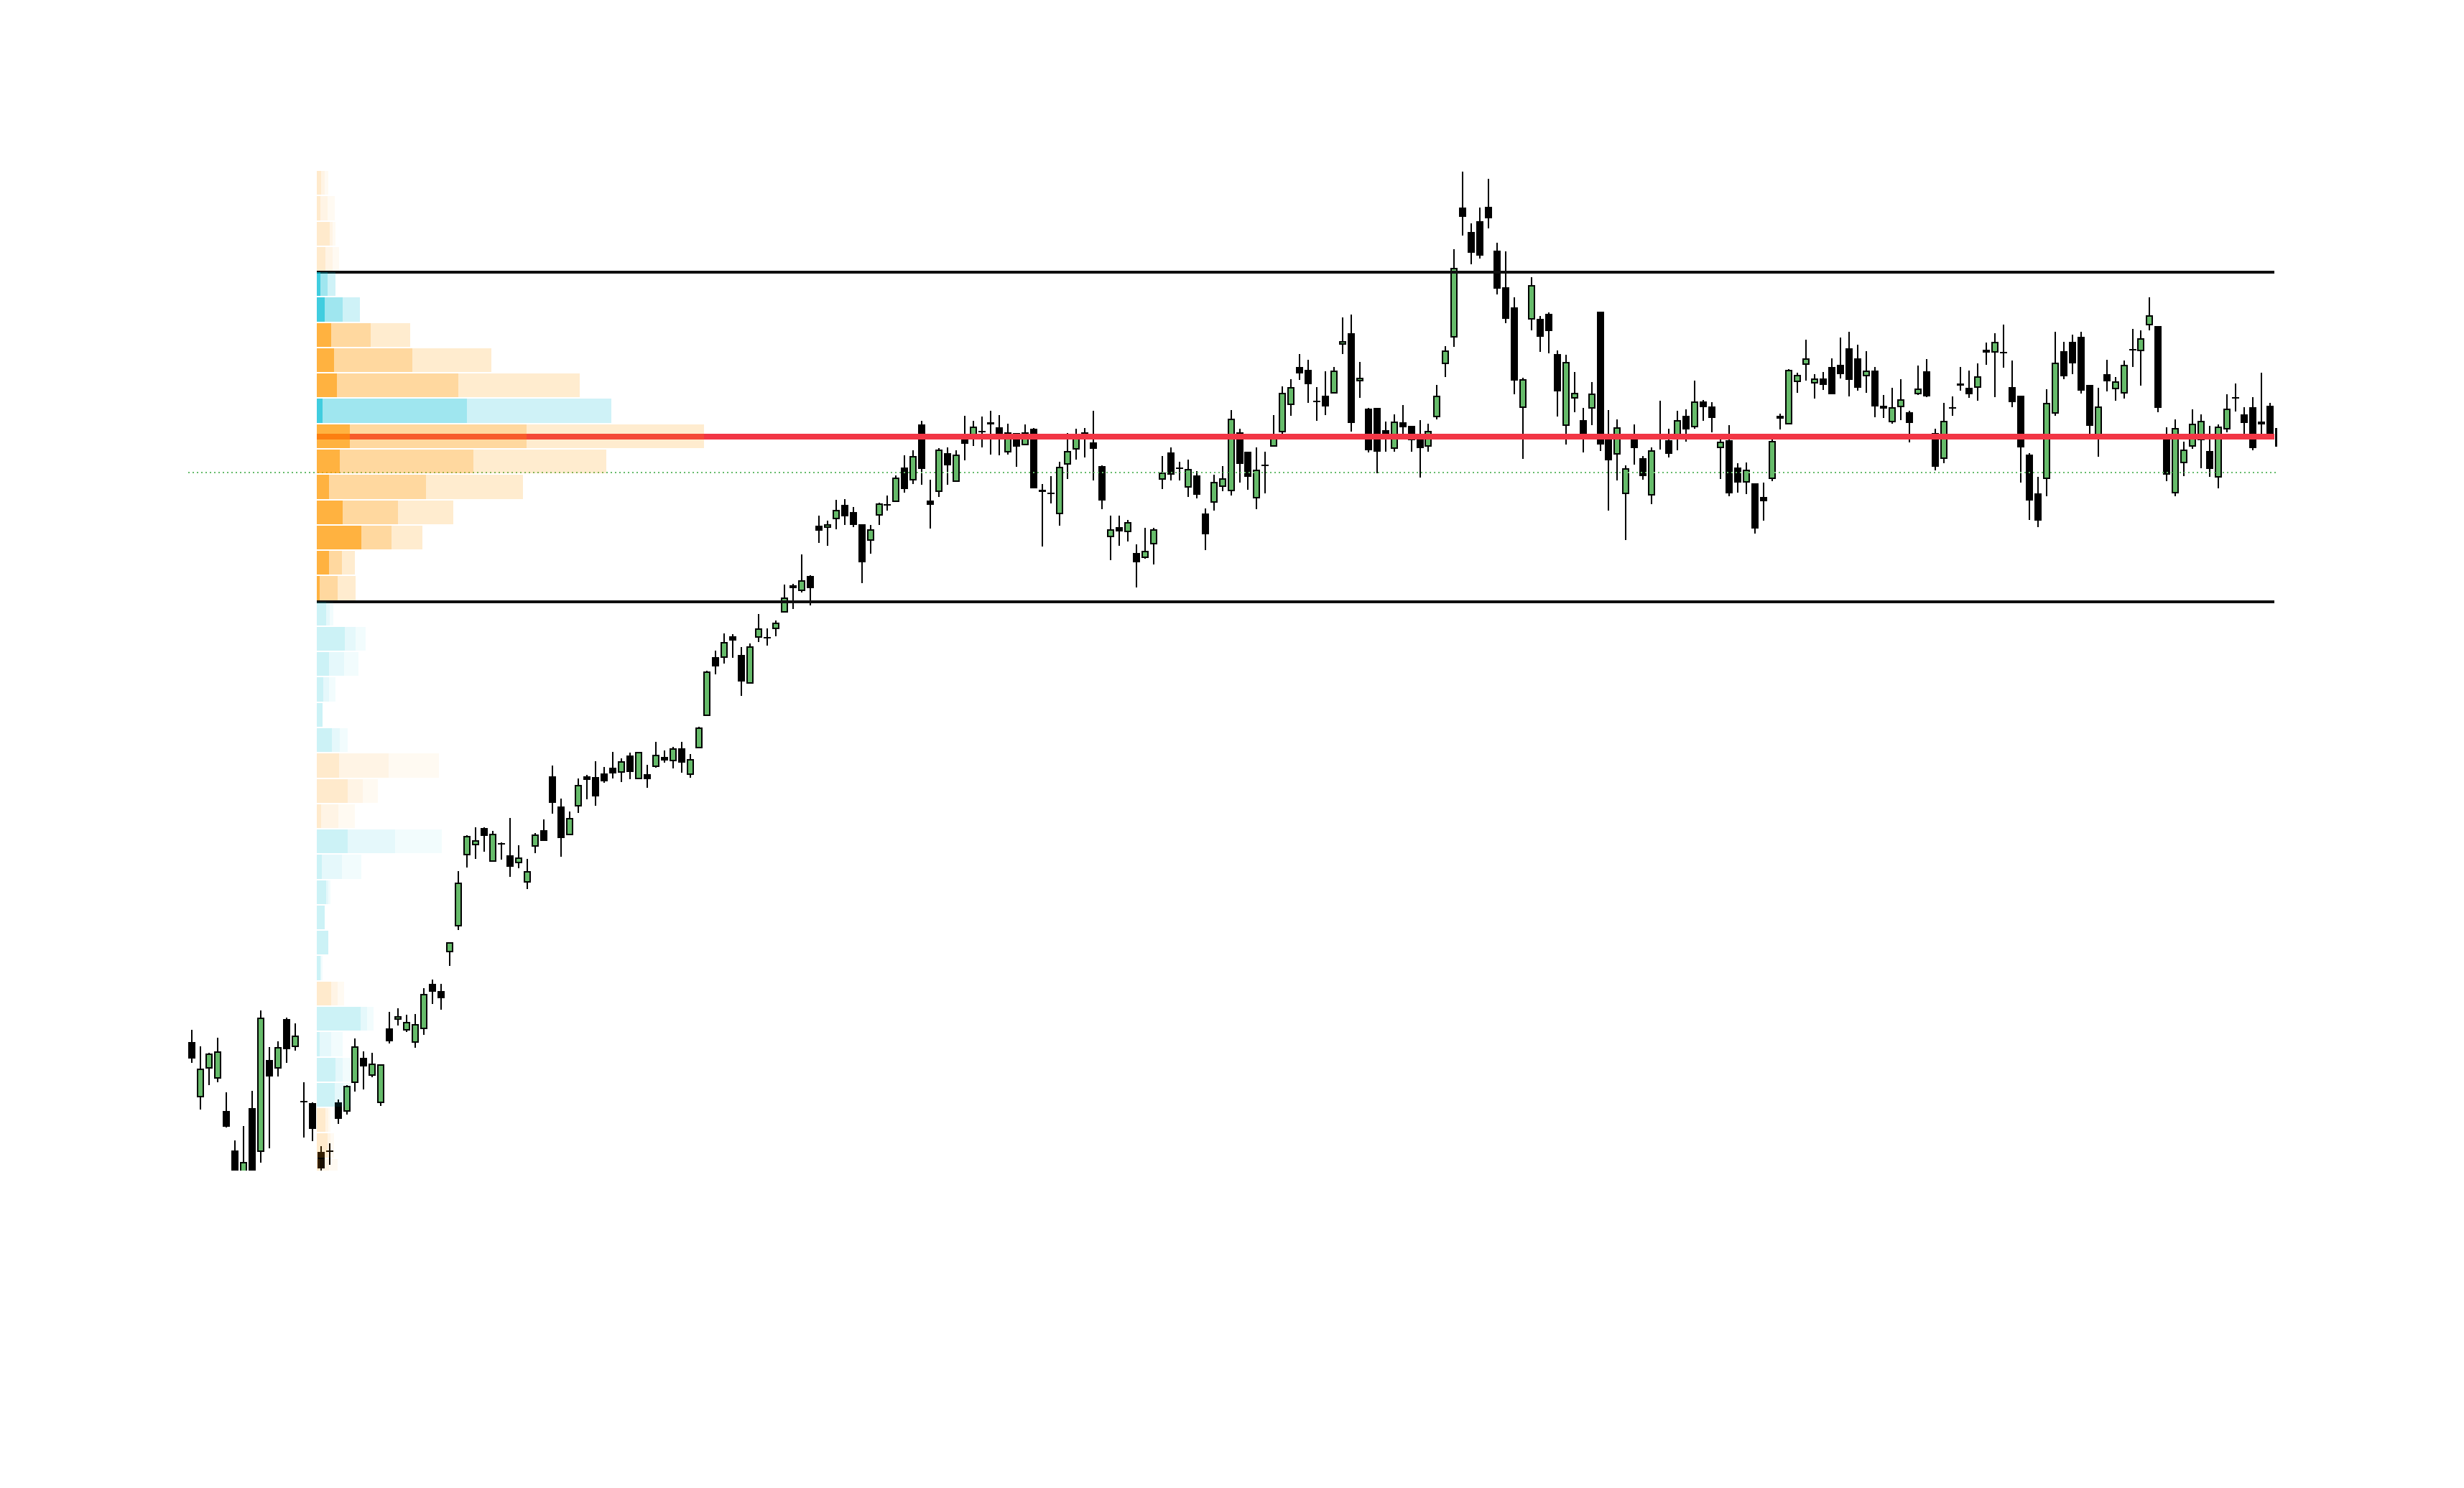
- Structure: Narrow bottom stem with a wide volume node at the top.
- Context: Aggressive buying drove price higher, establishing new fair value at the highs.
- Strategy: In a downtrend, a P-shape indicates short covering. In an uptrend, it confirms bullish continuation.
b-Shape (Bearish / Long Liquidation Profile)
b-Shape Profile
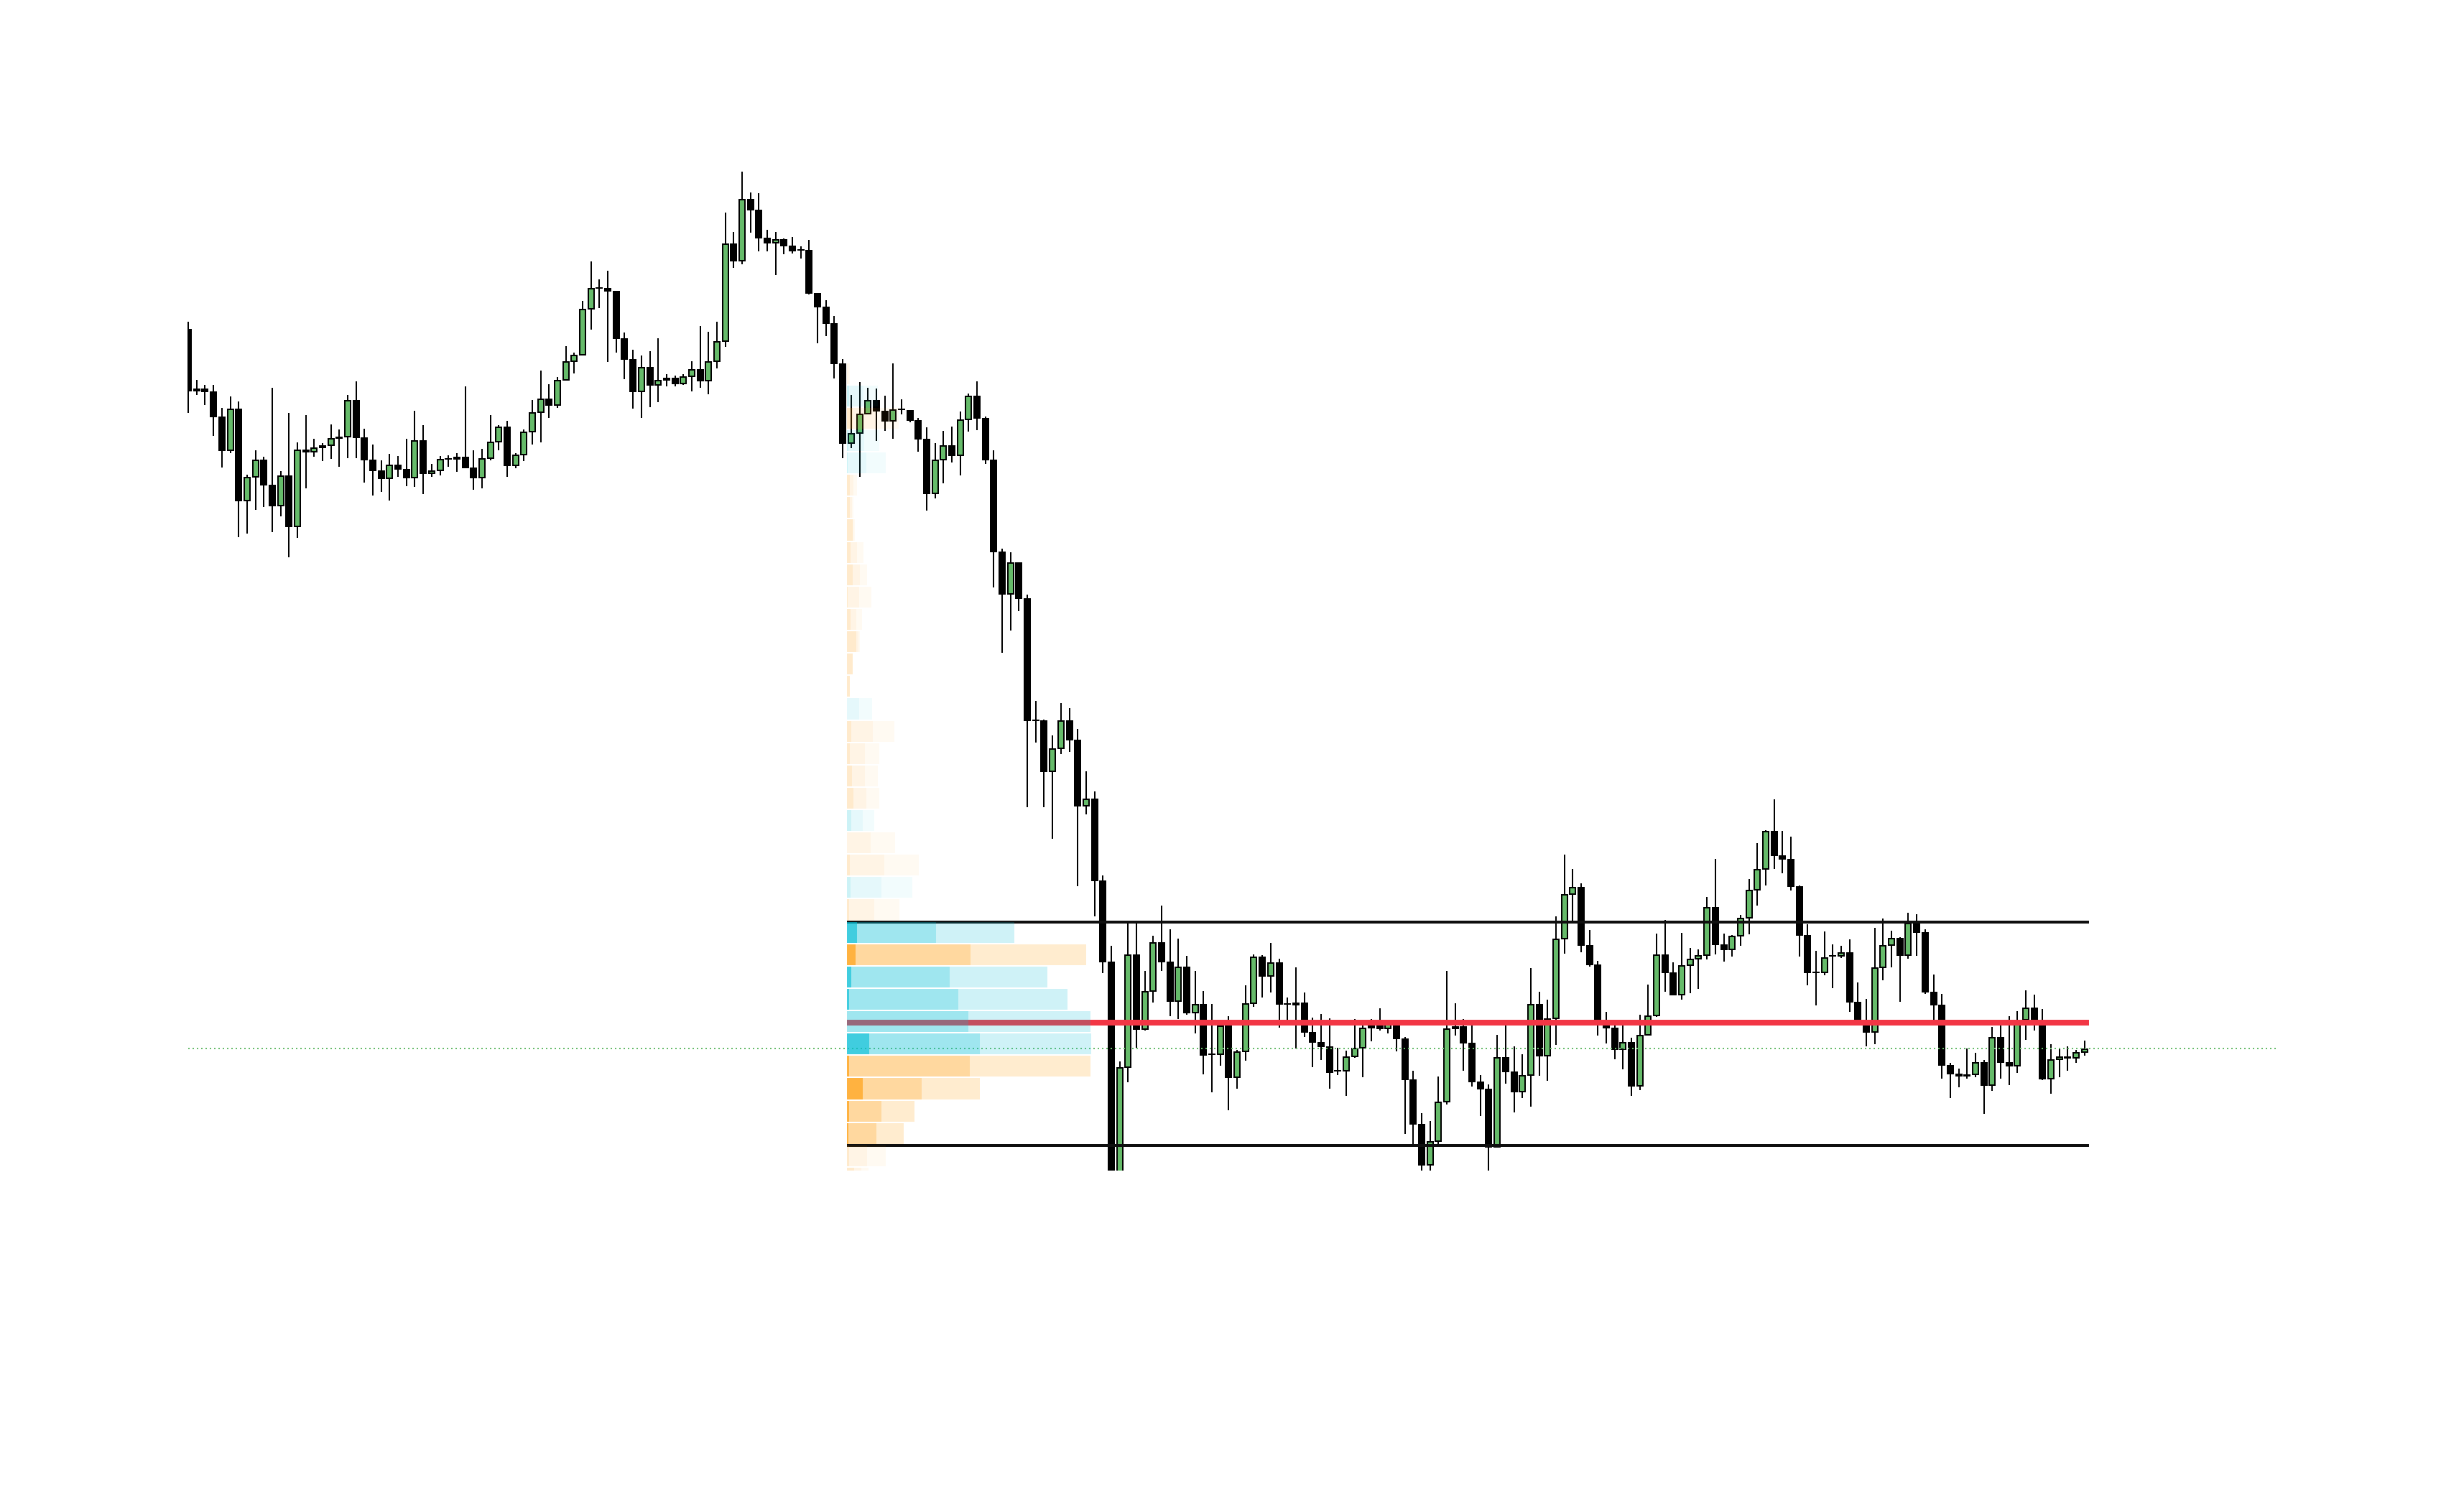
- Structure: Narrow top stem with a wide volume distribution at the bottom.
- Context: Aggressive selling forced price down, accepting lower fair value.
- Strategy: Signals long liquidation during uptrends and bearish acceptance in established downtrends.
B-Shape (Double Distribution Profile)
B-Shape Profile
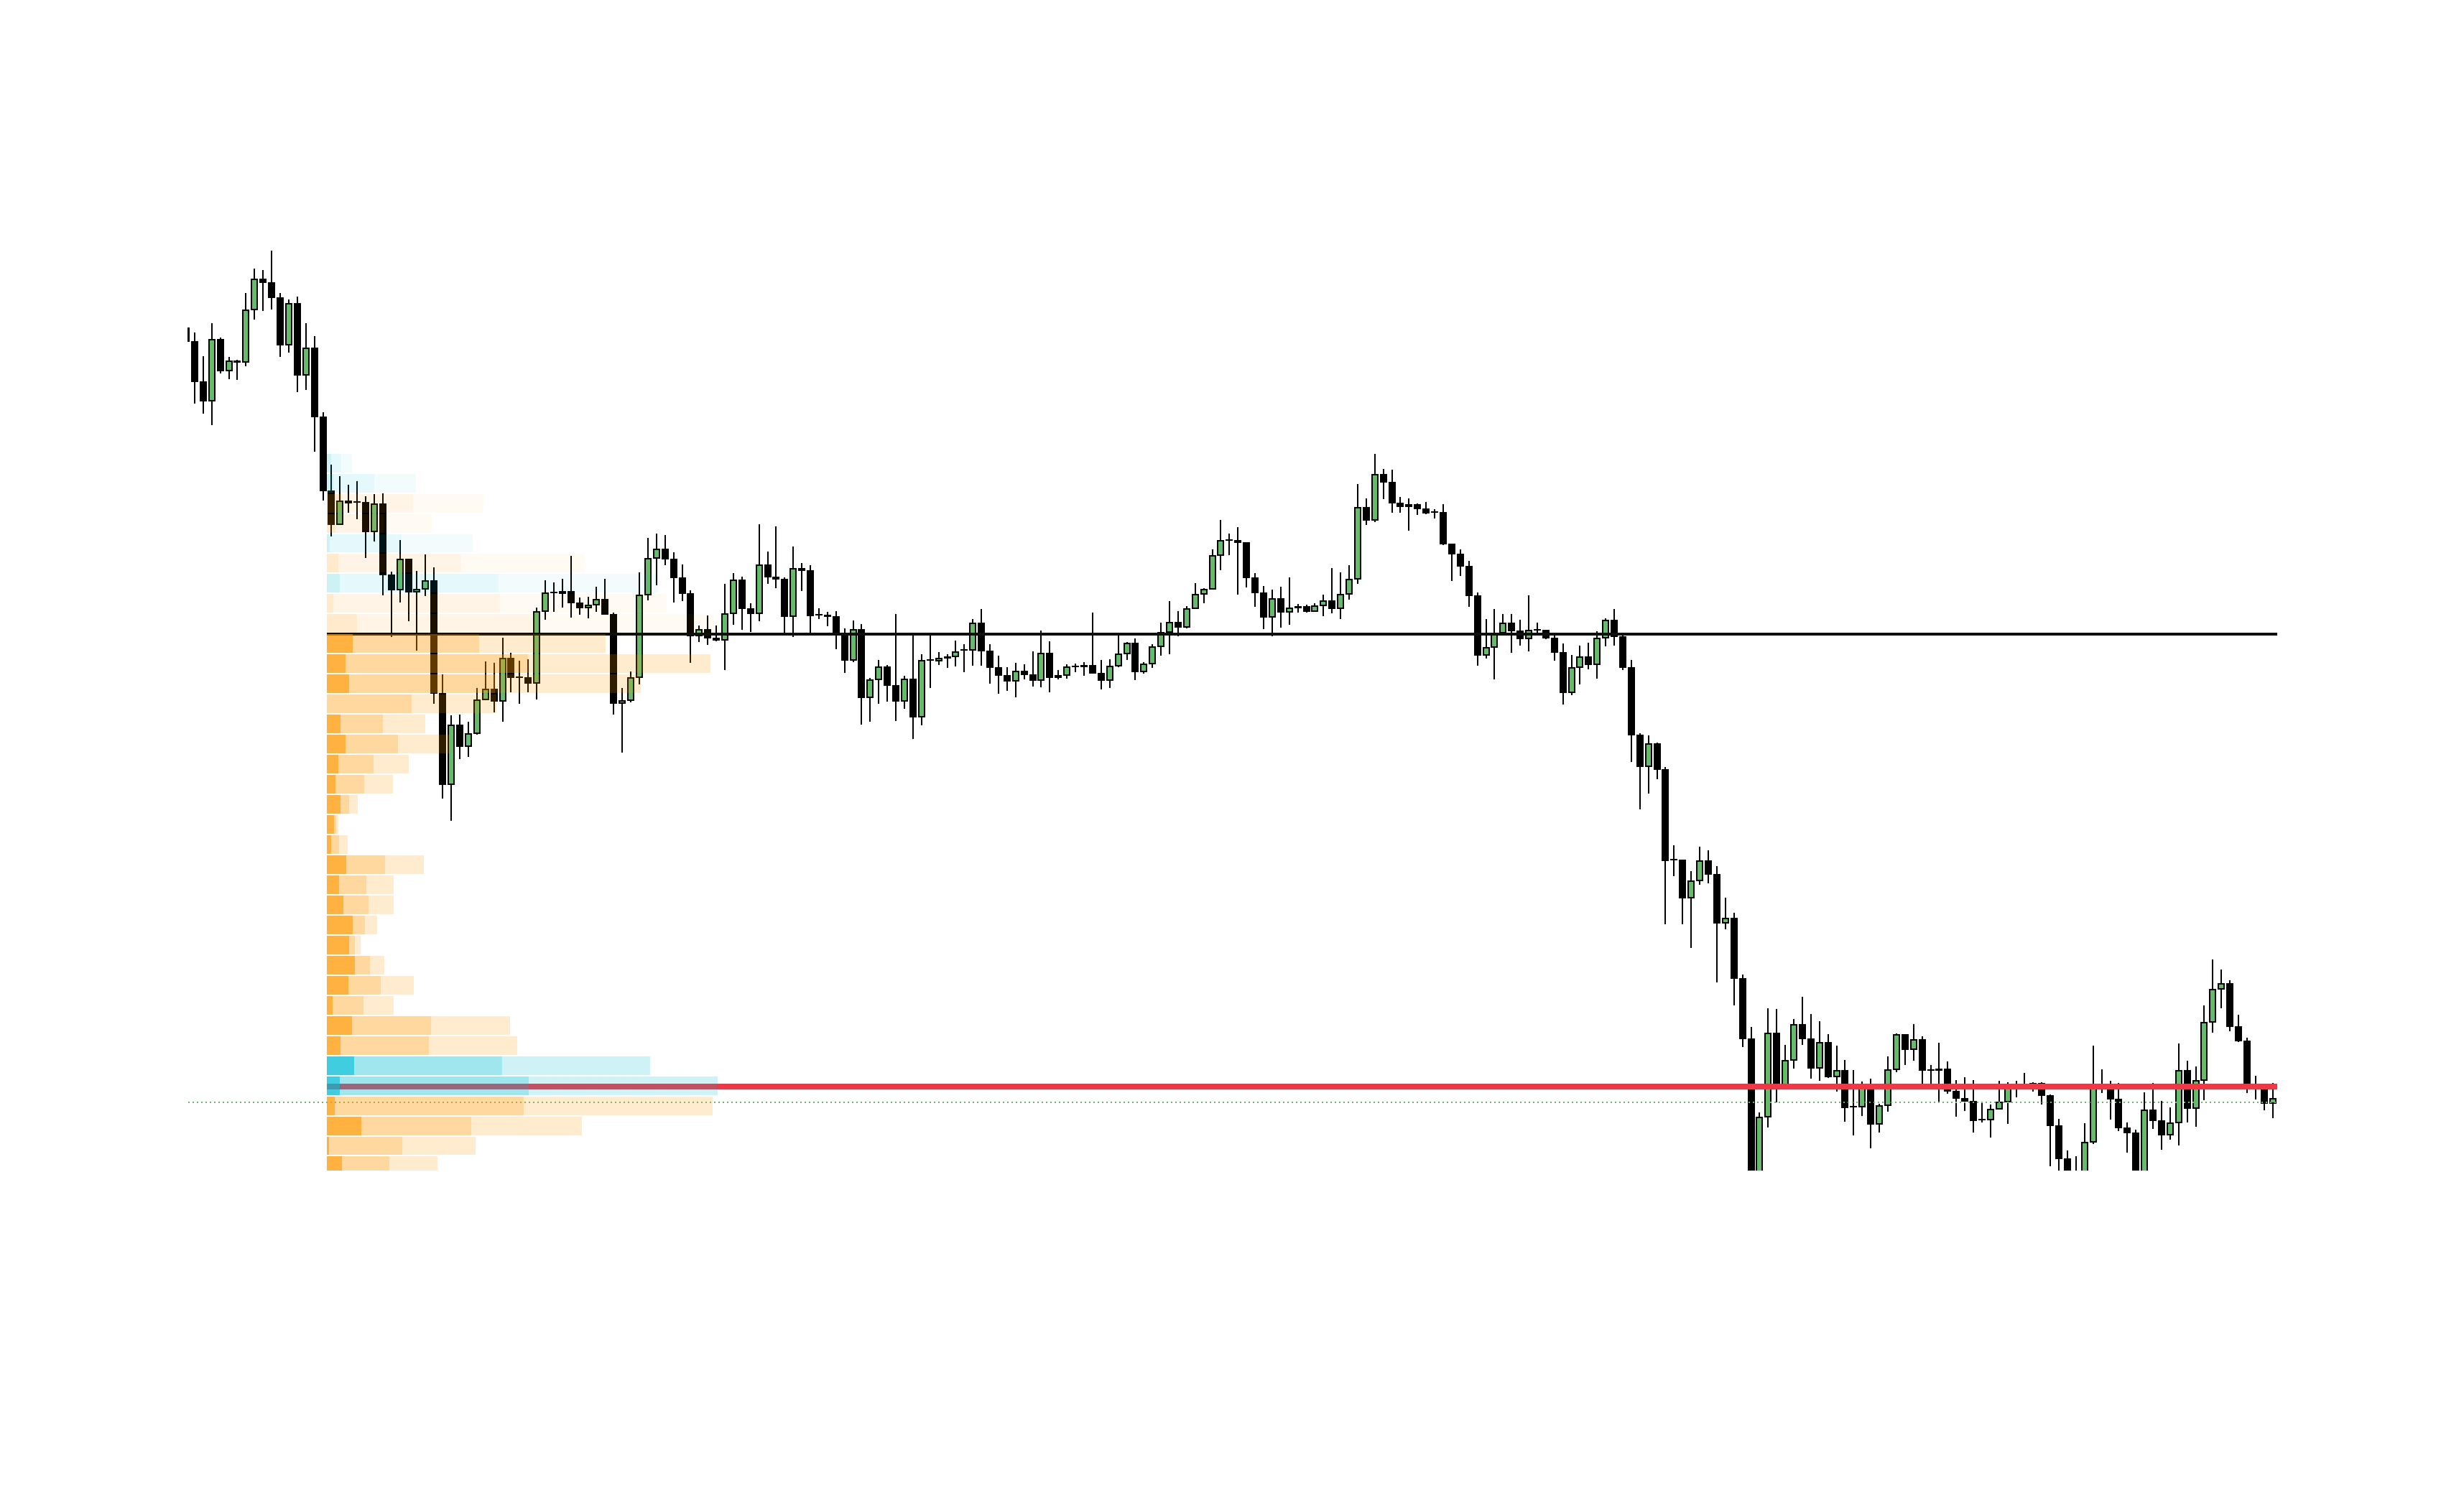
- Structure: Two distinct high-volume nodes separated by an intervening Low Volume Node (LVN).
- Context: Market transitioned from one fair-value zone to a new price zone.
- Strategy: The central LVN functions as a key structural pivot line.
Thin / I-Shape (Trend Profile)
I-Shape Profile
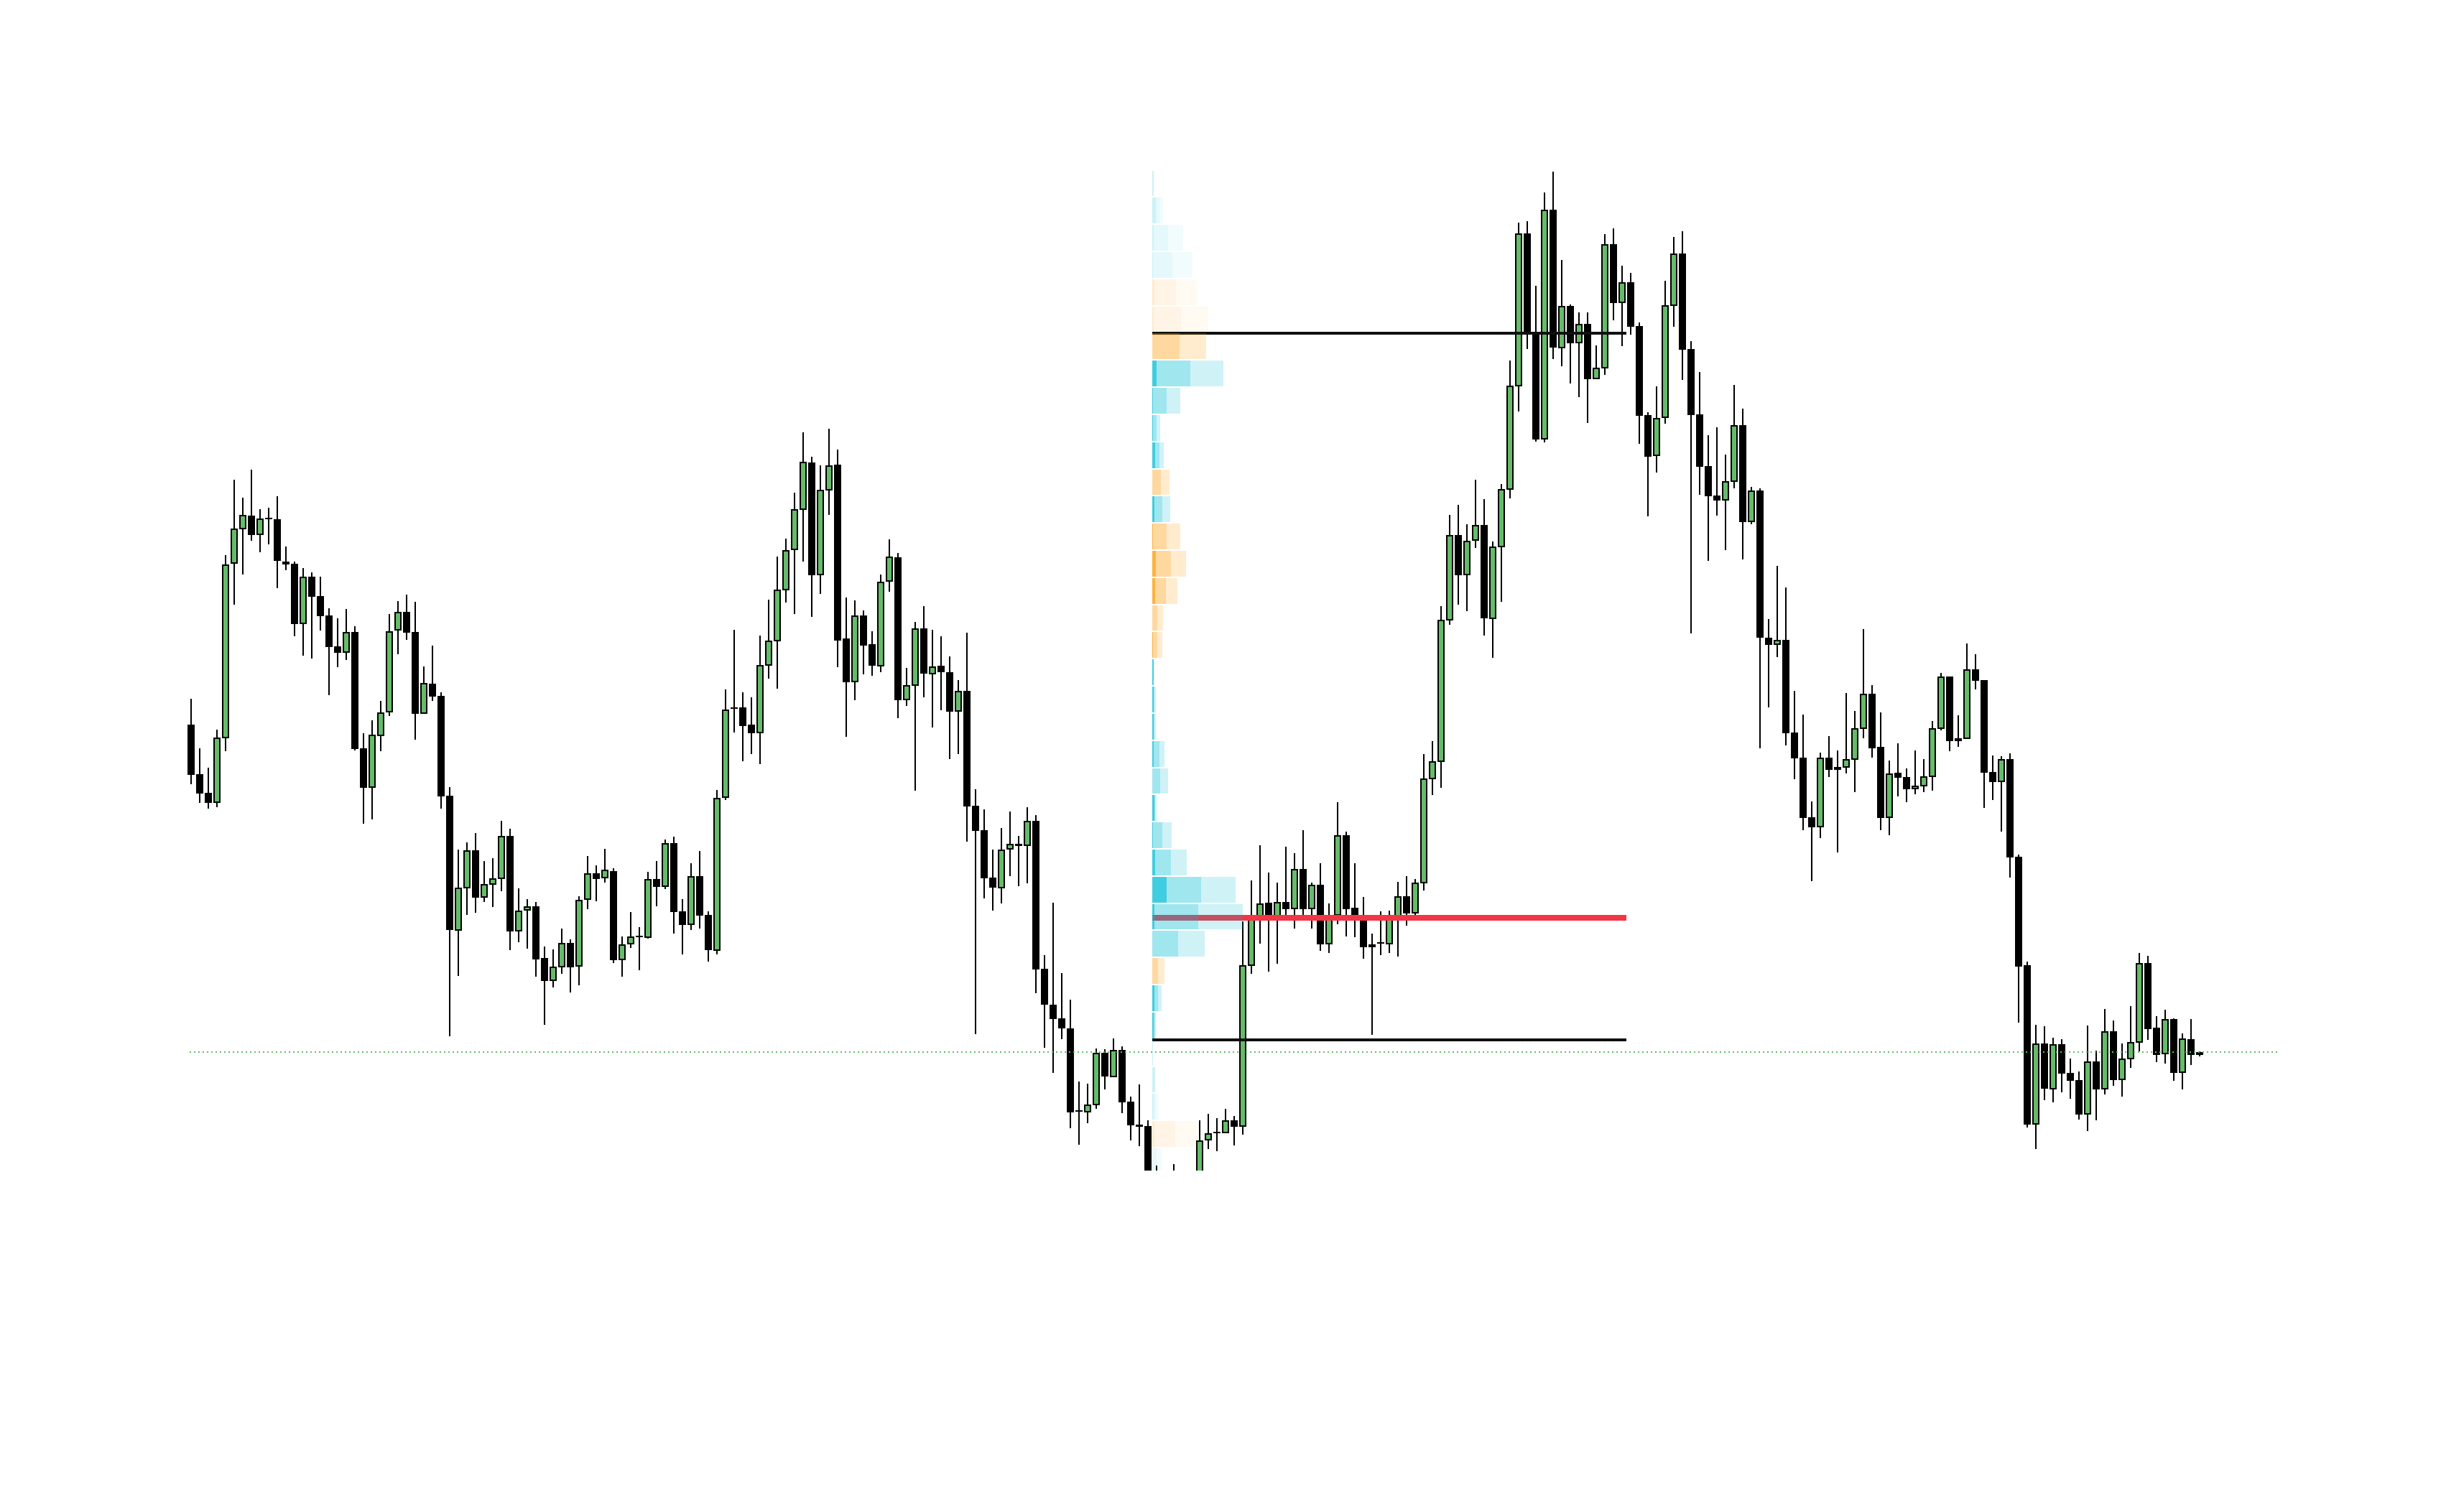
- Structure: Elongated, narrow profile without a single dominant cluster.
- Context: Severe market imbalance where price moves too rapidly to build fair-value volume.
L-Shape & J-Shape Profiles
L-Shape and J-Shape Profiles
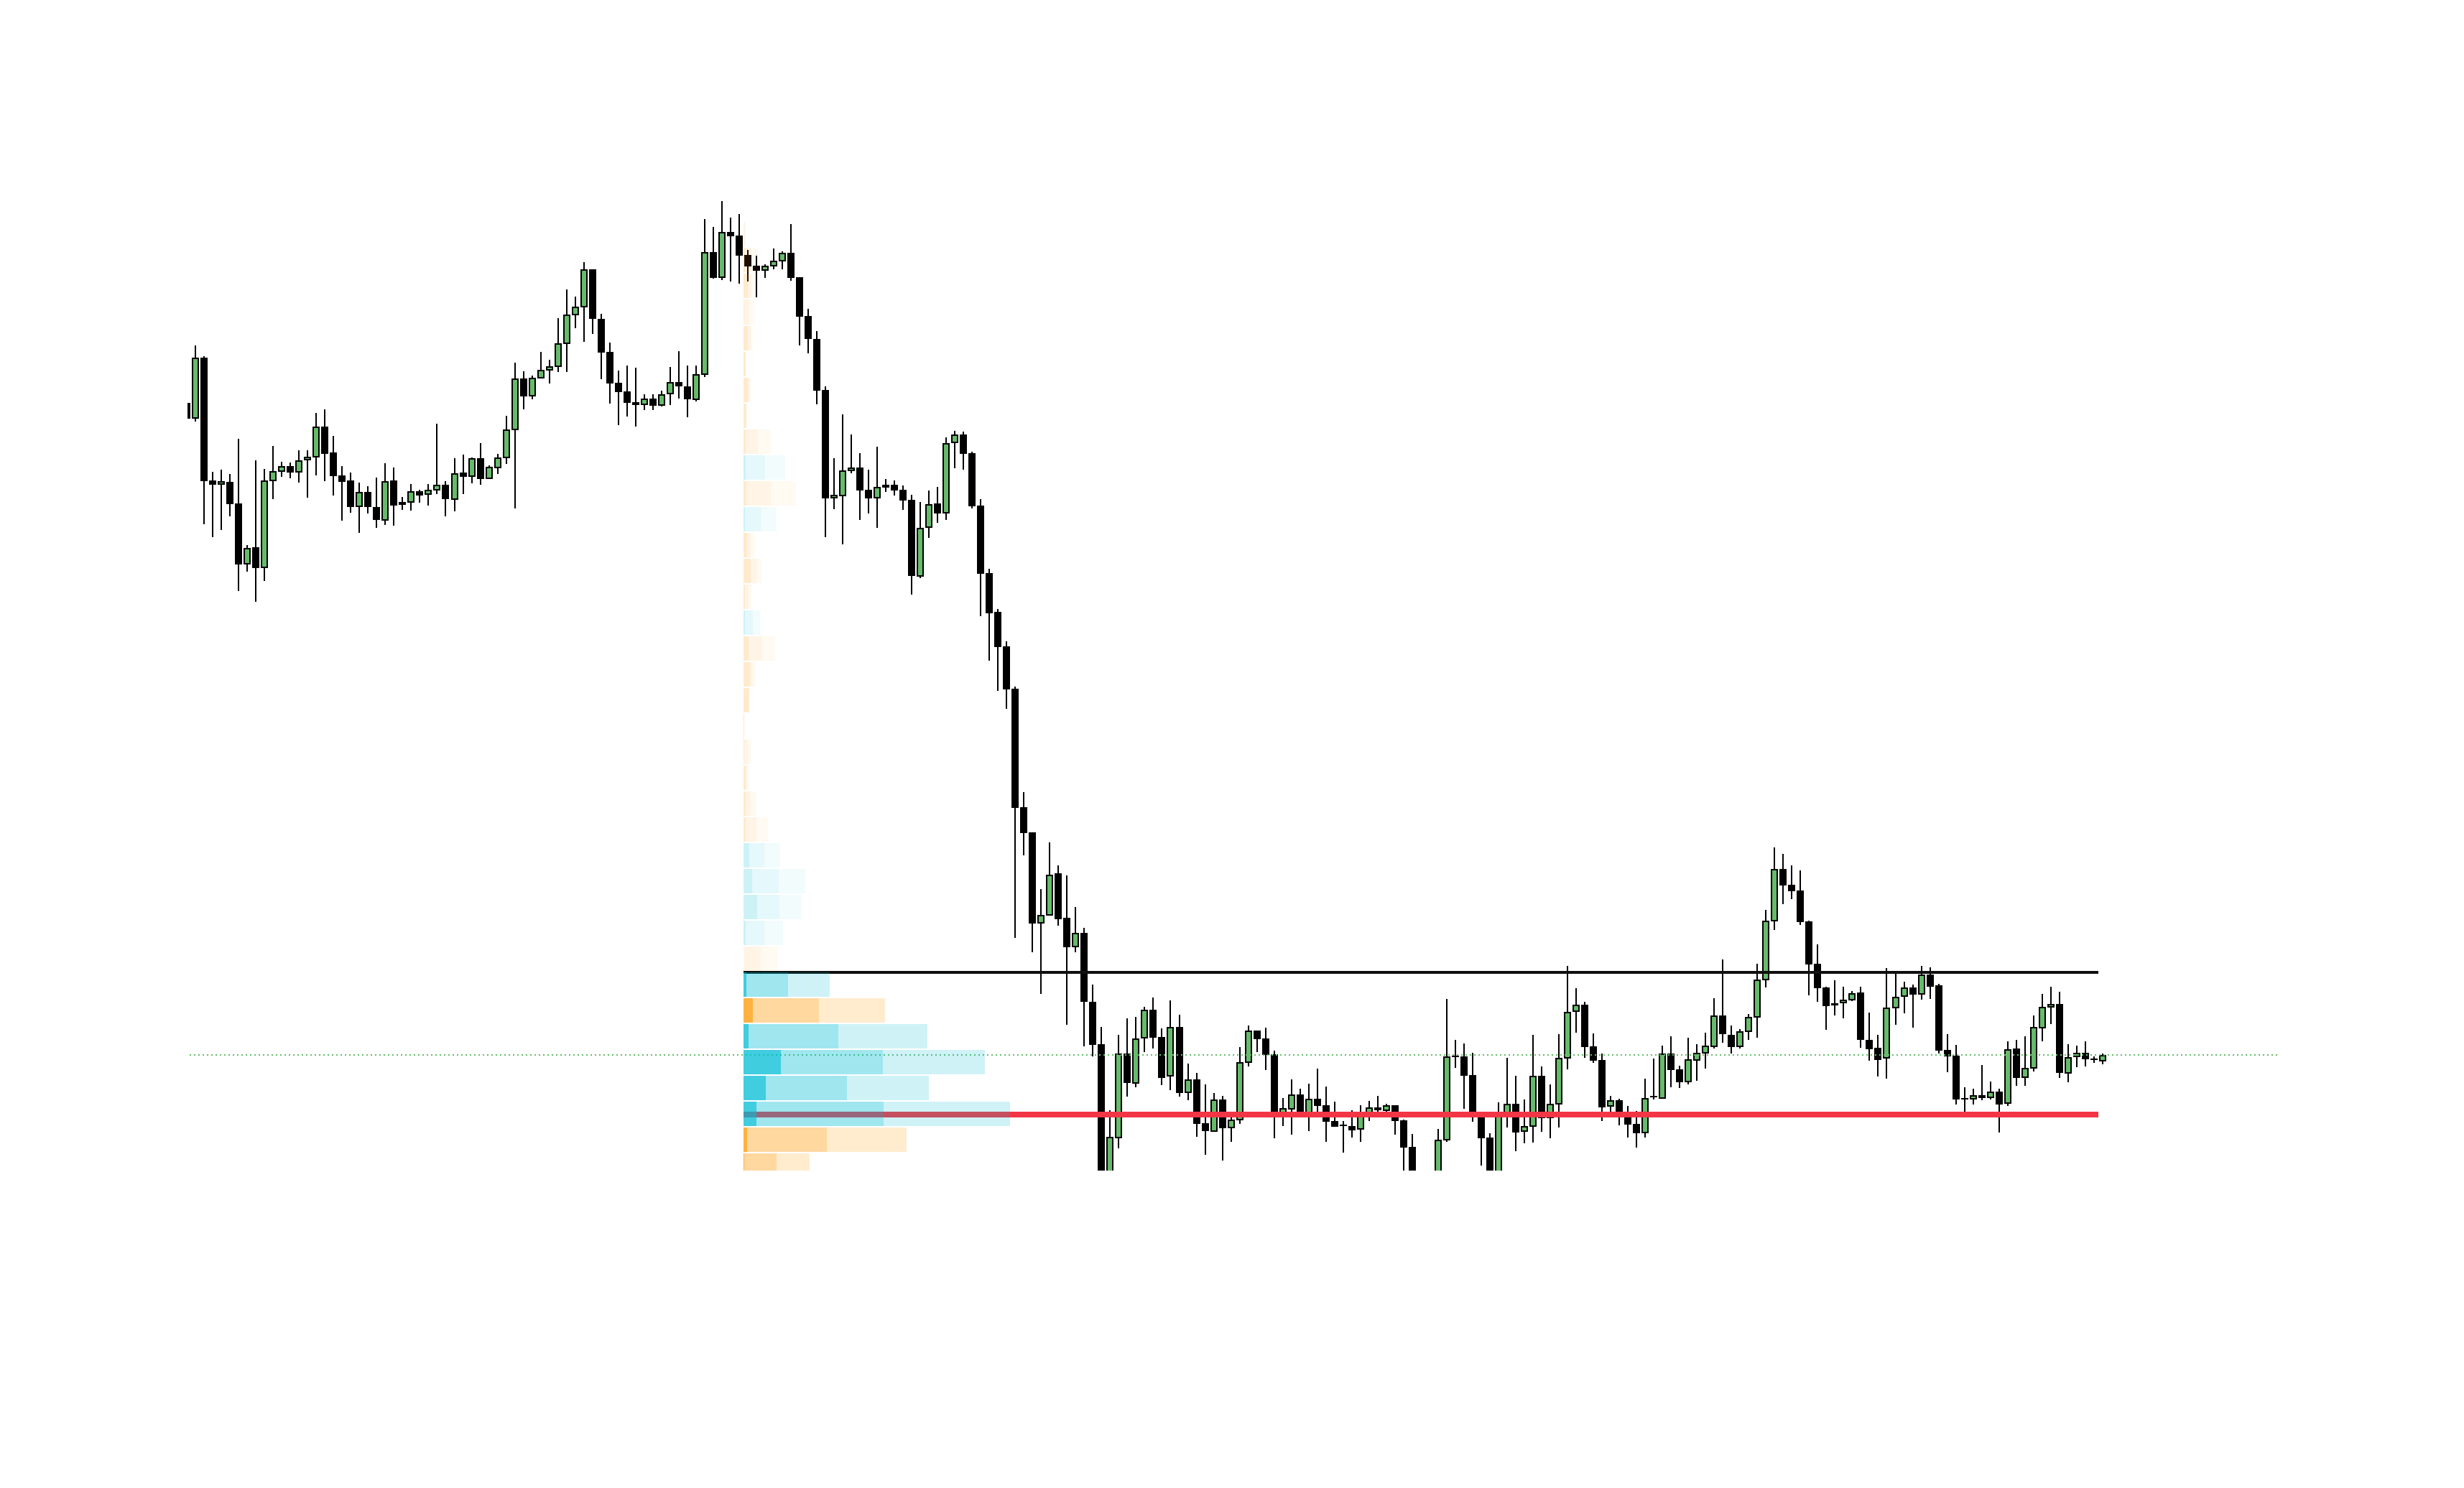
- L-Shape: Stabilization at lower price levels following a severe sell-off.
- J-Shape: Sharp buying tail at the lower boundary, indicating strong responsive buyers.
Triple Distribution Profile
Triple Distribution Profile
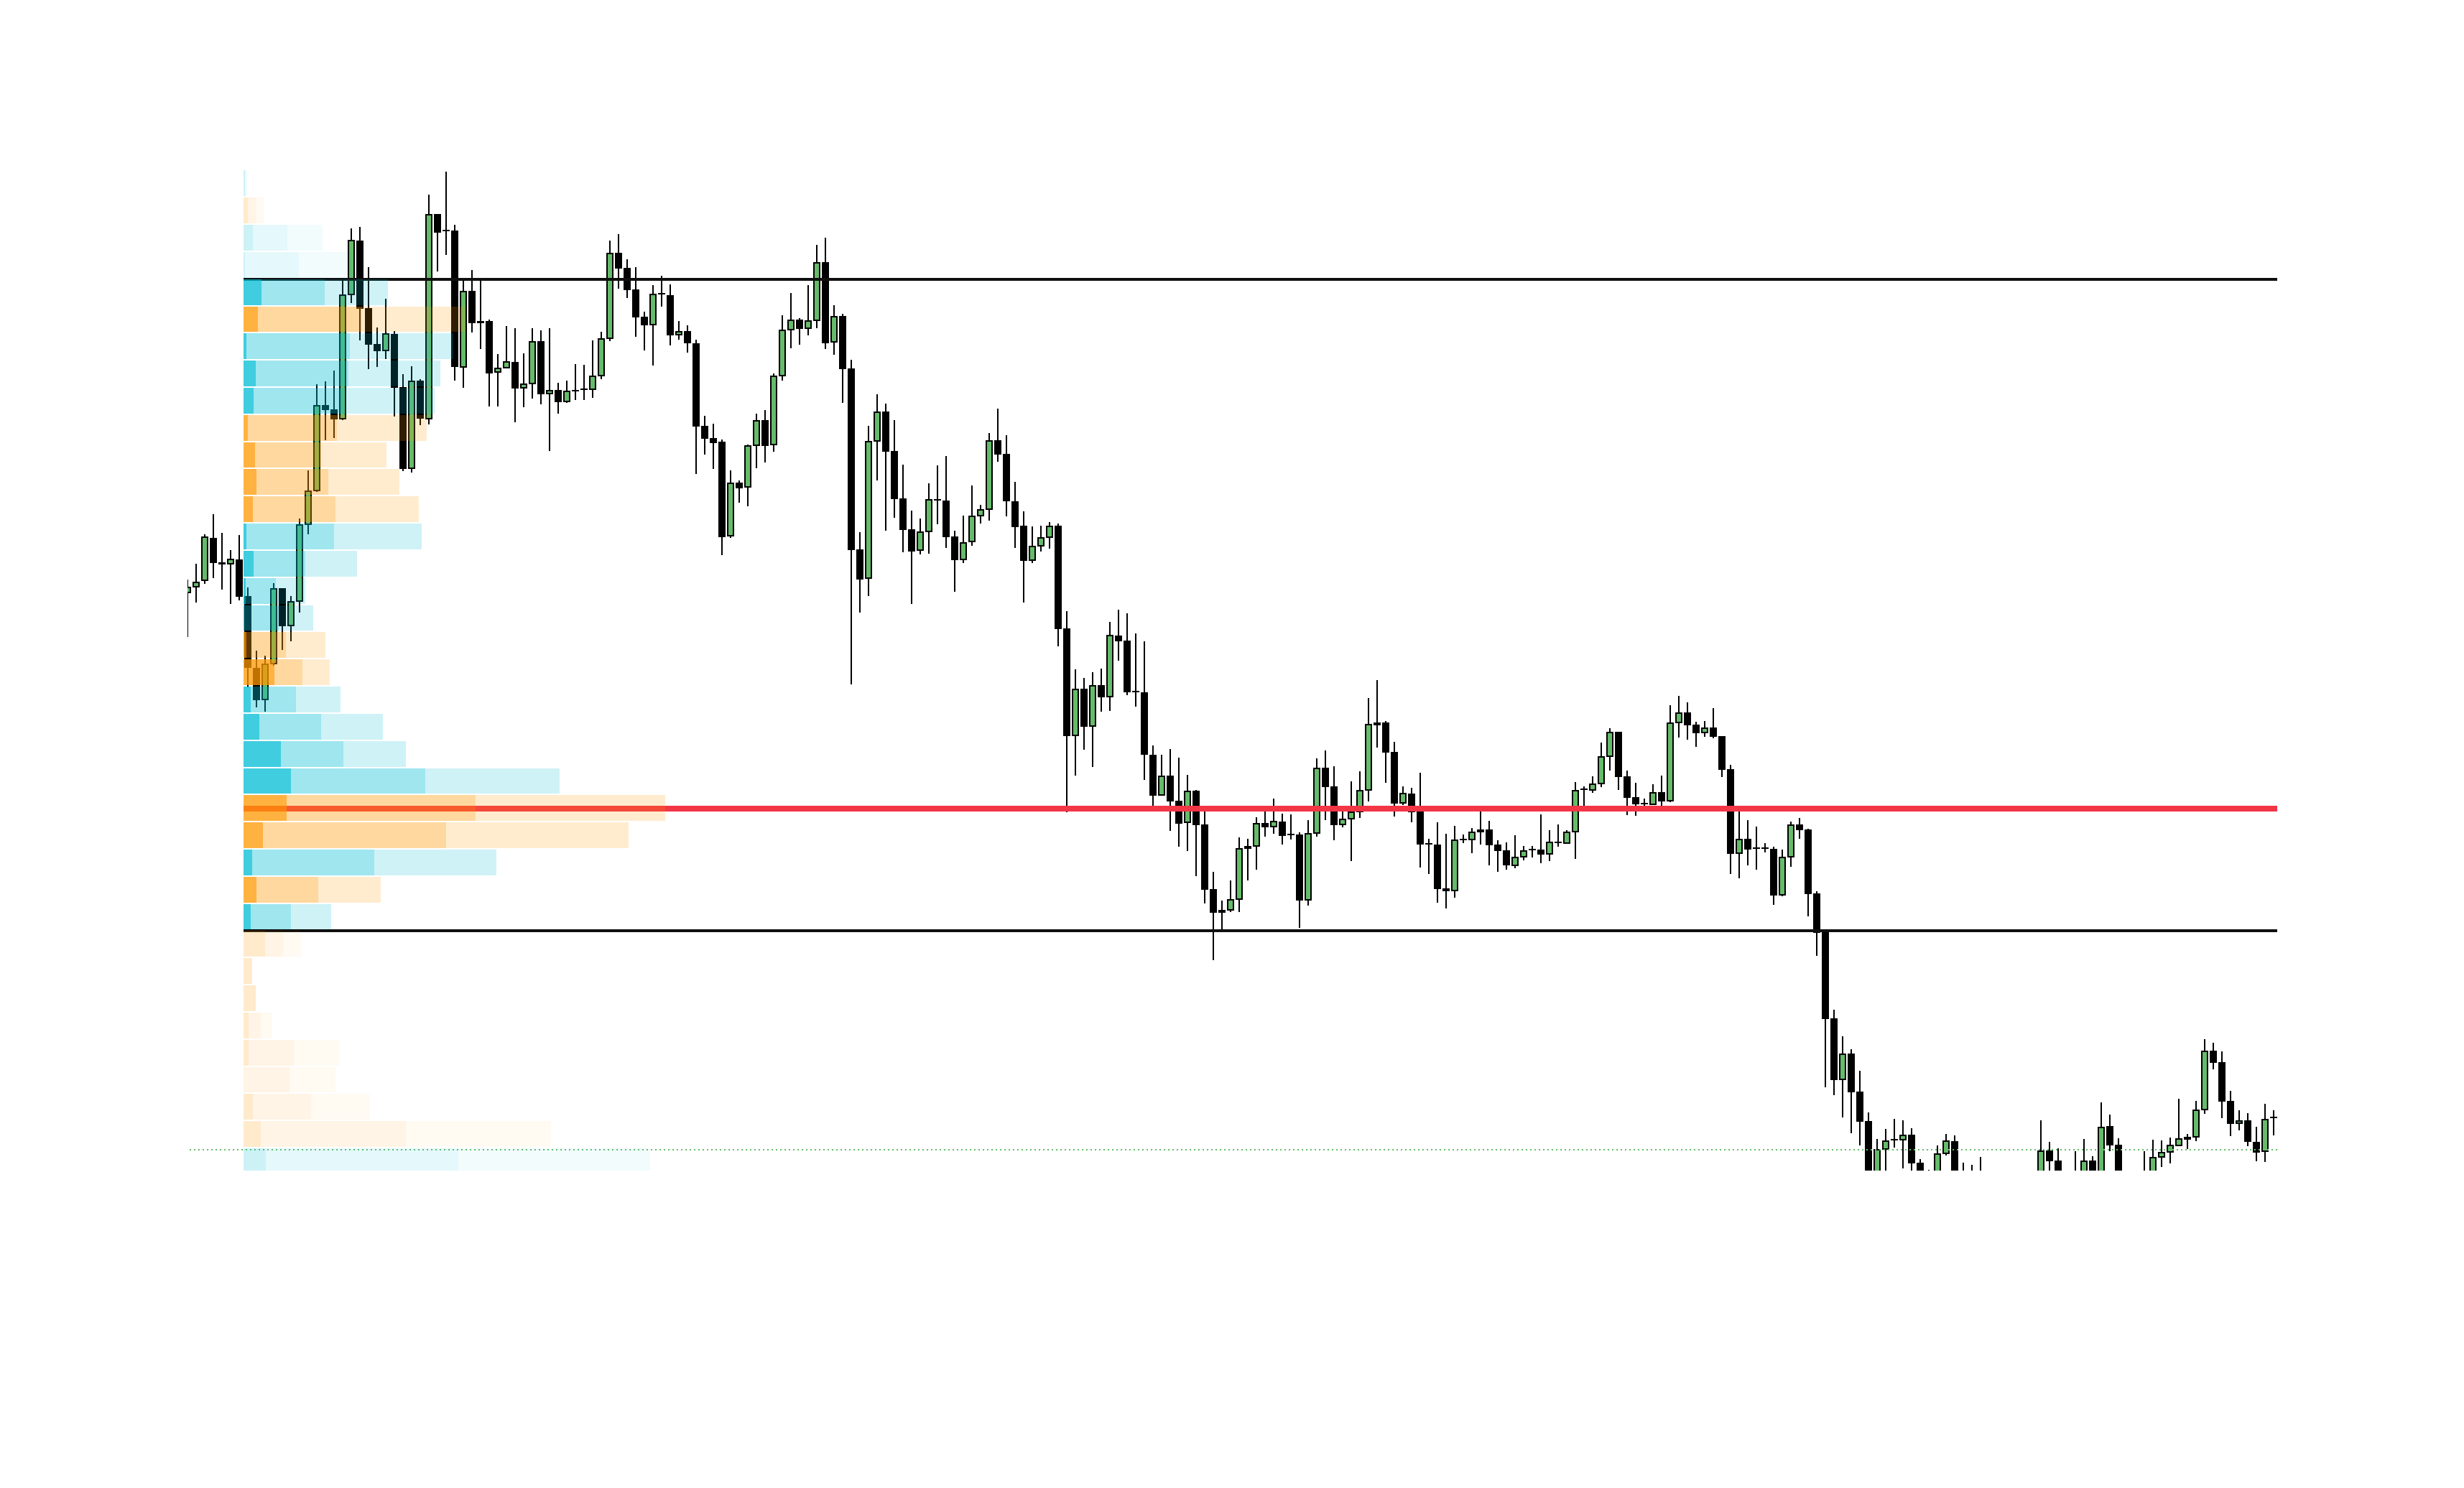
- Structure: Three separate volume distributions stacked vertically.
- Context: Strong trend day where price stair-stepped through multiple balance zones.
5. Advanced Profile Concepts
Initial Balance (IB)
The Initial Balance represents the high and low range established during the opening 30 to 60 minutes of the trading session. An IB breakout often determines directional bias for the remainder of the session.
Tails & Unfinished Auctions
Extensive volume tails at profile extremes represent sharp price rejection. A profile lacking a tail at extremes indicates a "Poor High" or "Poor Low," signaling an unfinished auction that price will likely revisit to repair.
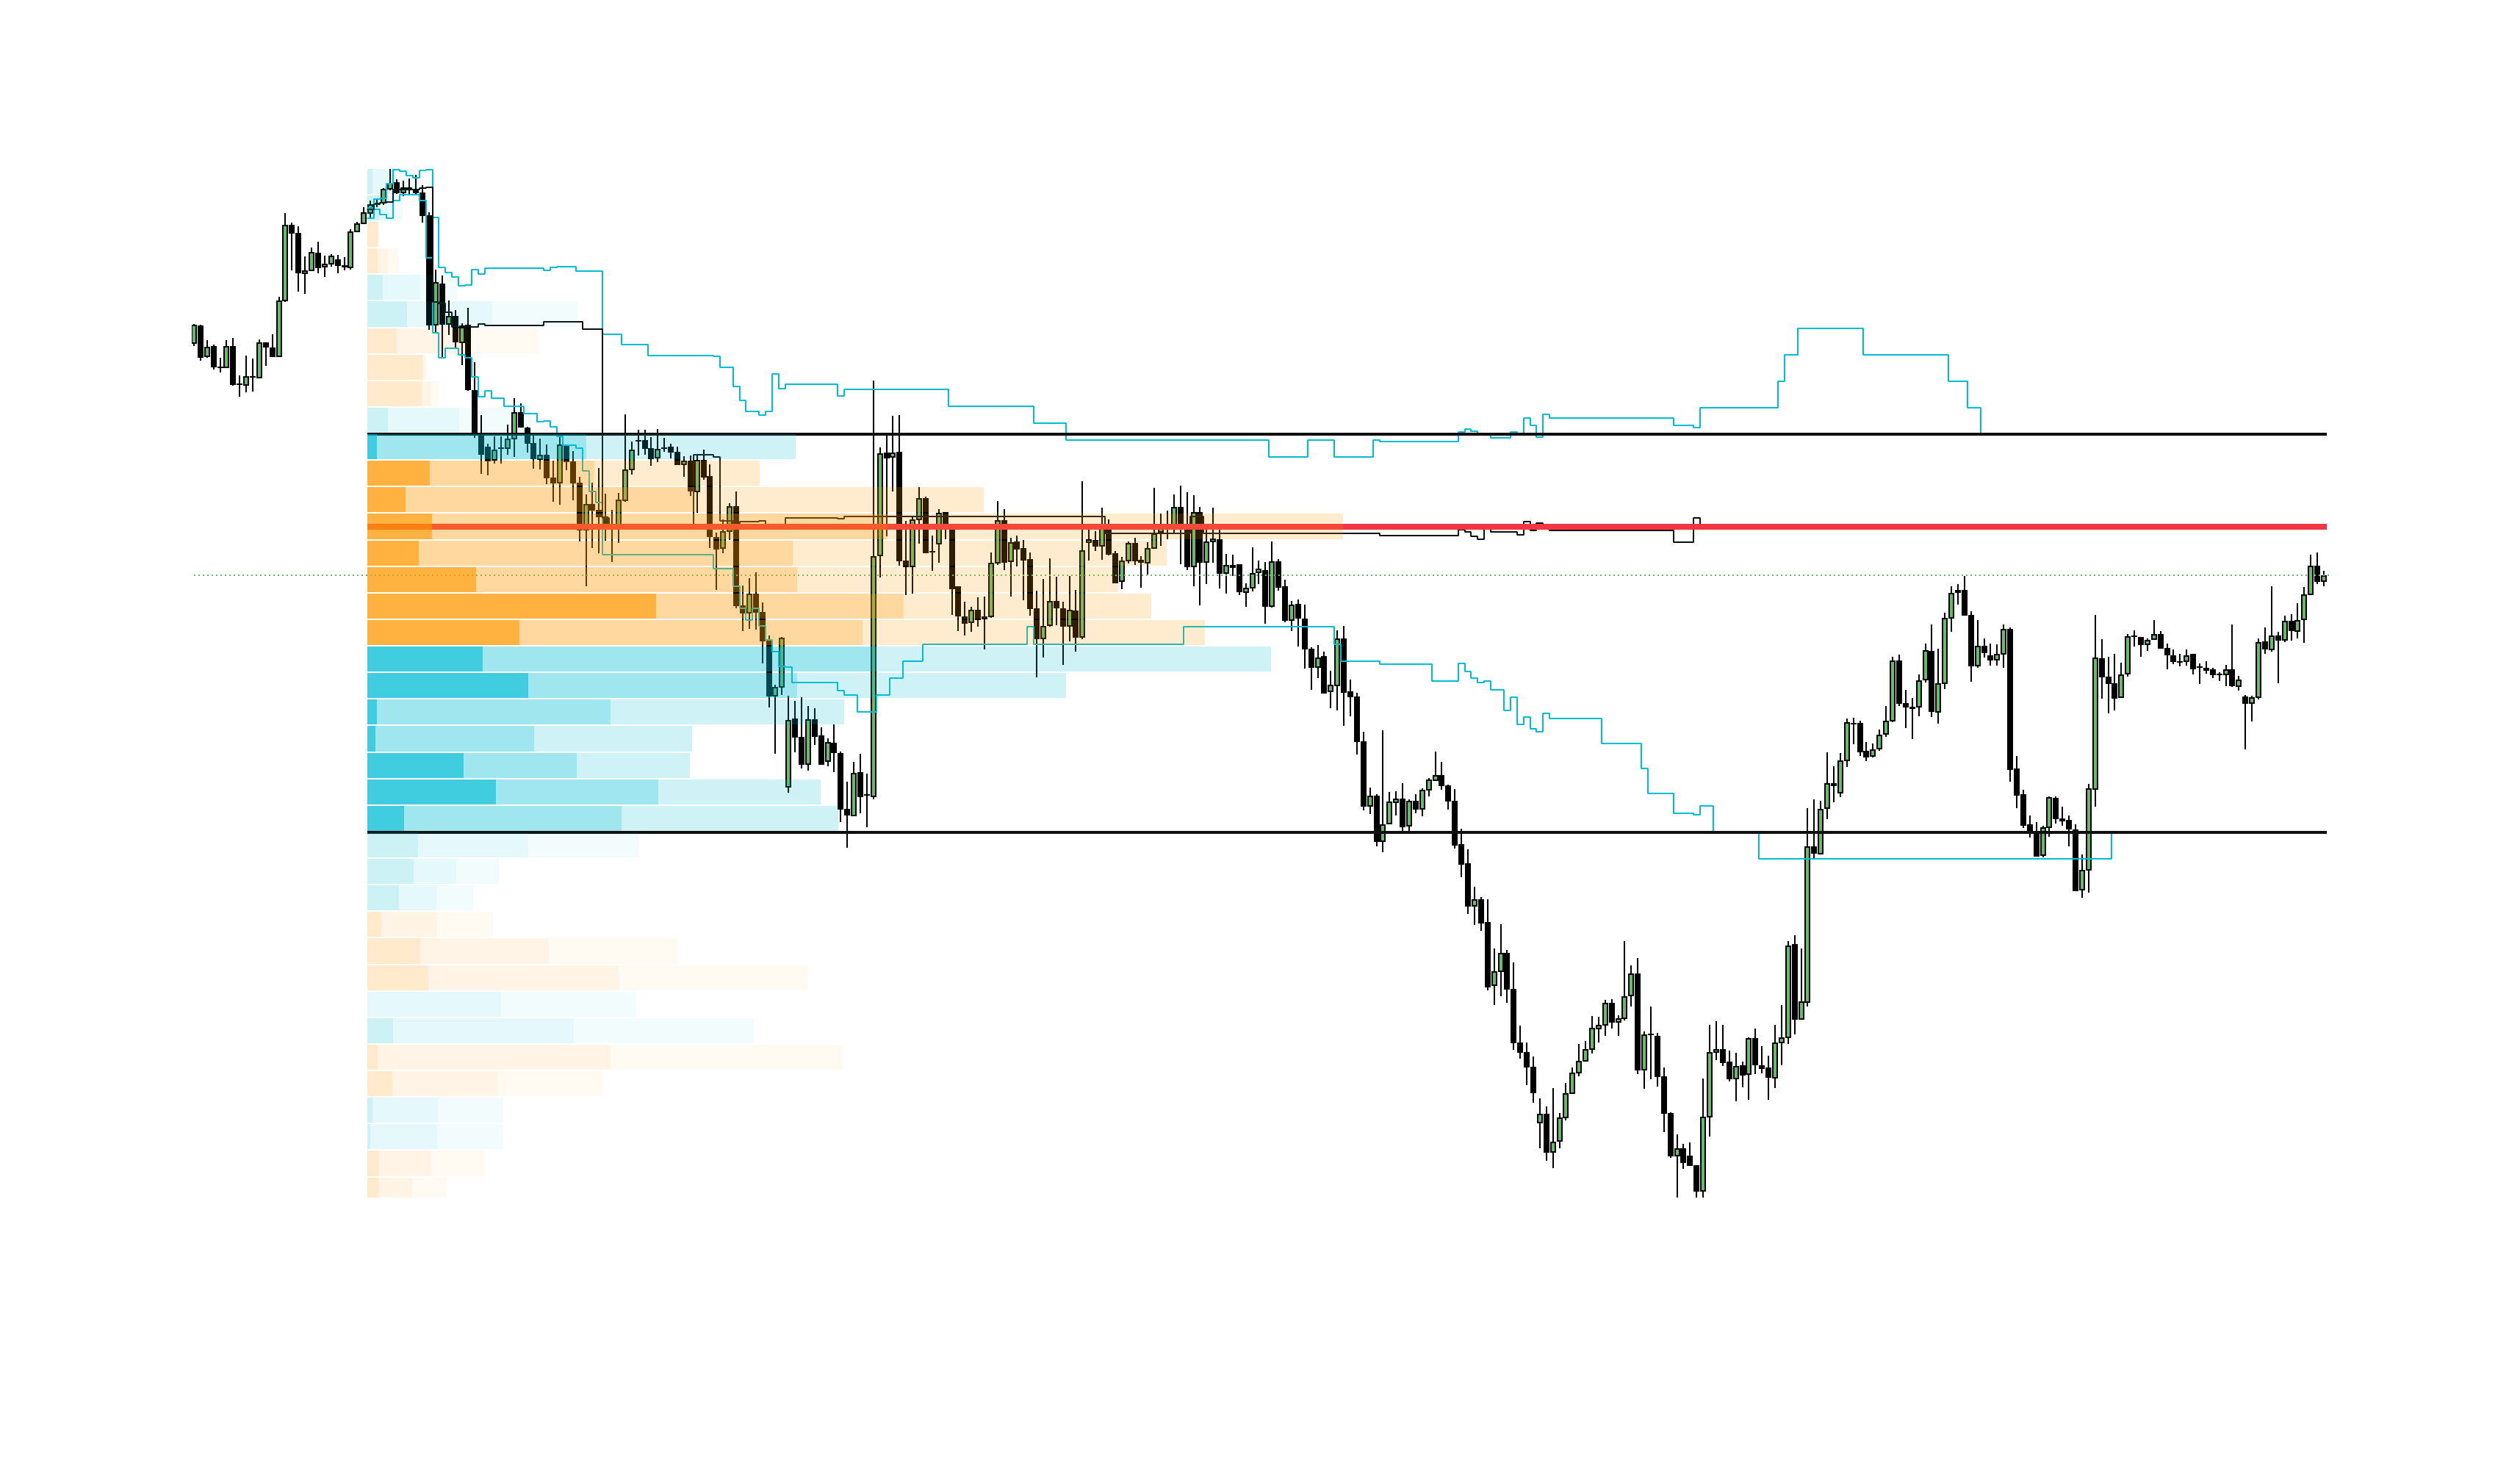
Developing POC & Developing Value Area
Tracking the real-time migration of the developing POC provides dynamic insight into directional conviction.
Developing POC & Value Area
6. Strategic Execution Models
Strategy 1: Value Area Mean Reversion
In a range-bound market, observe price testing VAH or VAL. Look for rejection at the edge and target the POC as the primary profit objective.
Strategy 2: Value Area Breakout
When price breaks outside the Value Area and sustains acceptance, trade in the direction of the breakout toward the next historical nPOC or LVN target.
Strategy 3: Volume Gap Acceleration
Identify higher-timeframe Low Volume Nodes (LVNs). When price enters an LVN "air pocket," anticipate accelerated price action toward the next High Volume Node (HVN).
Absorption vs. Aggression
- Absorption: High volume traded at an HVN without price advancement, signaling passive limit orders absorbing aggressive market orders.
- Aggression: Price effortlessly slicing through an HVN, indicating overwhelming directional market order volume.
7. Market-Specific Application
- Crypto Markets: Highly reactive to liquidation cascades; volume profiles frequently feature thin LVN gaps where forced liquidations trigger fast moves.
- Equity Futures (ES/NQ): Strongly influenced by Initial Balance extensions and institutional closing rotations.
Summary Checklist
- Identify the POC to locate the market's primary liquidity magnet.
- Utilize Value Areas to differentiate between balanced consolidation and trending imbalance.
- Treat Low Volume Nodes (LVNs) as zones of rapid price movement and volatility.
- Combine Volume Profile with VWAP and market structure for maximum institutional alignment.