
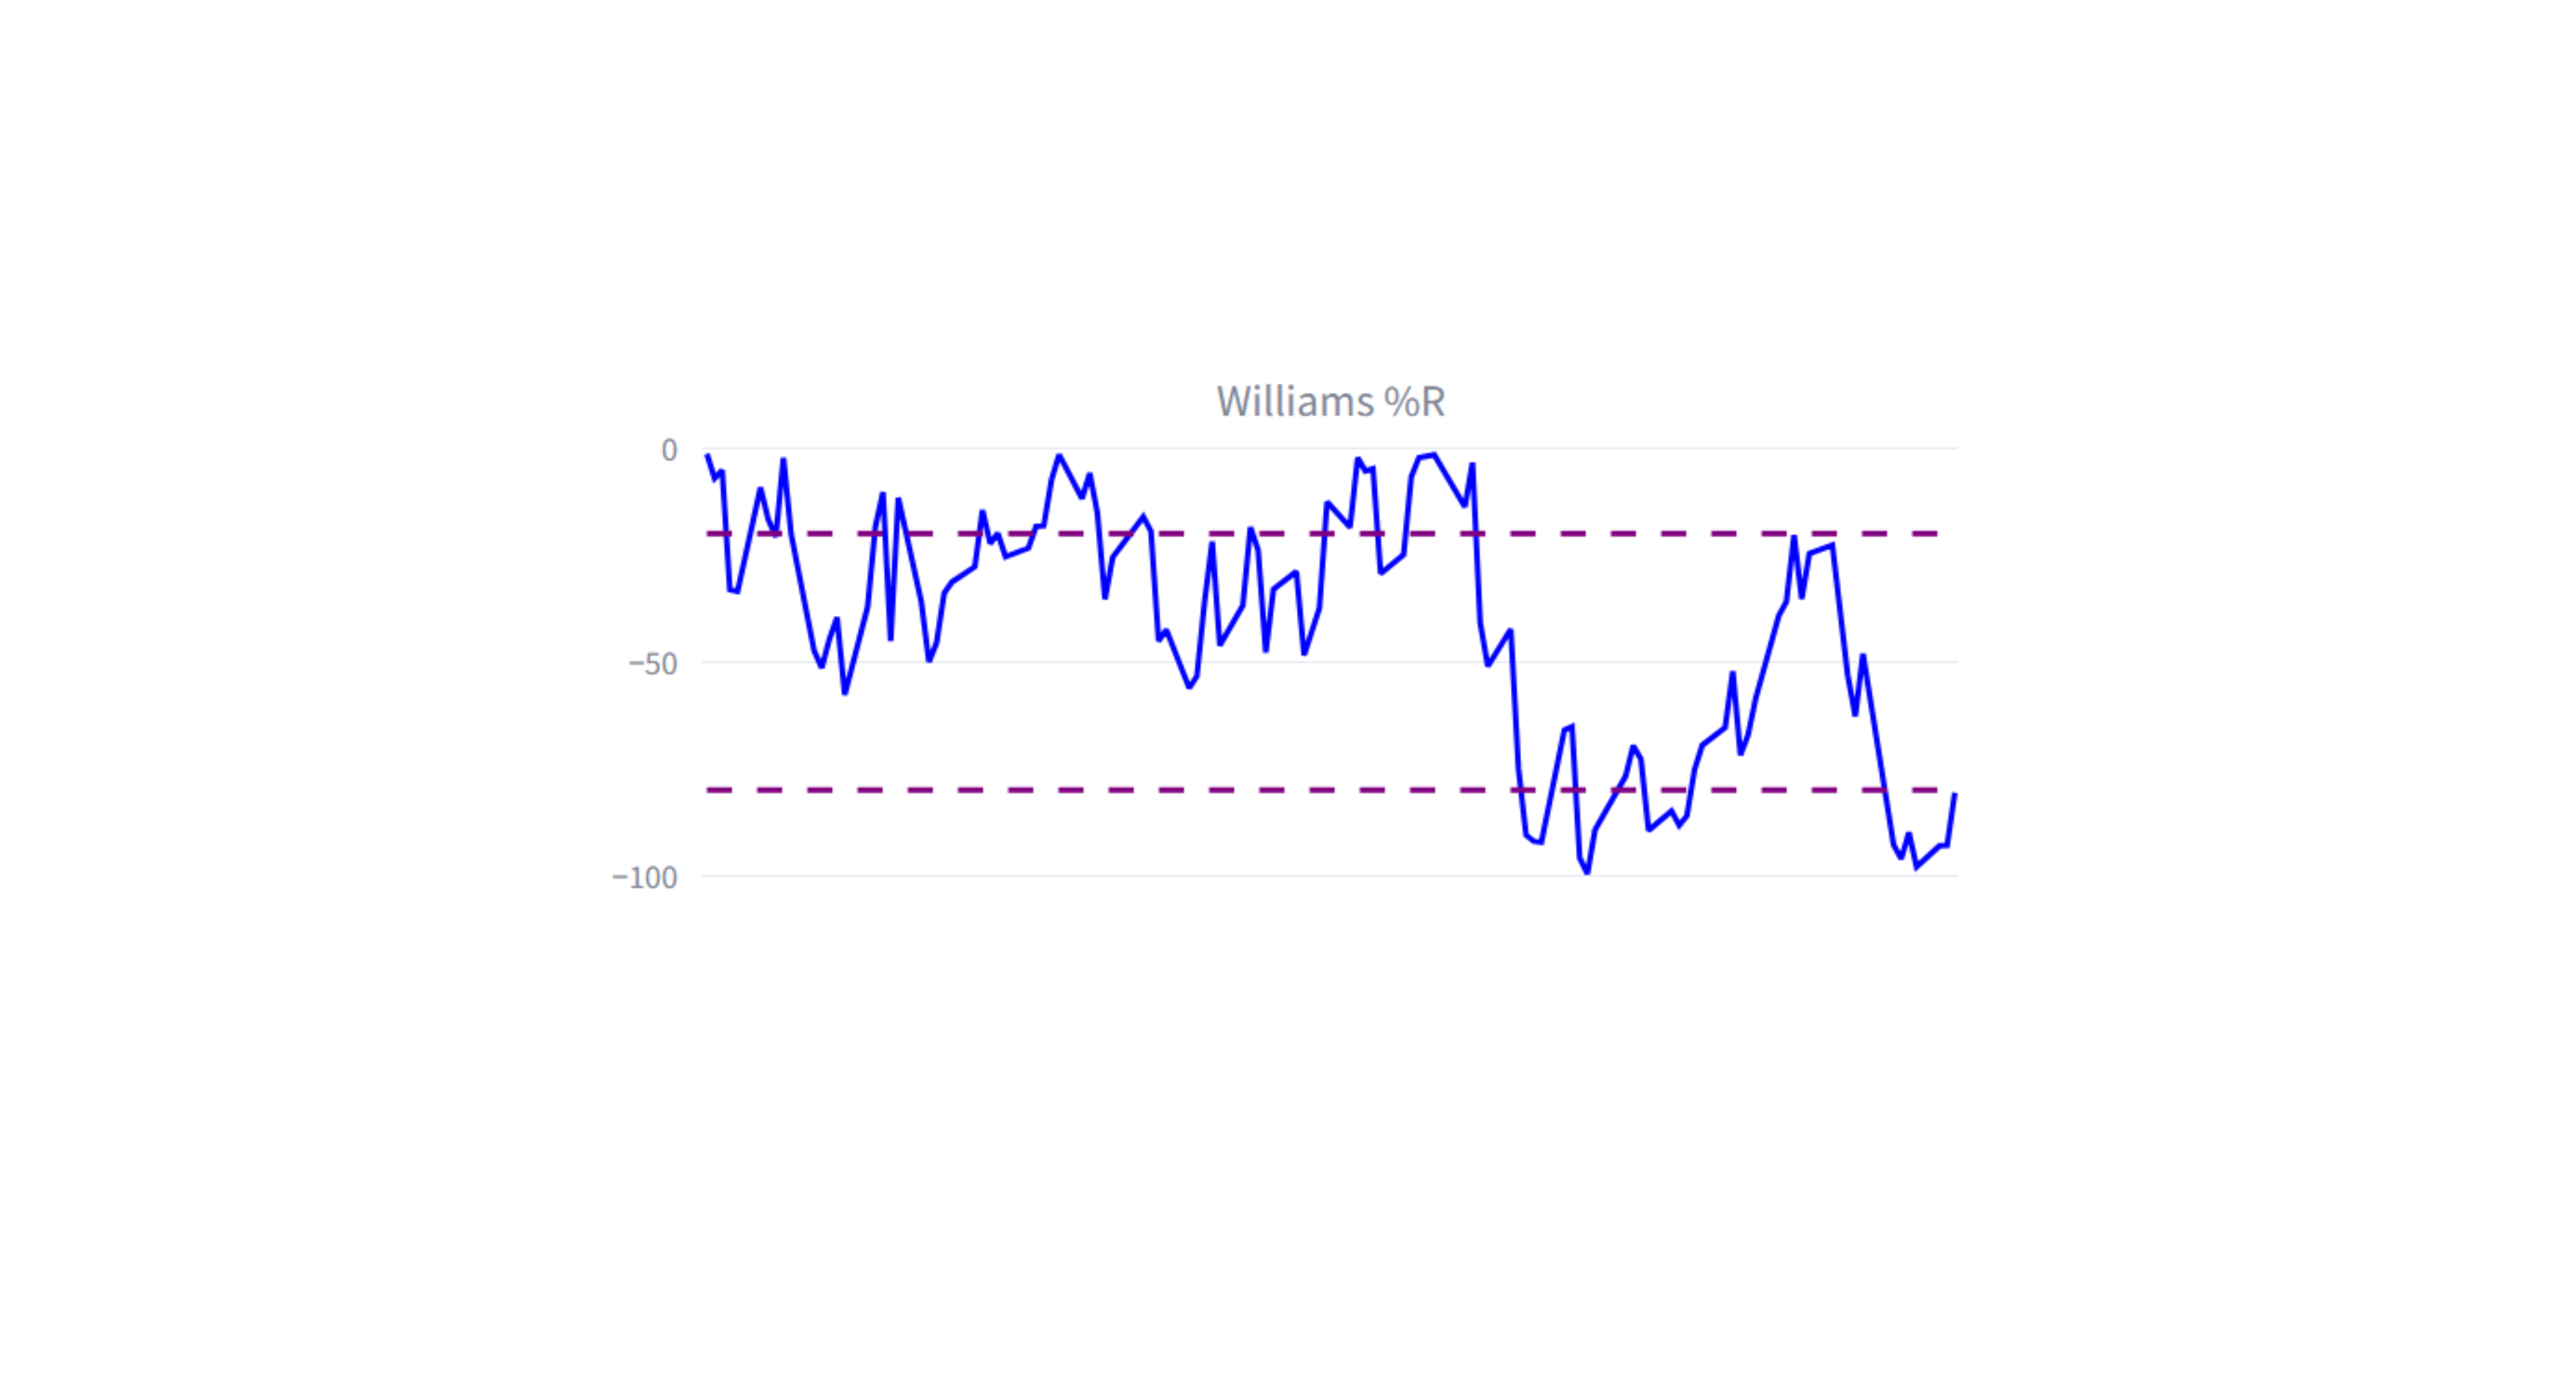
The Williams %R (or Williams Percent Range) is a fast, highly sensitive momentum oscillator engineered for short-term and swing trading strategies. It delivers early warning signals of overbought and oversold conditions by comparing the current closing price to the high-low range over a defined lookback period (typically 14 bars).
Williams %R Overview
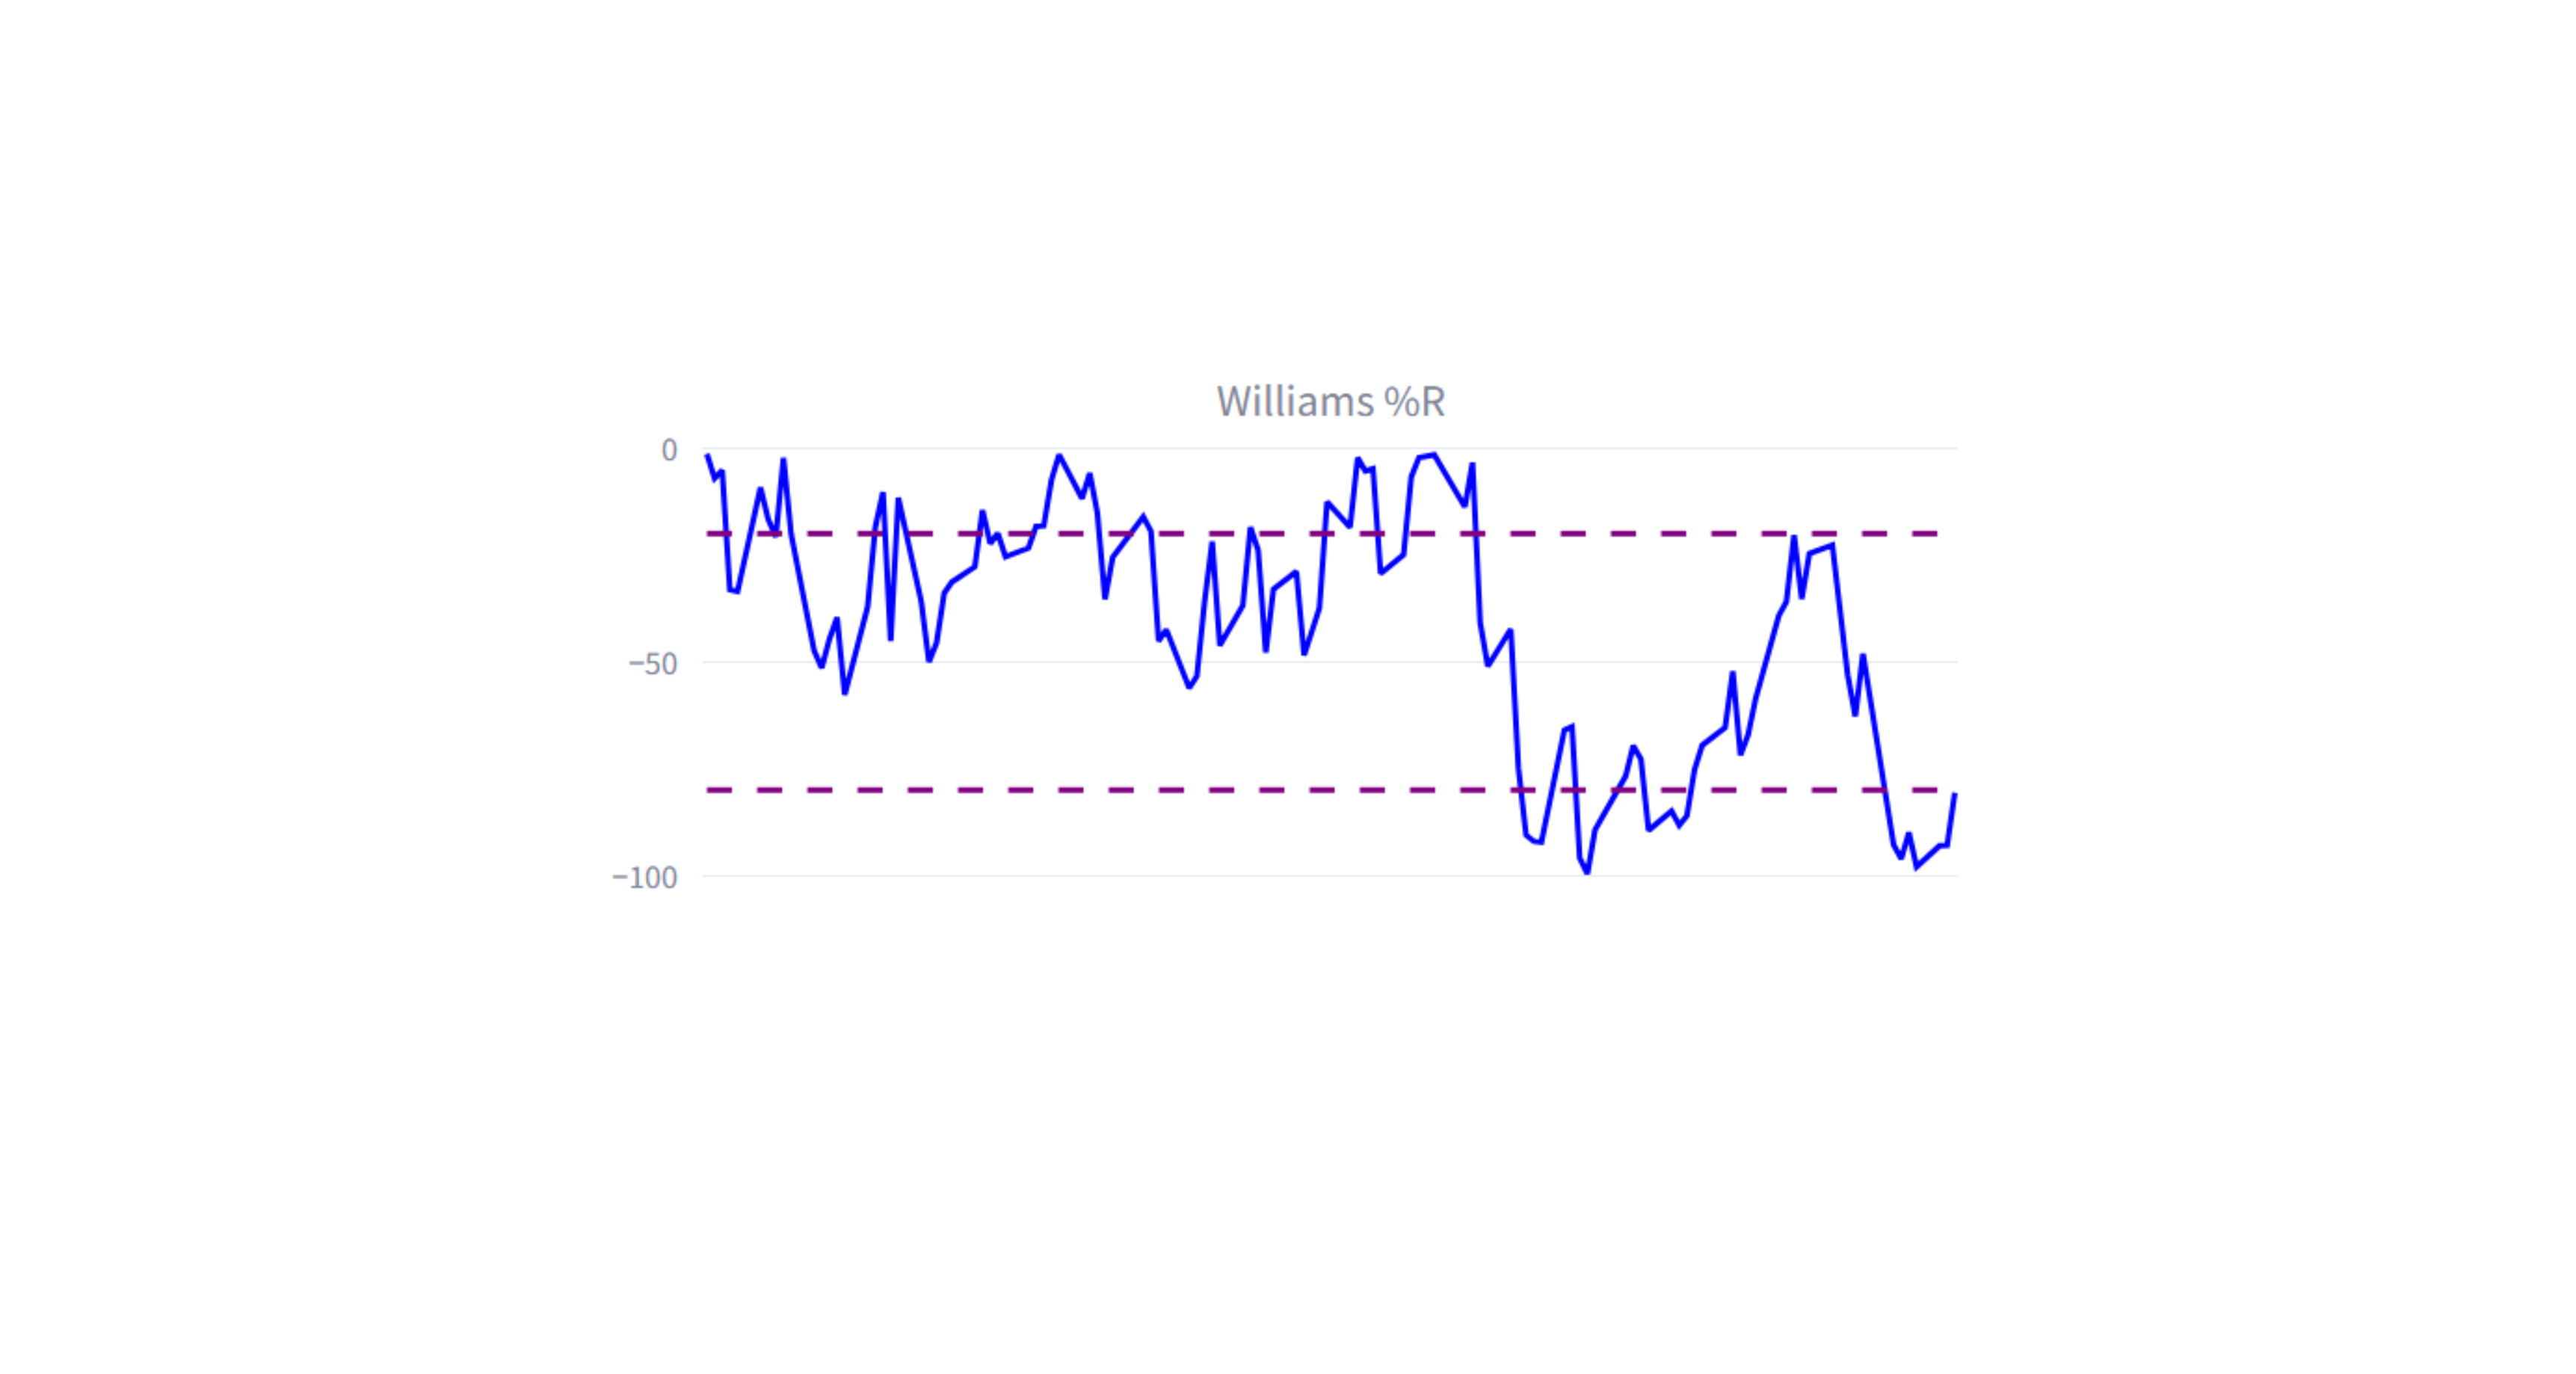
By understanding how Williams %R operates relative to other momentum indicators, traders can seamlessly incorporate it into a context-aware, robust trading system.
1. What Are Momentum Indicators?
Momentum indicators quantify the velocity and structural strength of price movements over time. Instead of focusing strictly on trend direction, momentum metrics evaluate how rapidly prices fluctuate, helping traders anticipate potential market turning points, trend continuations, and extreme overbought or oversold states.
These tools are particularly effective during range-bound or consolidating markets, where shifts in momentum frequently precede price breakouts or sharp reversals.
Core Characteristics of Momentum Indicators
- Bounded Ranges: Oscillators operate within fixed boundaries (e.g., 0 to 100 or 0 to -100).
- Leading Signals: Designed to provide early warning alerts prior to lagging trend indicators.
- Divergence Detection: Highlighting discrepancies between price action and momentum to signal trend exhaustion.
2. Understanding the Williams %R Indicator
The Origin: Developed by Larry Williams
The Williams %R indicator was created in the late 1970s by legendary trader and author Larry Williams. He designed the tool to measure price location within its recent high-low envelope, identifying high-probability turning points in futures markets.
Williams %R Mechanics
Larry Williams famously showcased the power of this indicator during the 1987 World Cup Championship of Futures Trading, turning a $10,000 capital base into over $1,100,000 in twelve months—proving its practical real-world application.
Mathematical Formula Breakdown
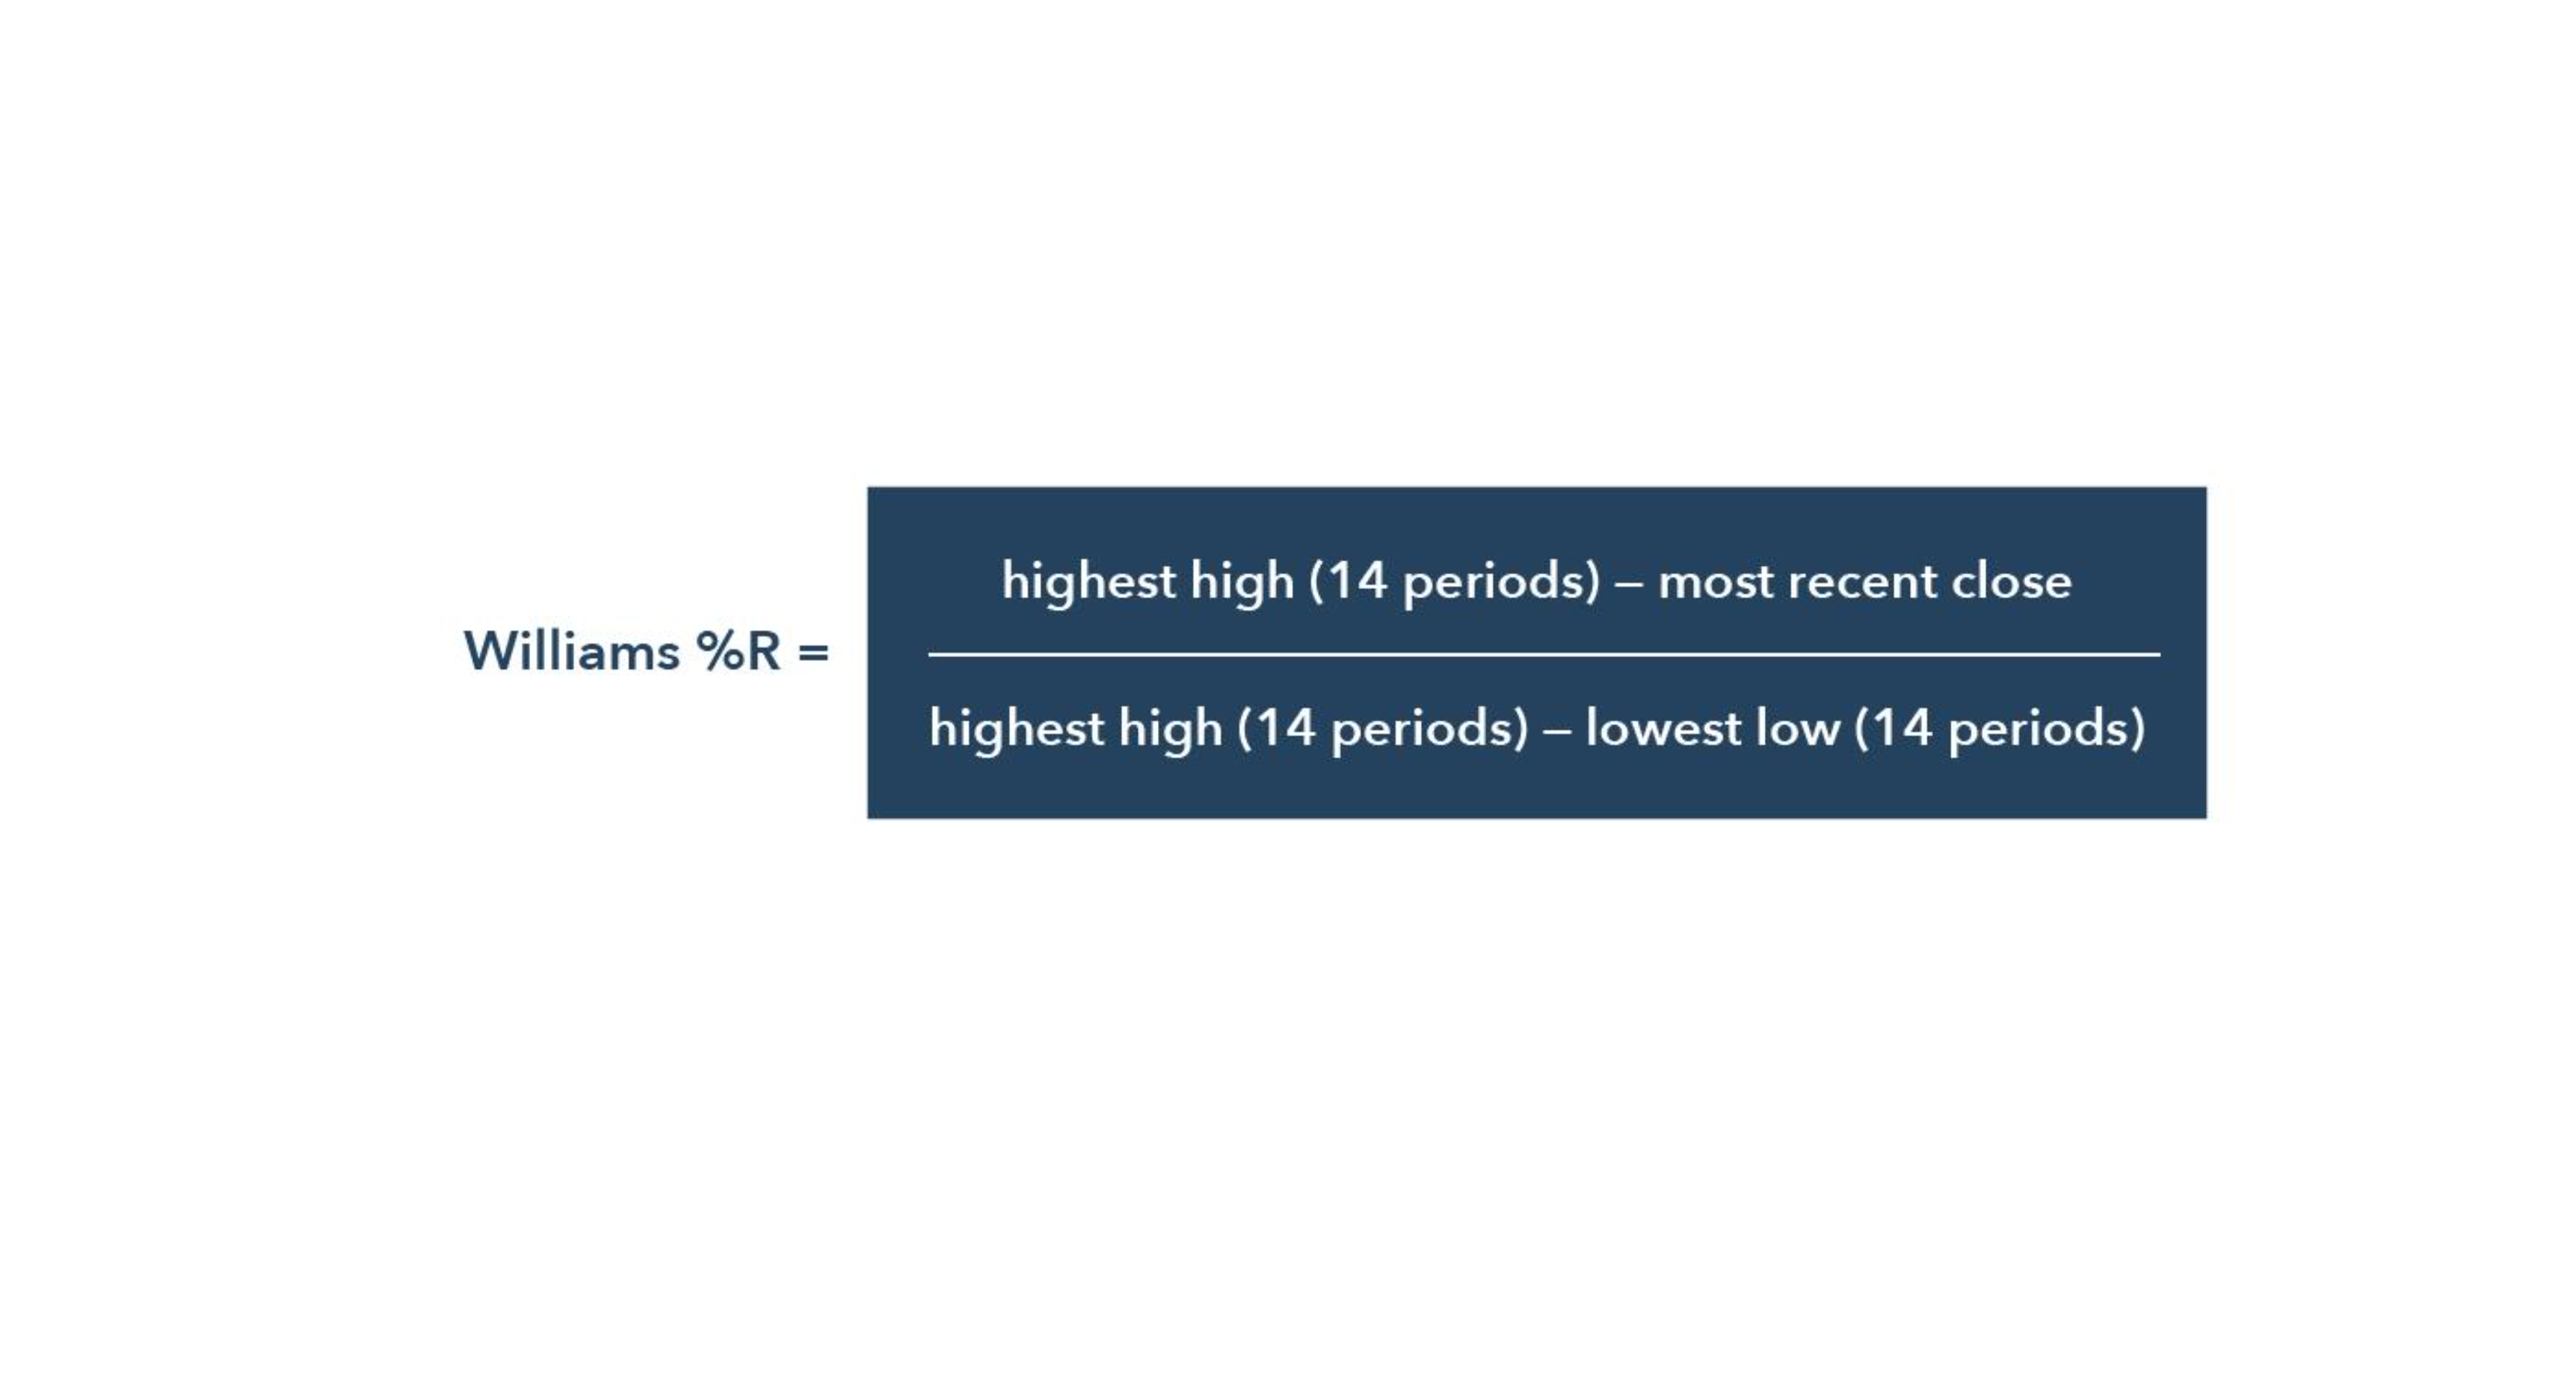
The Williams %R formula normalizes current price relative to recent range extremes:
Williams %R = (Highest High - Close) / (Highest High - Lowest Low) * -100
Where:
- Highest High: The maximum price recorded across the lookback period (default: 14 bars).
- Lowest Low: The minimum price recorded across the lookback period.
- Close: The current bar's closing price.
This formula expresses price location as a negative percentage ranging from 0 to -100:
- Price at Range High: $%R = 0$ (maximum overbought)
- Price at Range Low: $%R = -100$ (maximum oversold)
Unlike the Relative Strength Index (RSI), which scales from 0 to 100, Williams %R uses an inverted negative scale to emphasize proximity to recent highs.
Pine Script Example
//@version=5
indicator("Custom Williams %R", overlay=false)

length = input.int(14, title="Period")
highestHigh = ta.highest(high, length)
lowestLow = ta.lowest(low, length)

williamsR = (highestHigh - close) / (highestHigh - lowestLow) * -100
plot(williamsR, title="%R", color=color.purple)

hline(-20, "Overbought", color=color.red)
hline(-80, "Oversold", color=color.green)
Period Settings & Customization
While Larry Williams established 14 periods as the benchmark default, lookback settings can be tailored based on timeframe and trading style:
- Intraday Scalping (5-min to 15-min charts): Use 9 to 14 periods for fast, highly responsive signals.
- Swing Trading (1-hour to Daily charts): Standard 14 to 21 periods provide an optimal balance between signal speed and reliability.
- Position Trading (Weekly charts): Use 21+ periods to filter noise and focus on major cyclical reversals.
Pro Tip: Combining a fast %R (e.g., 9) with a slow %R (e.g., 28) allows traders to track immediate momentum shifts within larger trend cycles.
Interpreting Overbought and Oversold Zones
- Overbought (%R above -20): Price is trading near the upper extreme of its recent range, indicating potential upward exhaustion or pullback.
- Oversold (%R below -80): Price is trading near the lower extreme of its recent range, suggesting selling exhaustion or potential bounce.
Important: Overbought does not mean immediate sell, nor does oversold mean immediate buy. Extreme readings reflect strong momentum and can persist during powerful trends. Always seek price action confirmation before executing.
3. Practical Strategy Execution
Overbought & Oversold Reversal Setup
Identifying turning points as price reaches range extremes:
Reversal Signals
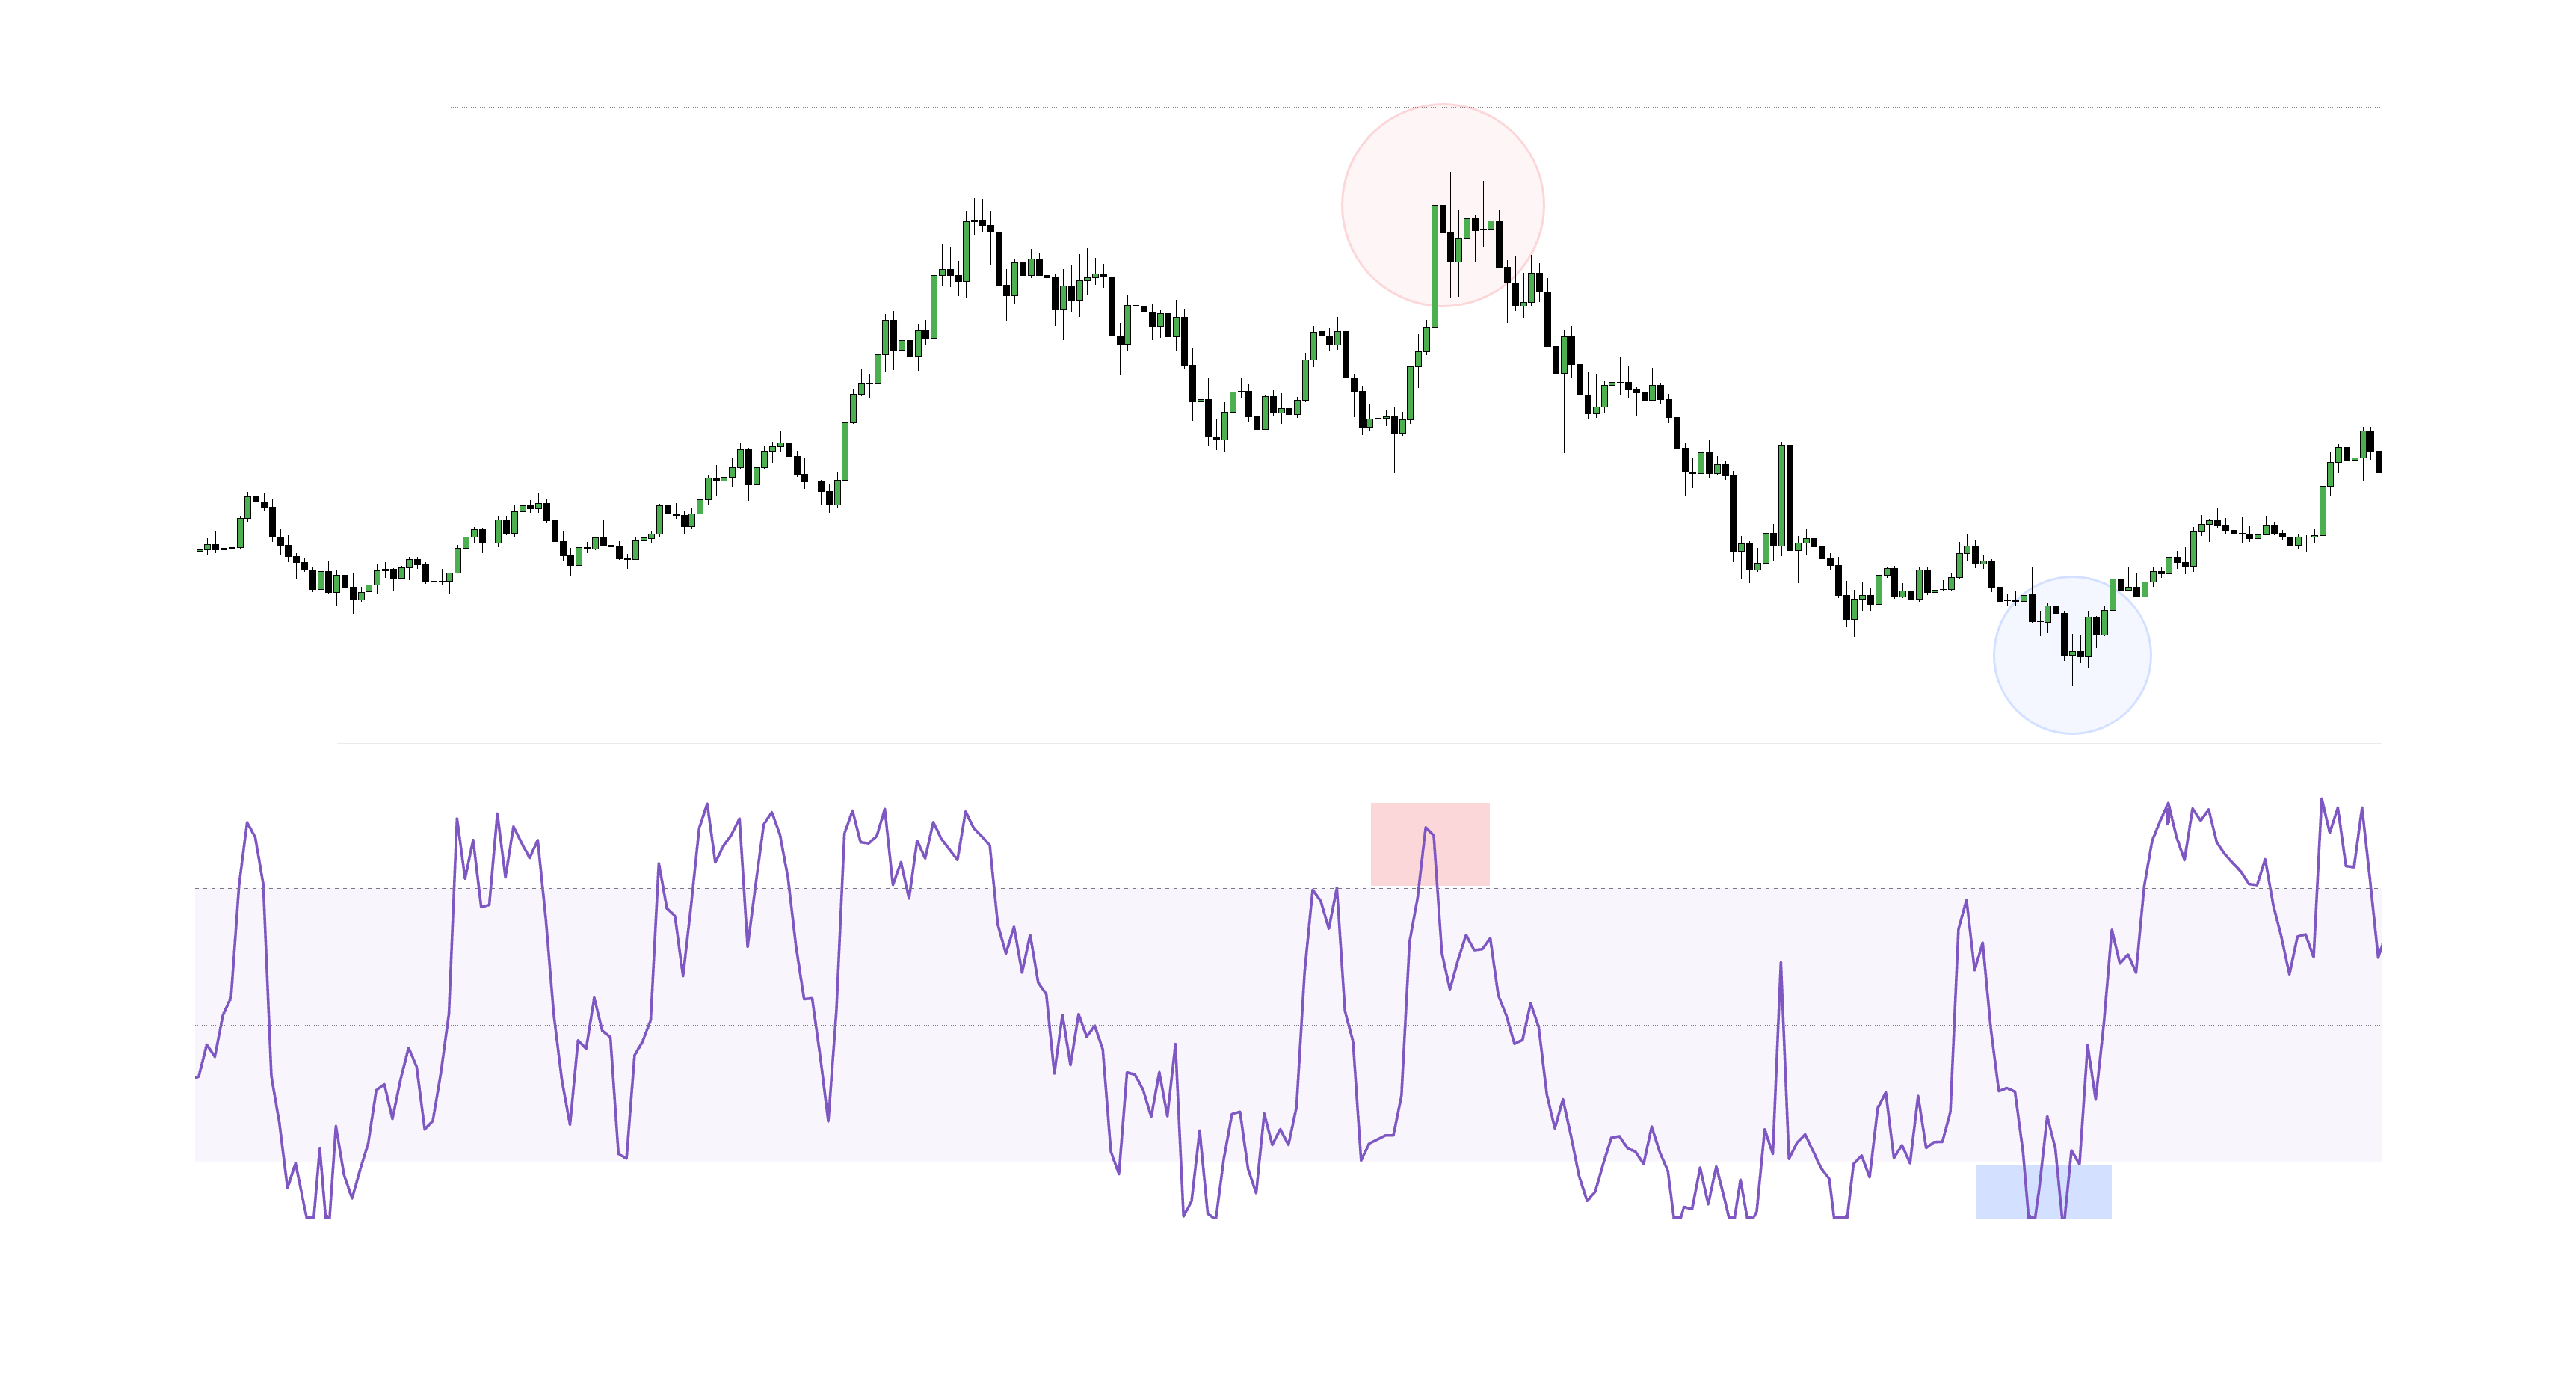
- Bearish Reversal: Wait for %R to enter the overbought zone (above -20) at key resistance. Entry is confirmed when %R crosses back down below -20.
- Bullish Reversal: Wait for %R to drop into the oversold zone (below -80) at key support. Entry is confirmed when %R crosses back up above -80.
Trend Pullback Continuation Setup
Using Williams %R to enter established trends on temporary pullbacks:
Pullback Continuations
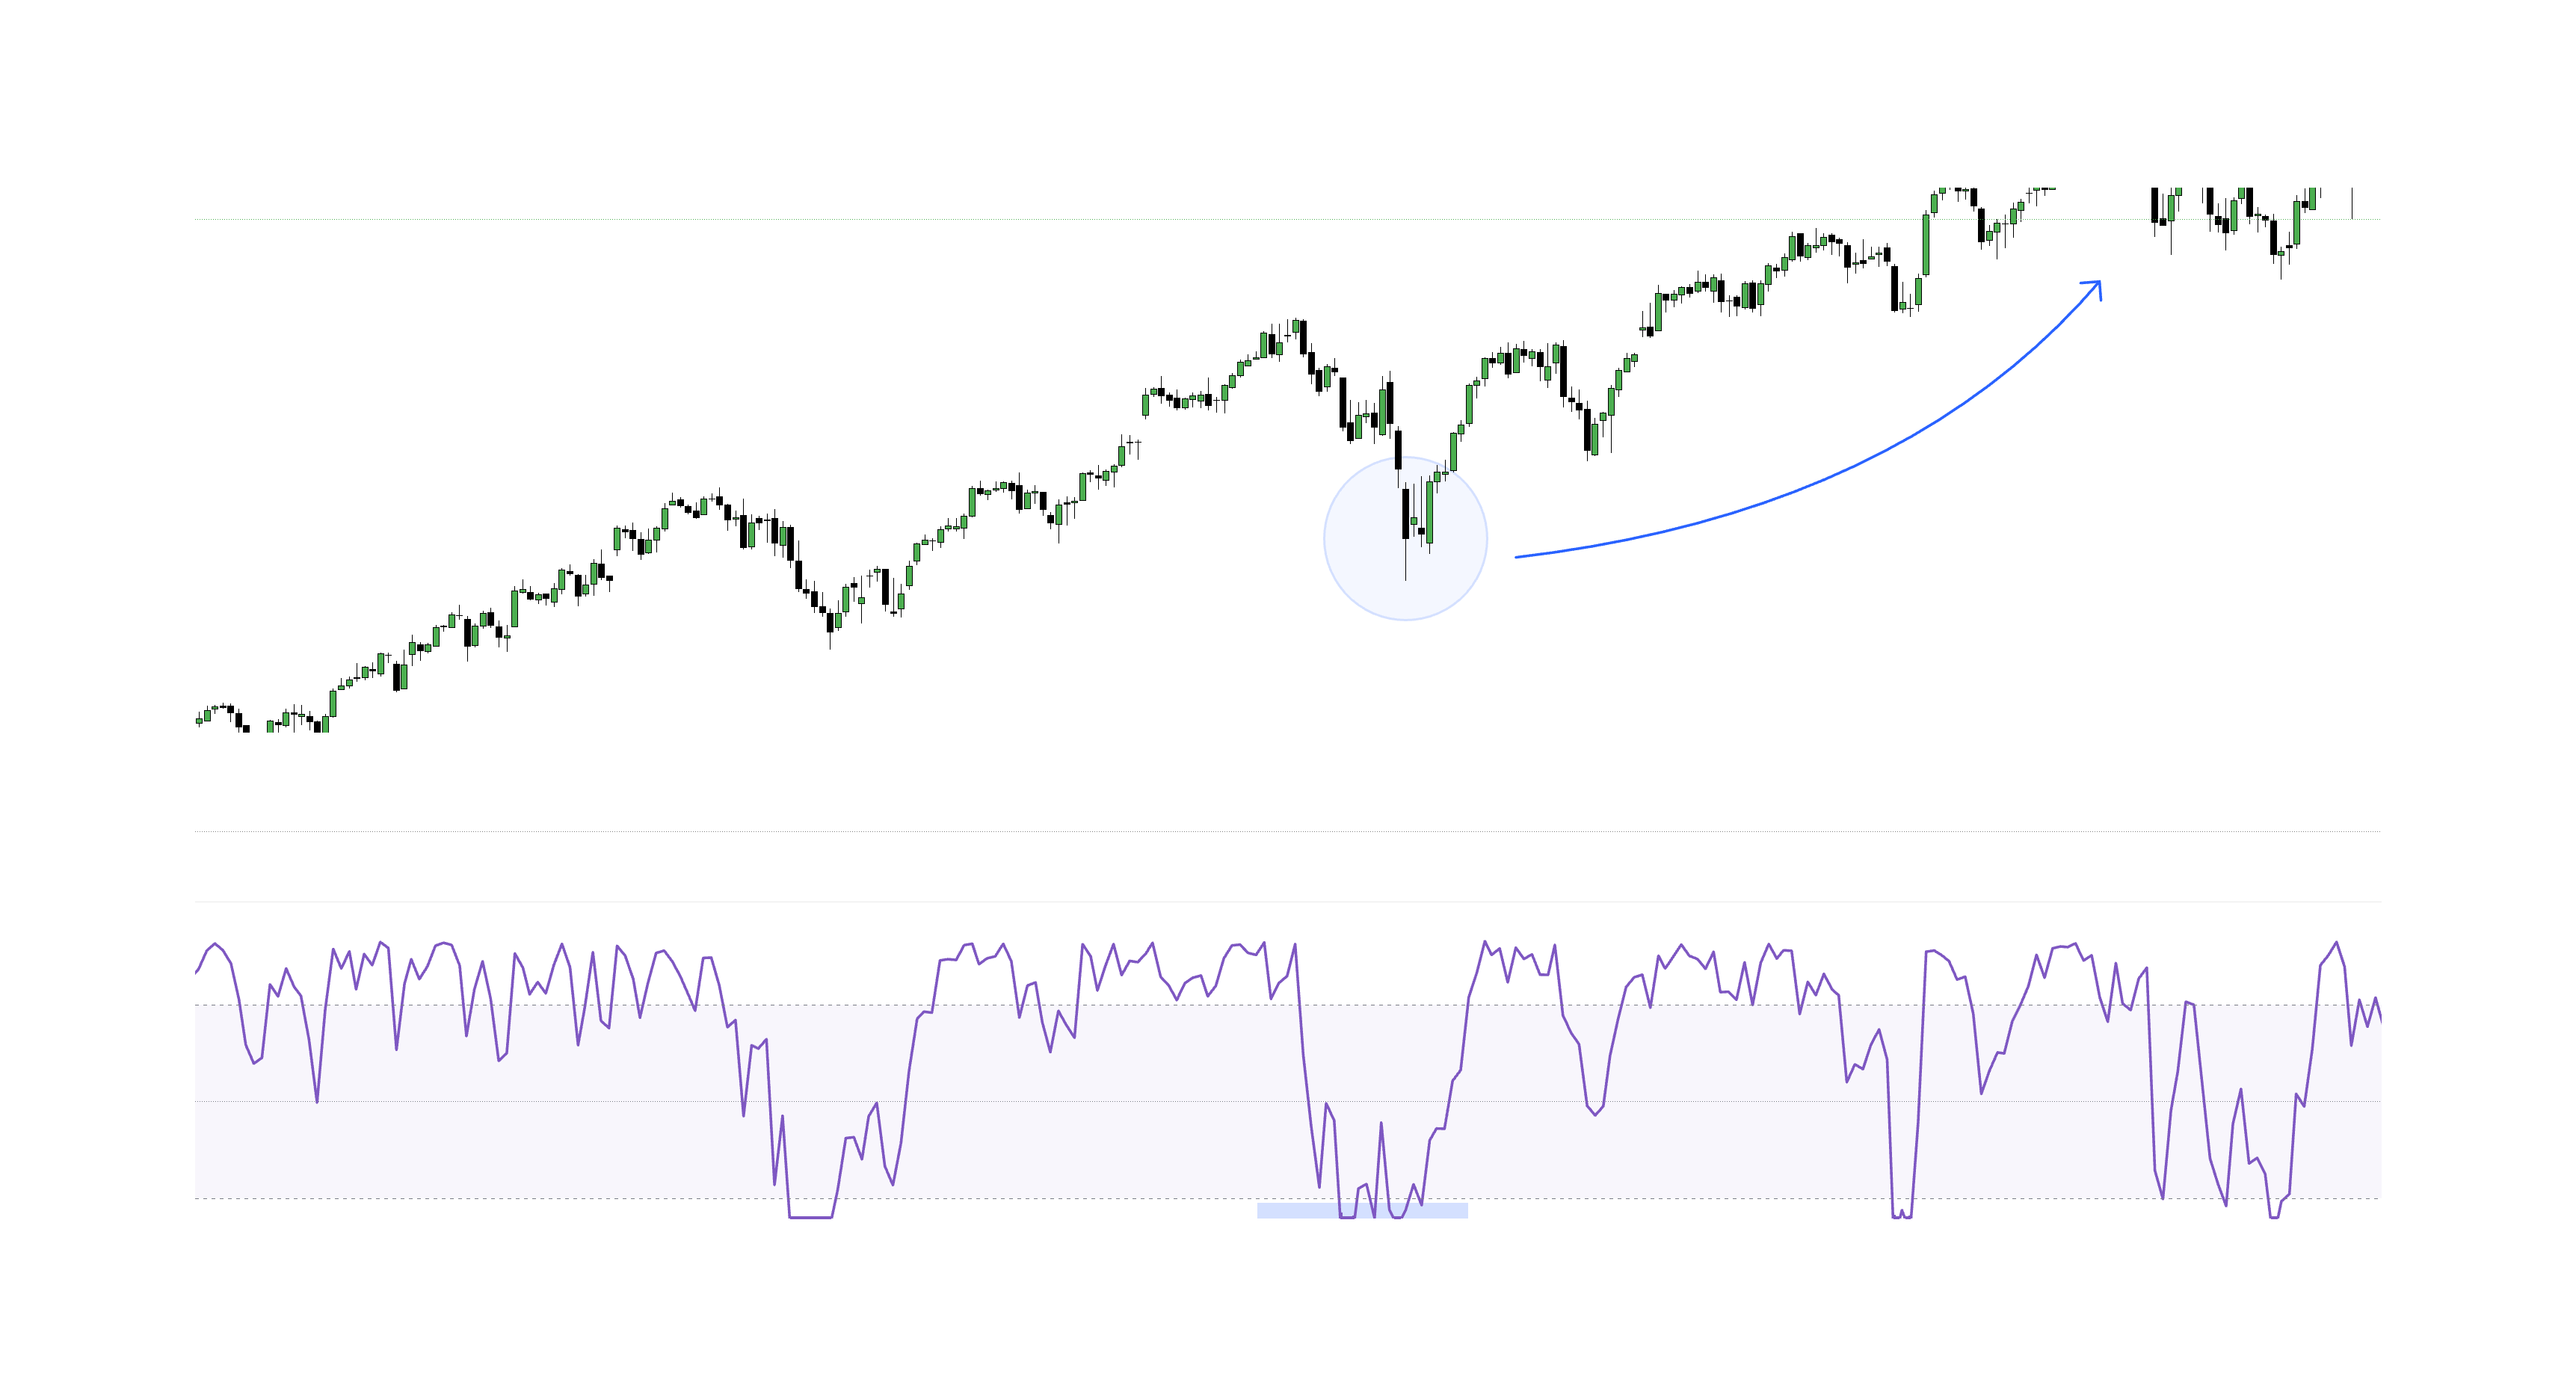
- Uptrend Buy Setup: In an established uptrend, wait for %R to temporarily drop below -80 (short-term oversold dip), then buy as %R recovers back above -80.
- Downtrend Sell Setup: In an established downtrend, wait for %R to rally above -20 (short-term overbought bounce), then short as %R falls back below -20.
Exit Signals & Trade Management
- Midpoint Crossings (-50 Level): When %R crosses the -50 neutral level, momentum is decelerating, signaling an ideal zone to lock in partial profits.
- Extreme Recovers: Crossing back through -20 or -80 threshold levels provides early exit alerts before full trend reversals occur.
False Signal Filtering
- Trend Filters: Pair %R with a 50-period or 200-period Exponential Moving Average (EMA) to take only trades aligned with the higher-timeframe trend.
- Price Action Patterns: Confirm indicator signals with engulfing candles, pin bars, or structural breaks.
- Volume Confirmation: Ensure volume expands in the direction of the confirmed momentum shift.
Market Environment Context
Ranging vs Trending Markets
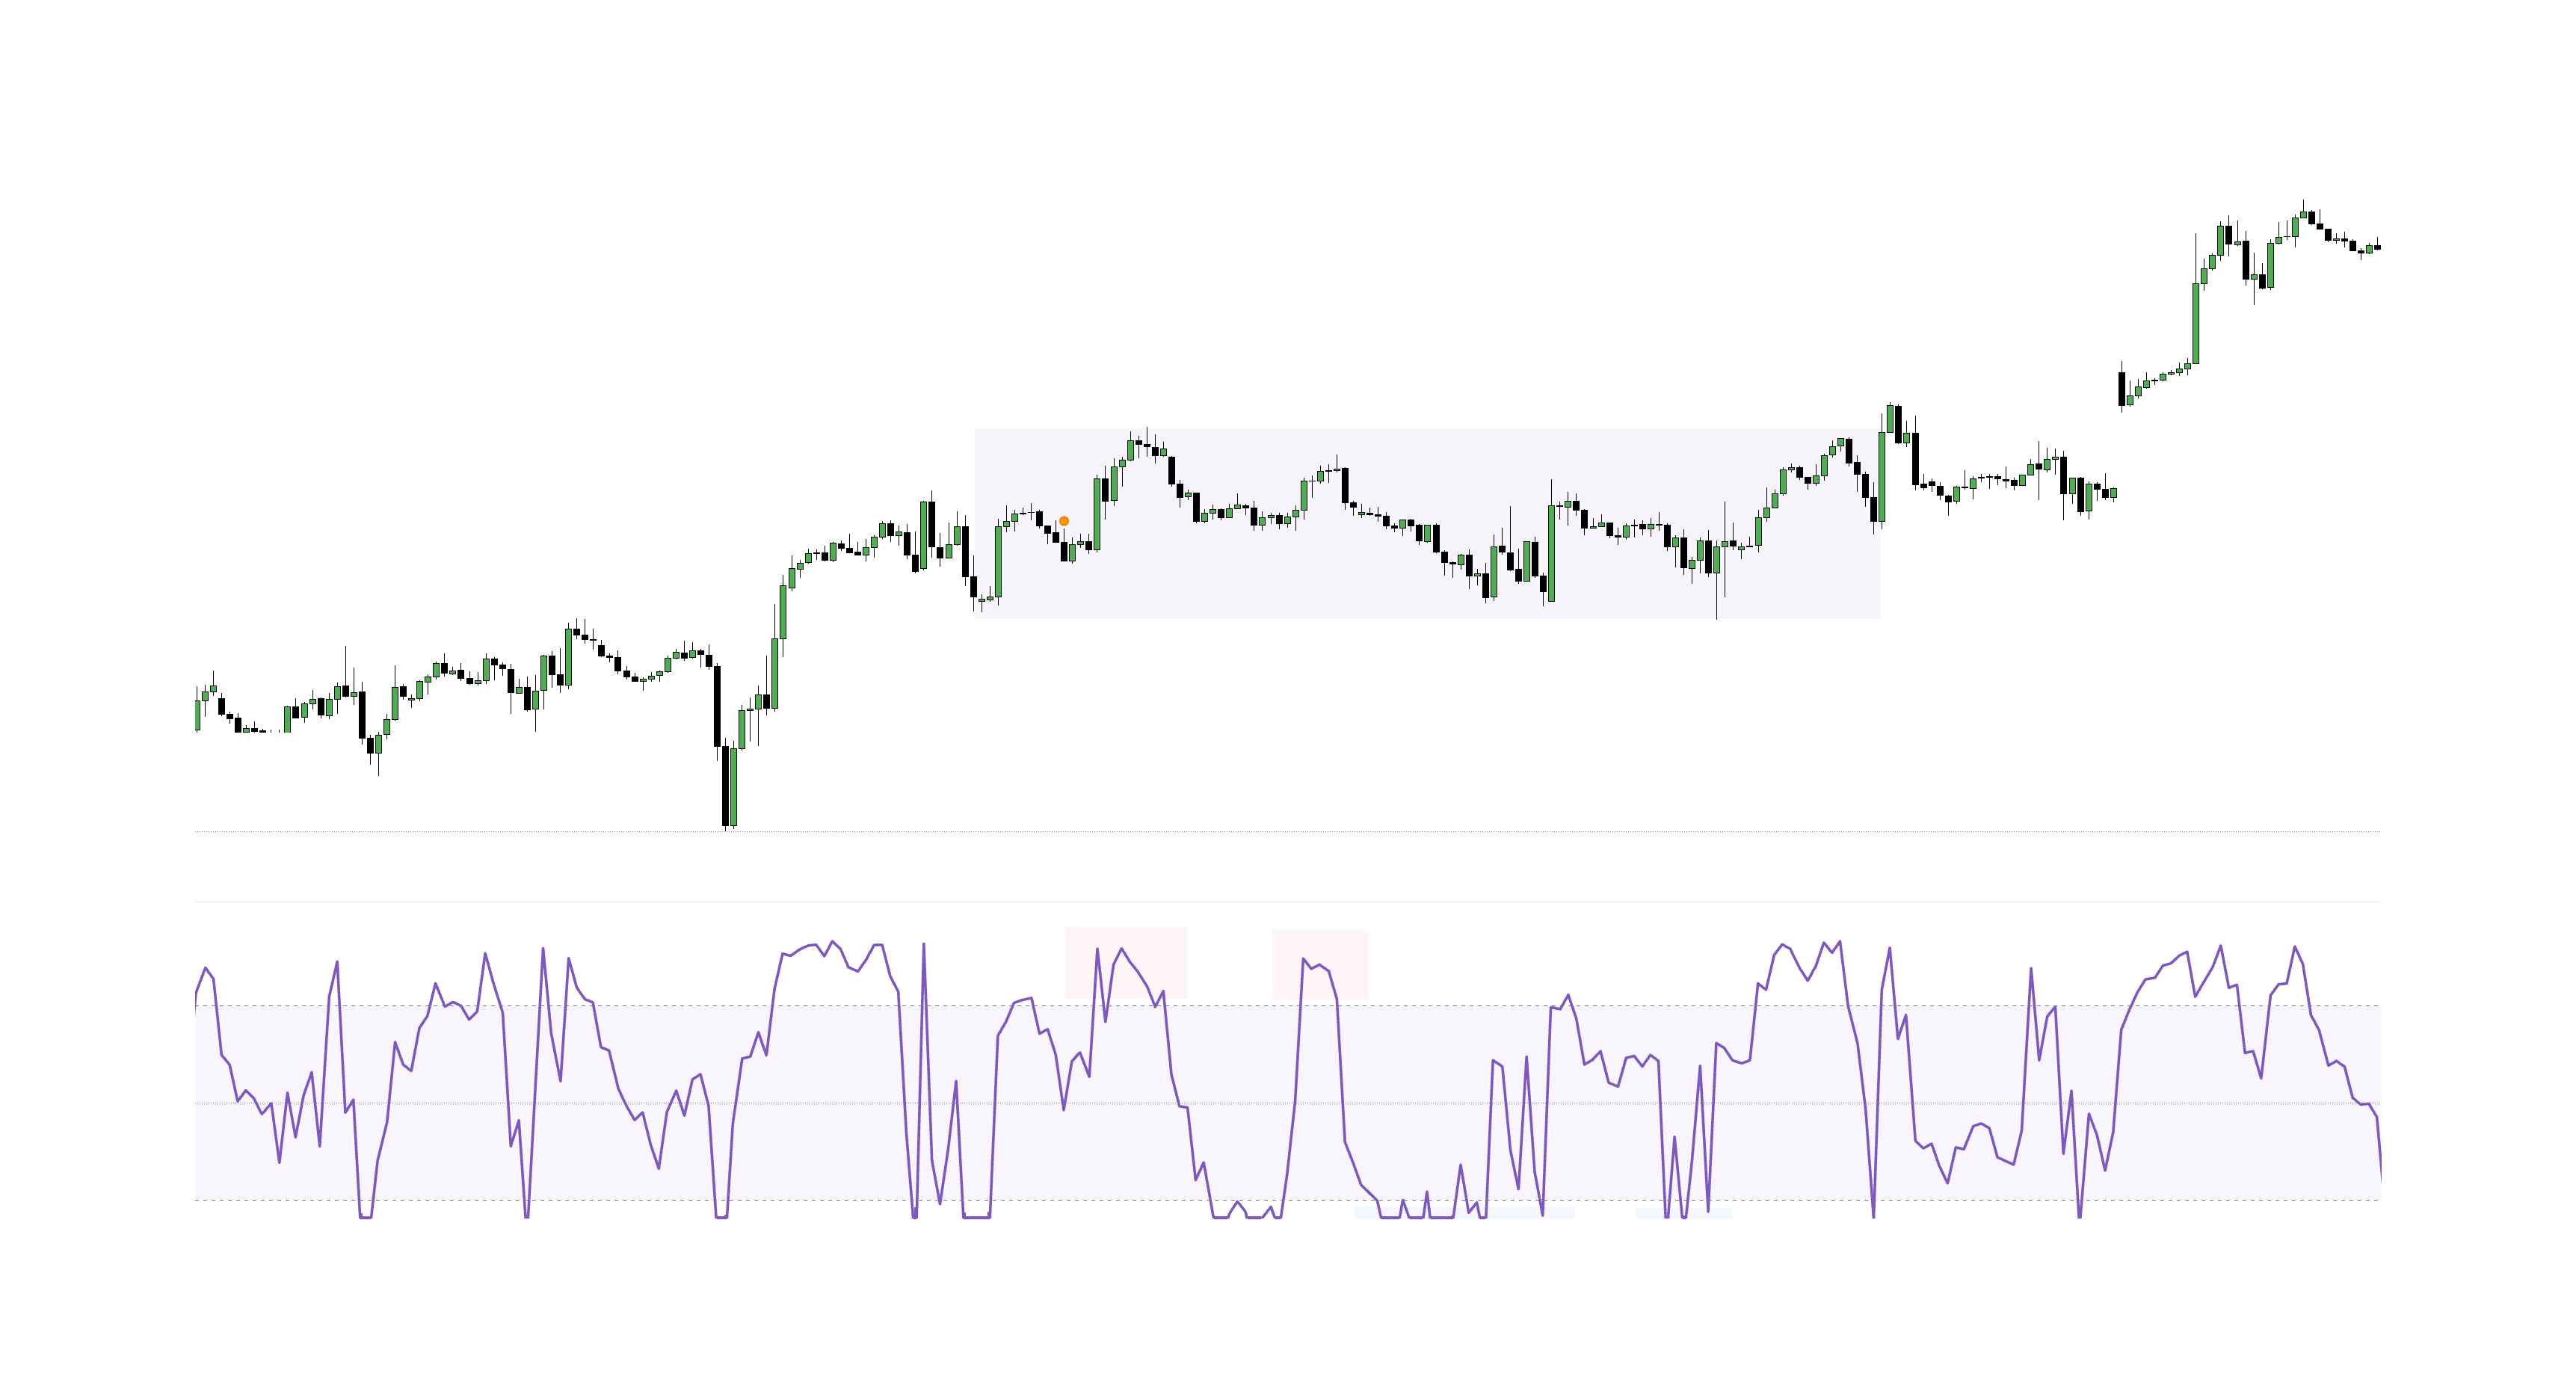
- Ranging Markets: Ideal environment. Price oscillates cleanly between support and resistance, making -20 and -80 boundaries extremely reliable.
- Strongly Trending Markets: Use with caution. %R can remain pegged in overbought or oversold territory during powerful trends; focus exclusively on pullback setups.
Summary Checklist
- Williams %R measures closing price relative to the 14-period high-low range on a 0 to -100 scale.
- Readings above -20 indicate overbought conditions; readings below -80 indicate oversold conditions.
- Standard 14-period setting balances sensitivity and stability for swing trading.
- Highly effective in ranging markets, while requiring trend filters in strong directional moves.
- Always pair Williams %R signals with support/resistance zones, volume confirmation, and price action patterns.