Logo

Pro Algorithms

The complete CandelaCharts algorithm suite, laid out chapter by chapter. Every in-house model with its charts and the features that drive it.
Algorithms
  • 01Breadth3
  • 02Macro7
  • 03Regime8
  • 04Ratios6
24 pro algorithms — the full in-house suite in one place.
01

Breadth

How much of the market is actually moving with the index — participation, sector spread and the risk that comes with a narrow tape.
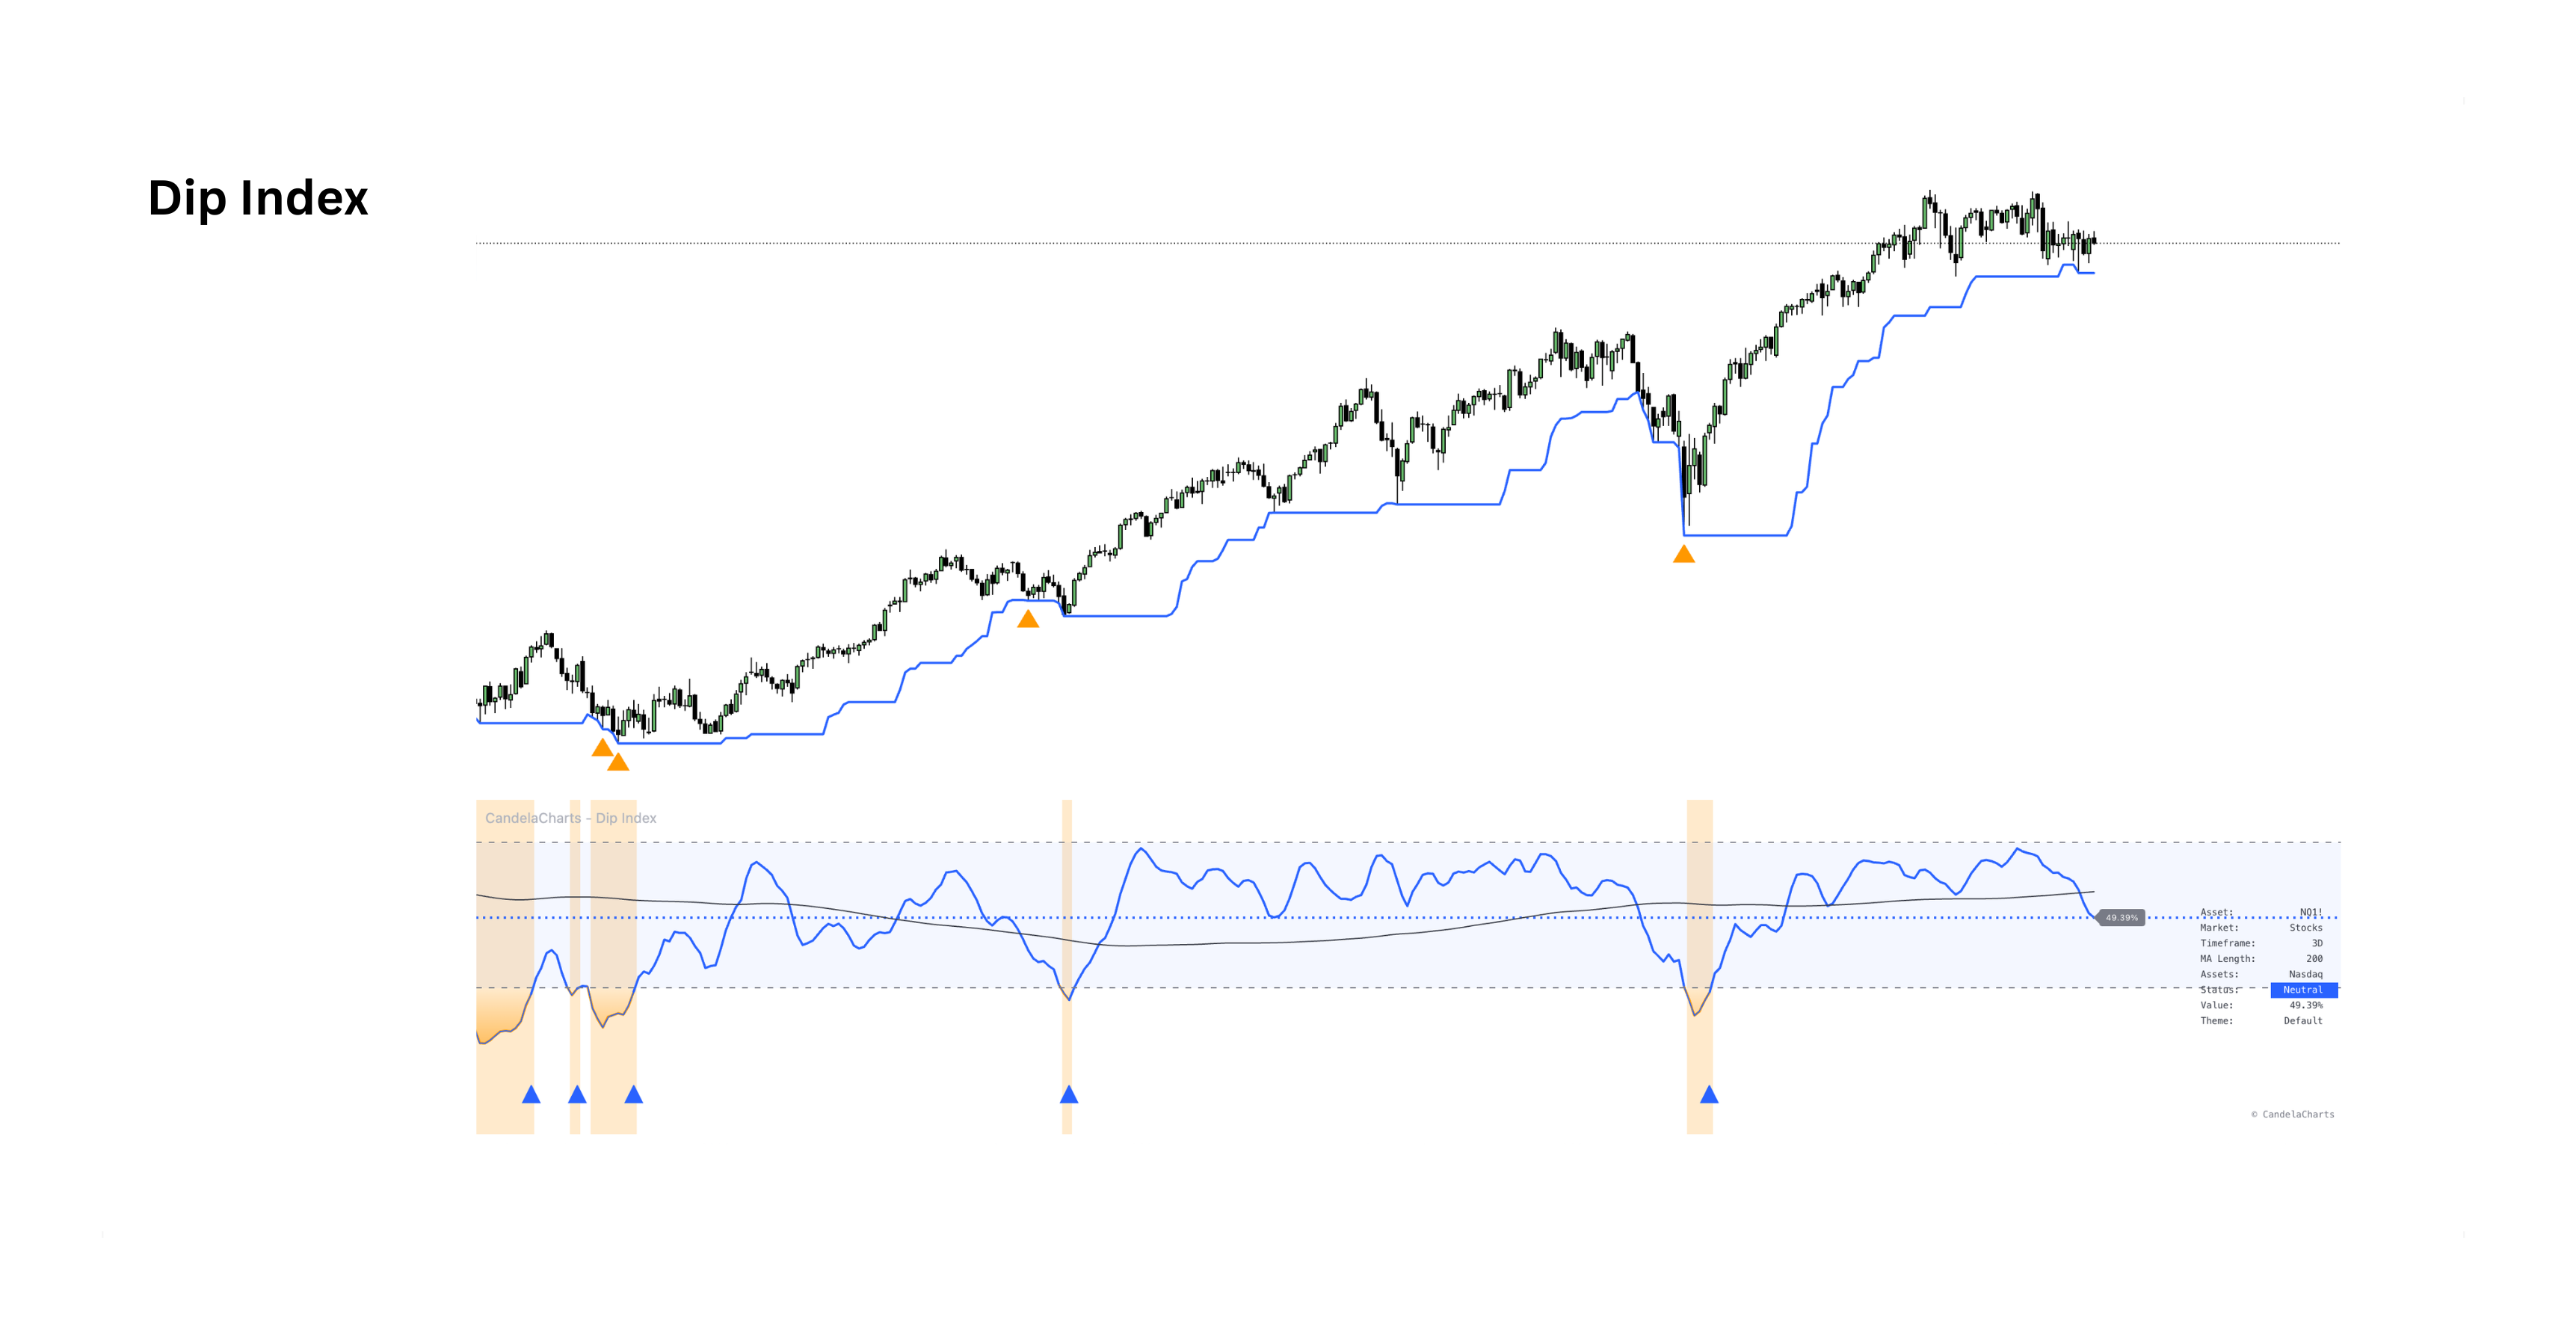
Dip Index preview

Dip Index

Market breadthView indicator
A market breadth oscillator that tracks the percentage of assets in a chosen index trading above a selected moving average — spotting broad pullbacks, measuring participation and judging whether moves are broadly supported.
Breadth ScaleA 0–100% reading of how many constituents trade above their average.
Index BasketsSupports S&P 500, Nasdaq, DJI, Russell and sector indices.
OB/OS ZonesOverbought/oversold bands with signals when breadth exits extremes.
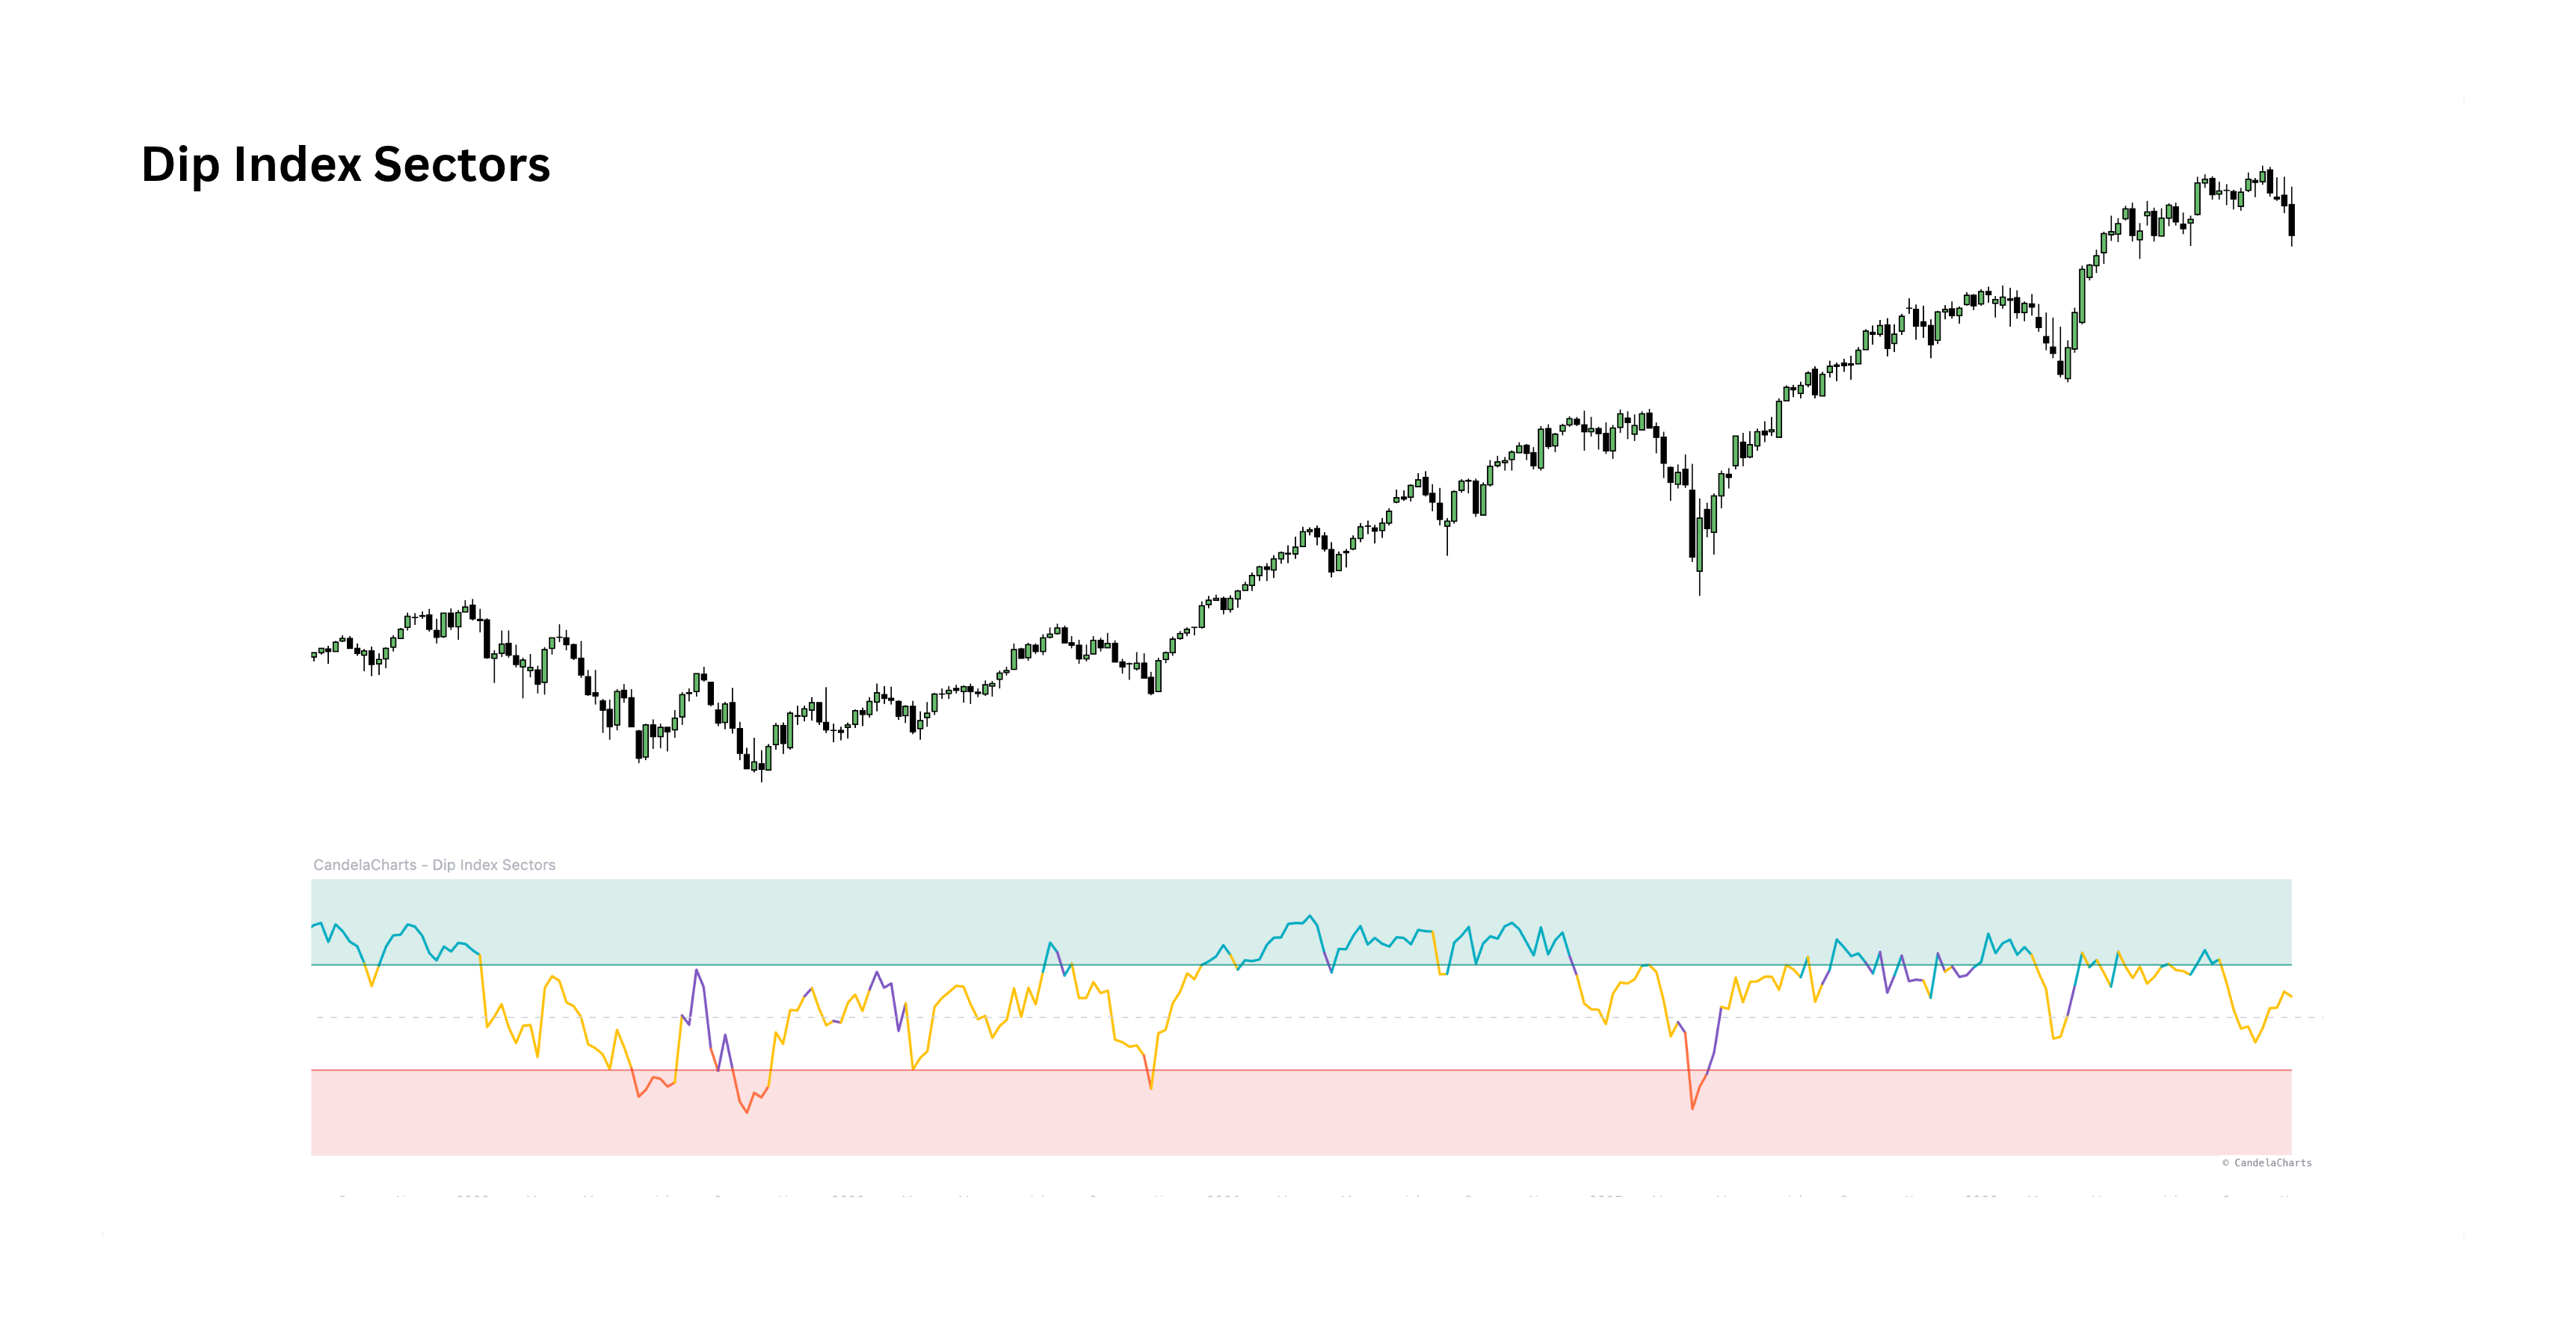
Dip Index Sectors preview

Dip Index Sectors

Sector breadthView indicator
The Dip Index applied across the eleven S&P sector ETFs — a rotation map of how many sectors are participating in a move, and which ones are carrying it.
Signed BreadthTrend distance and participation measured across all eleven sectors.
Broad vs NarrowClassifies a move as broad, narrow, mixed or insufficient.
Rotation ReadThe panel names the top lead and worst lag in relative return.
Composite Risk Index preview

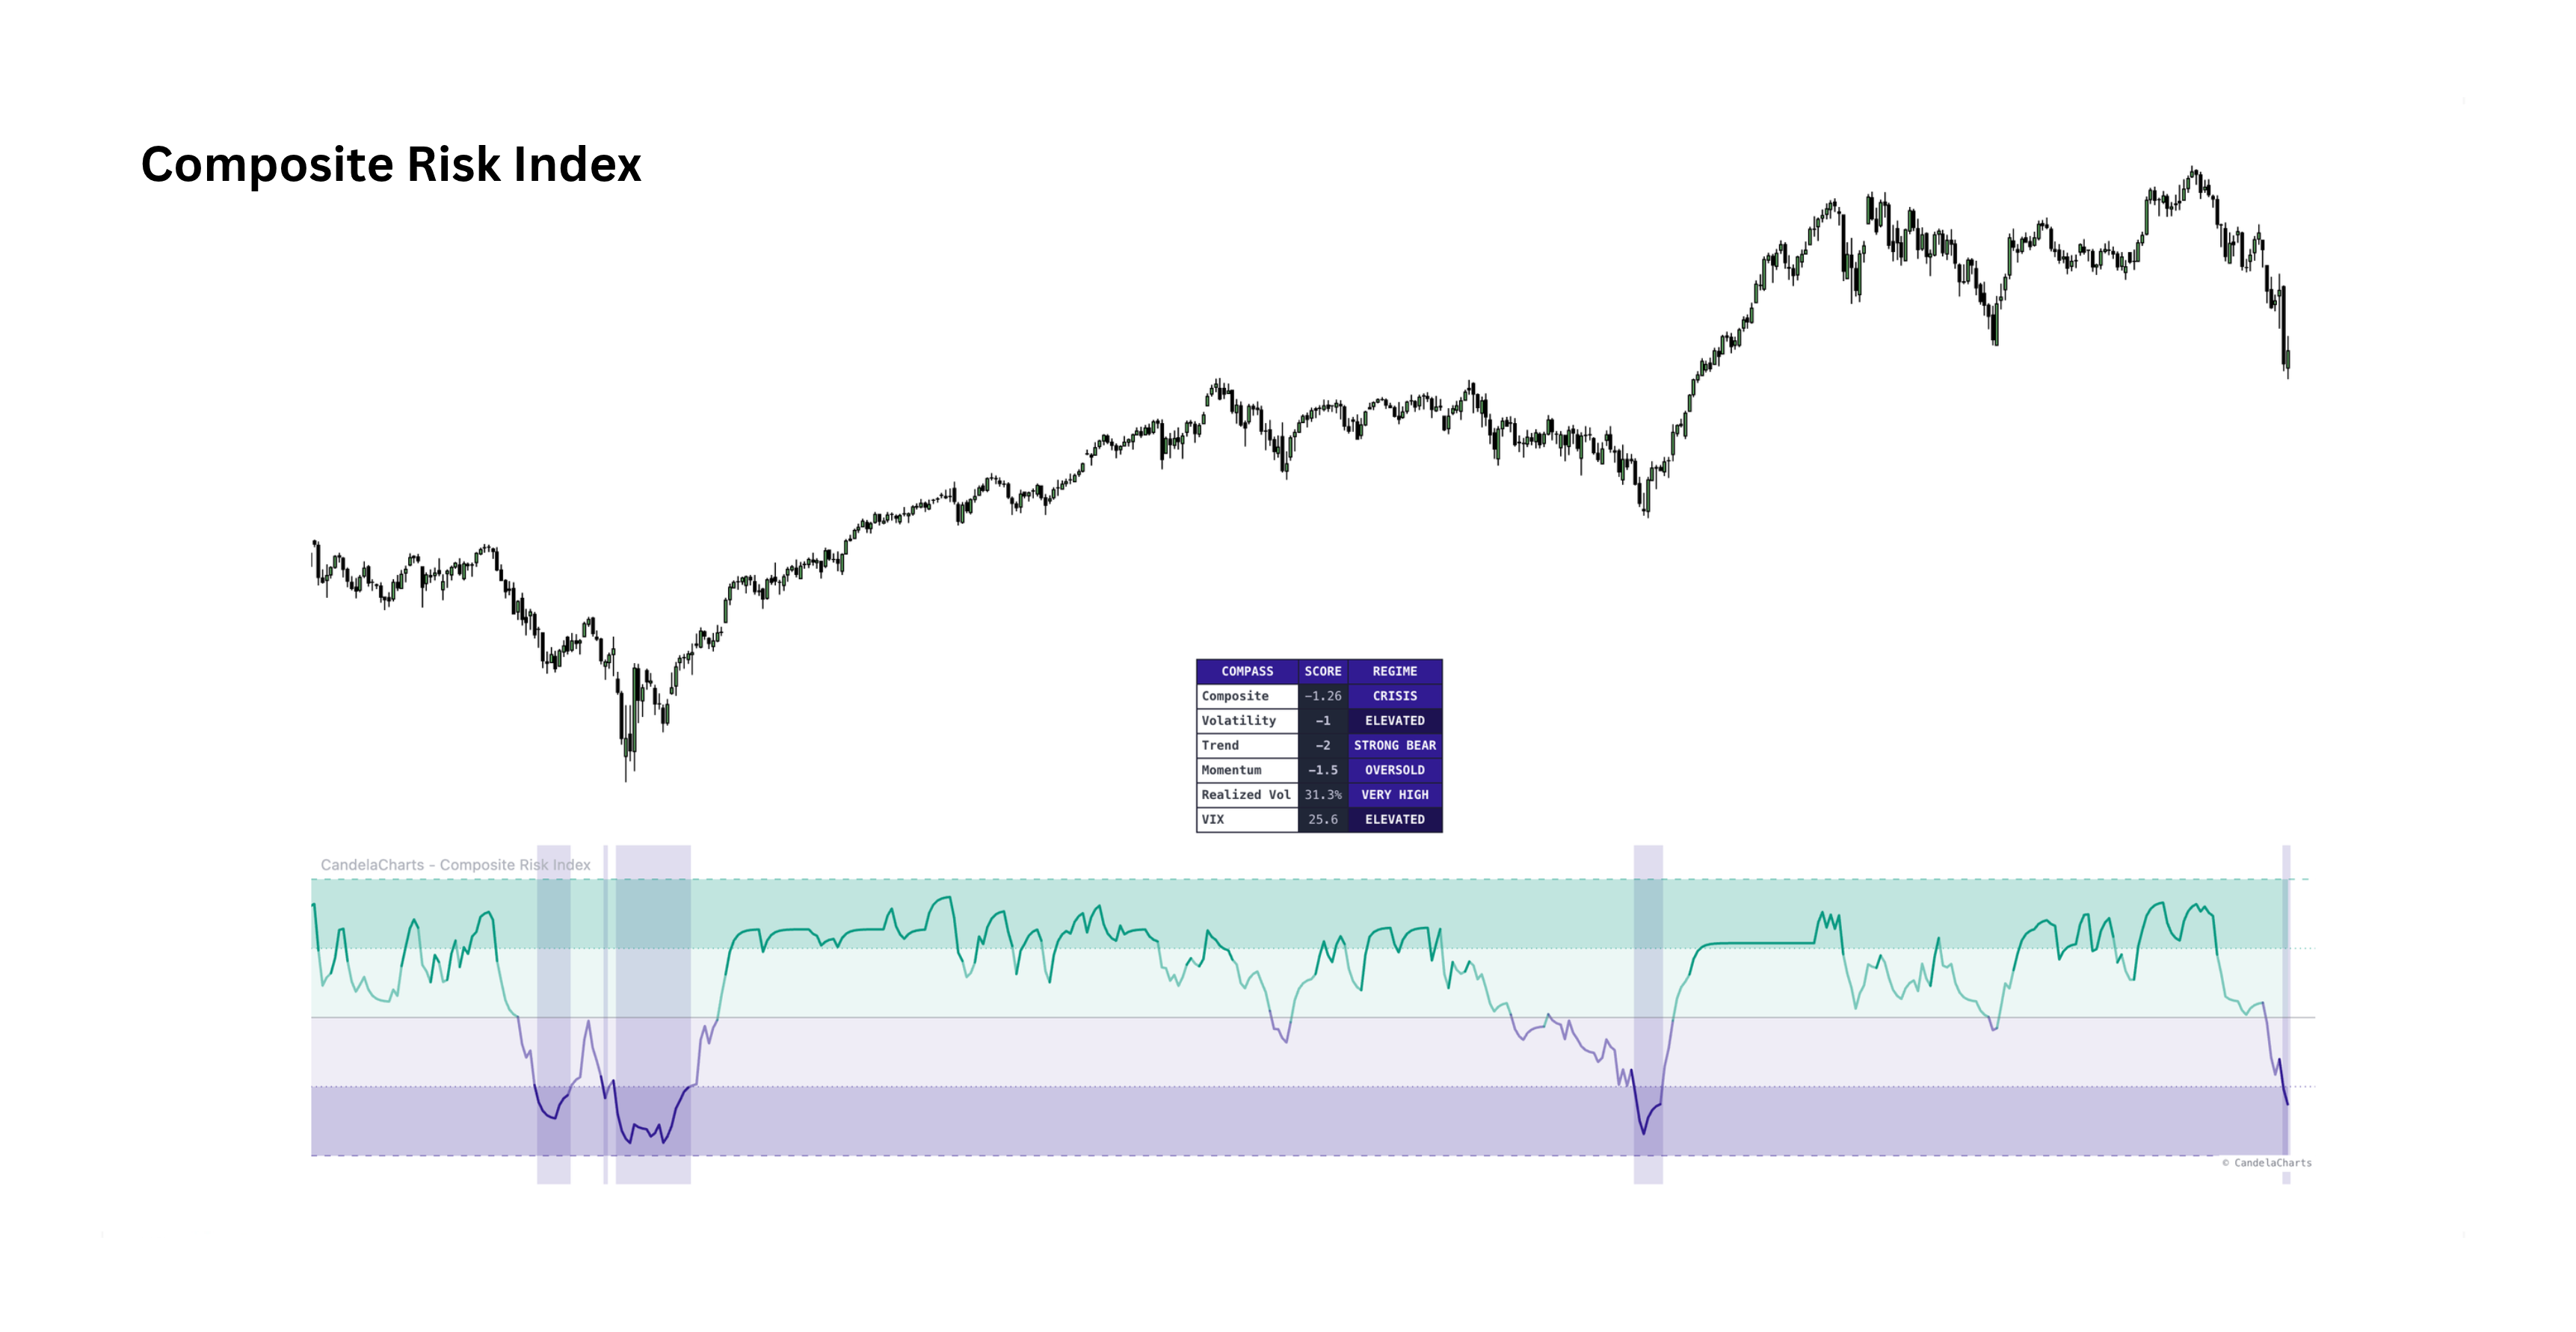
Composite Risk Index

Regime scoreView indicator
A single regime score built from volatility, trend and momentum — from crisis and risk-off dips to full risk-on, without stacking three separate indicators.
Three RegimesVolatility, trend and momentum are weighted into one score.
Risk BandsCrisis, risk-off, neutral and risk-on states with dip shading.
Component BreakdownThe panel separates each leg, plus realized and external volatility.
02

Macro

The backdrop behind equities: credit, liquidity, valuation and volatility, read before those conditions reach price.
Macro Credit Model preview

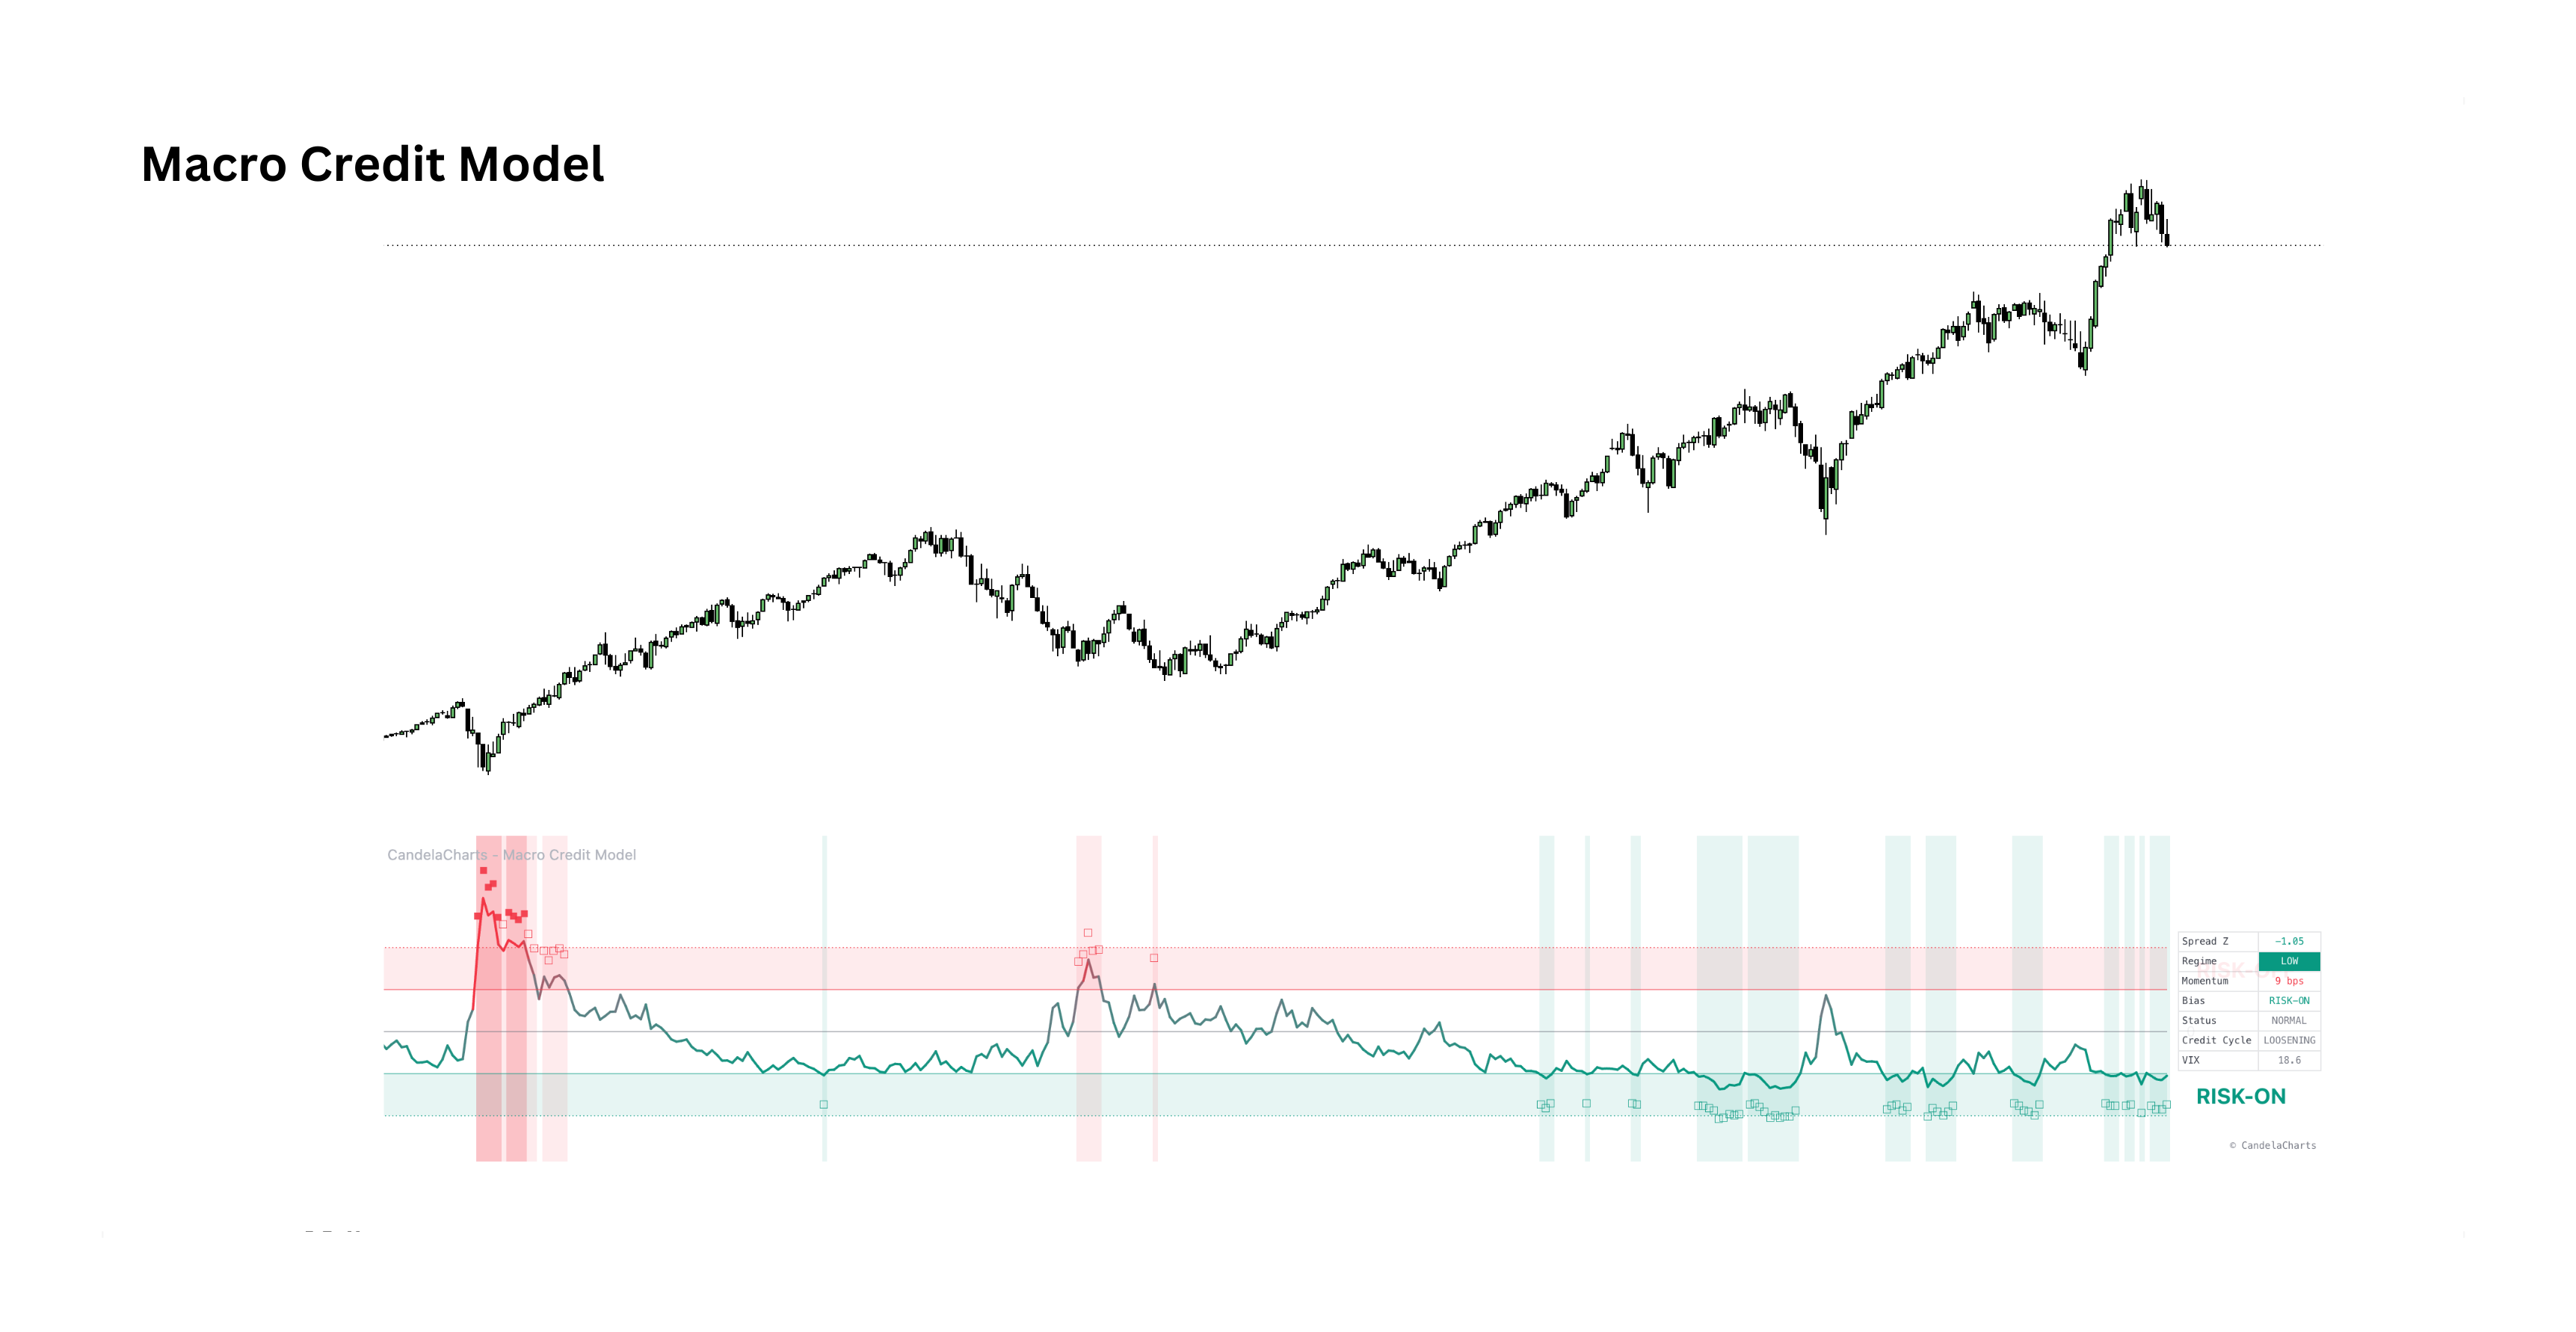
Macro Credit Model

Credit backdropView indicator
Analyzes the option-adjusted spread between High Yield and Investment Grade corporate bonds, standardized into a Z-Score, to flag credit stress and macro risk-on/risk-off regimes before they fully appear in equities.
Credit Spread Z-ScoreNormalizes HY vs IG spreads to detect unusual deviations.
Regime HighlightingBackground zones for elevated (risk-off) and low (risk-on) states.
Macro DashboardSpread Z-Score, regime, momentum, bias, credit cycle and VIX.
Macro Liquidity Gap preview

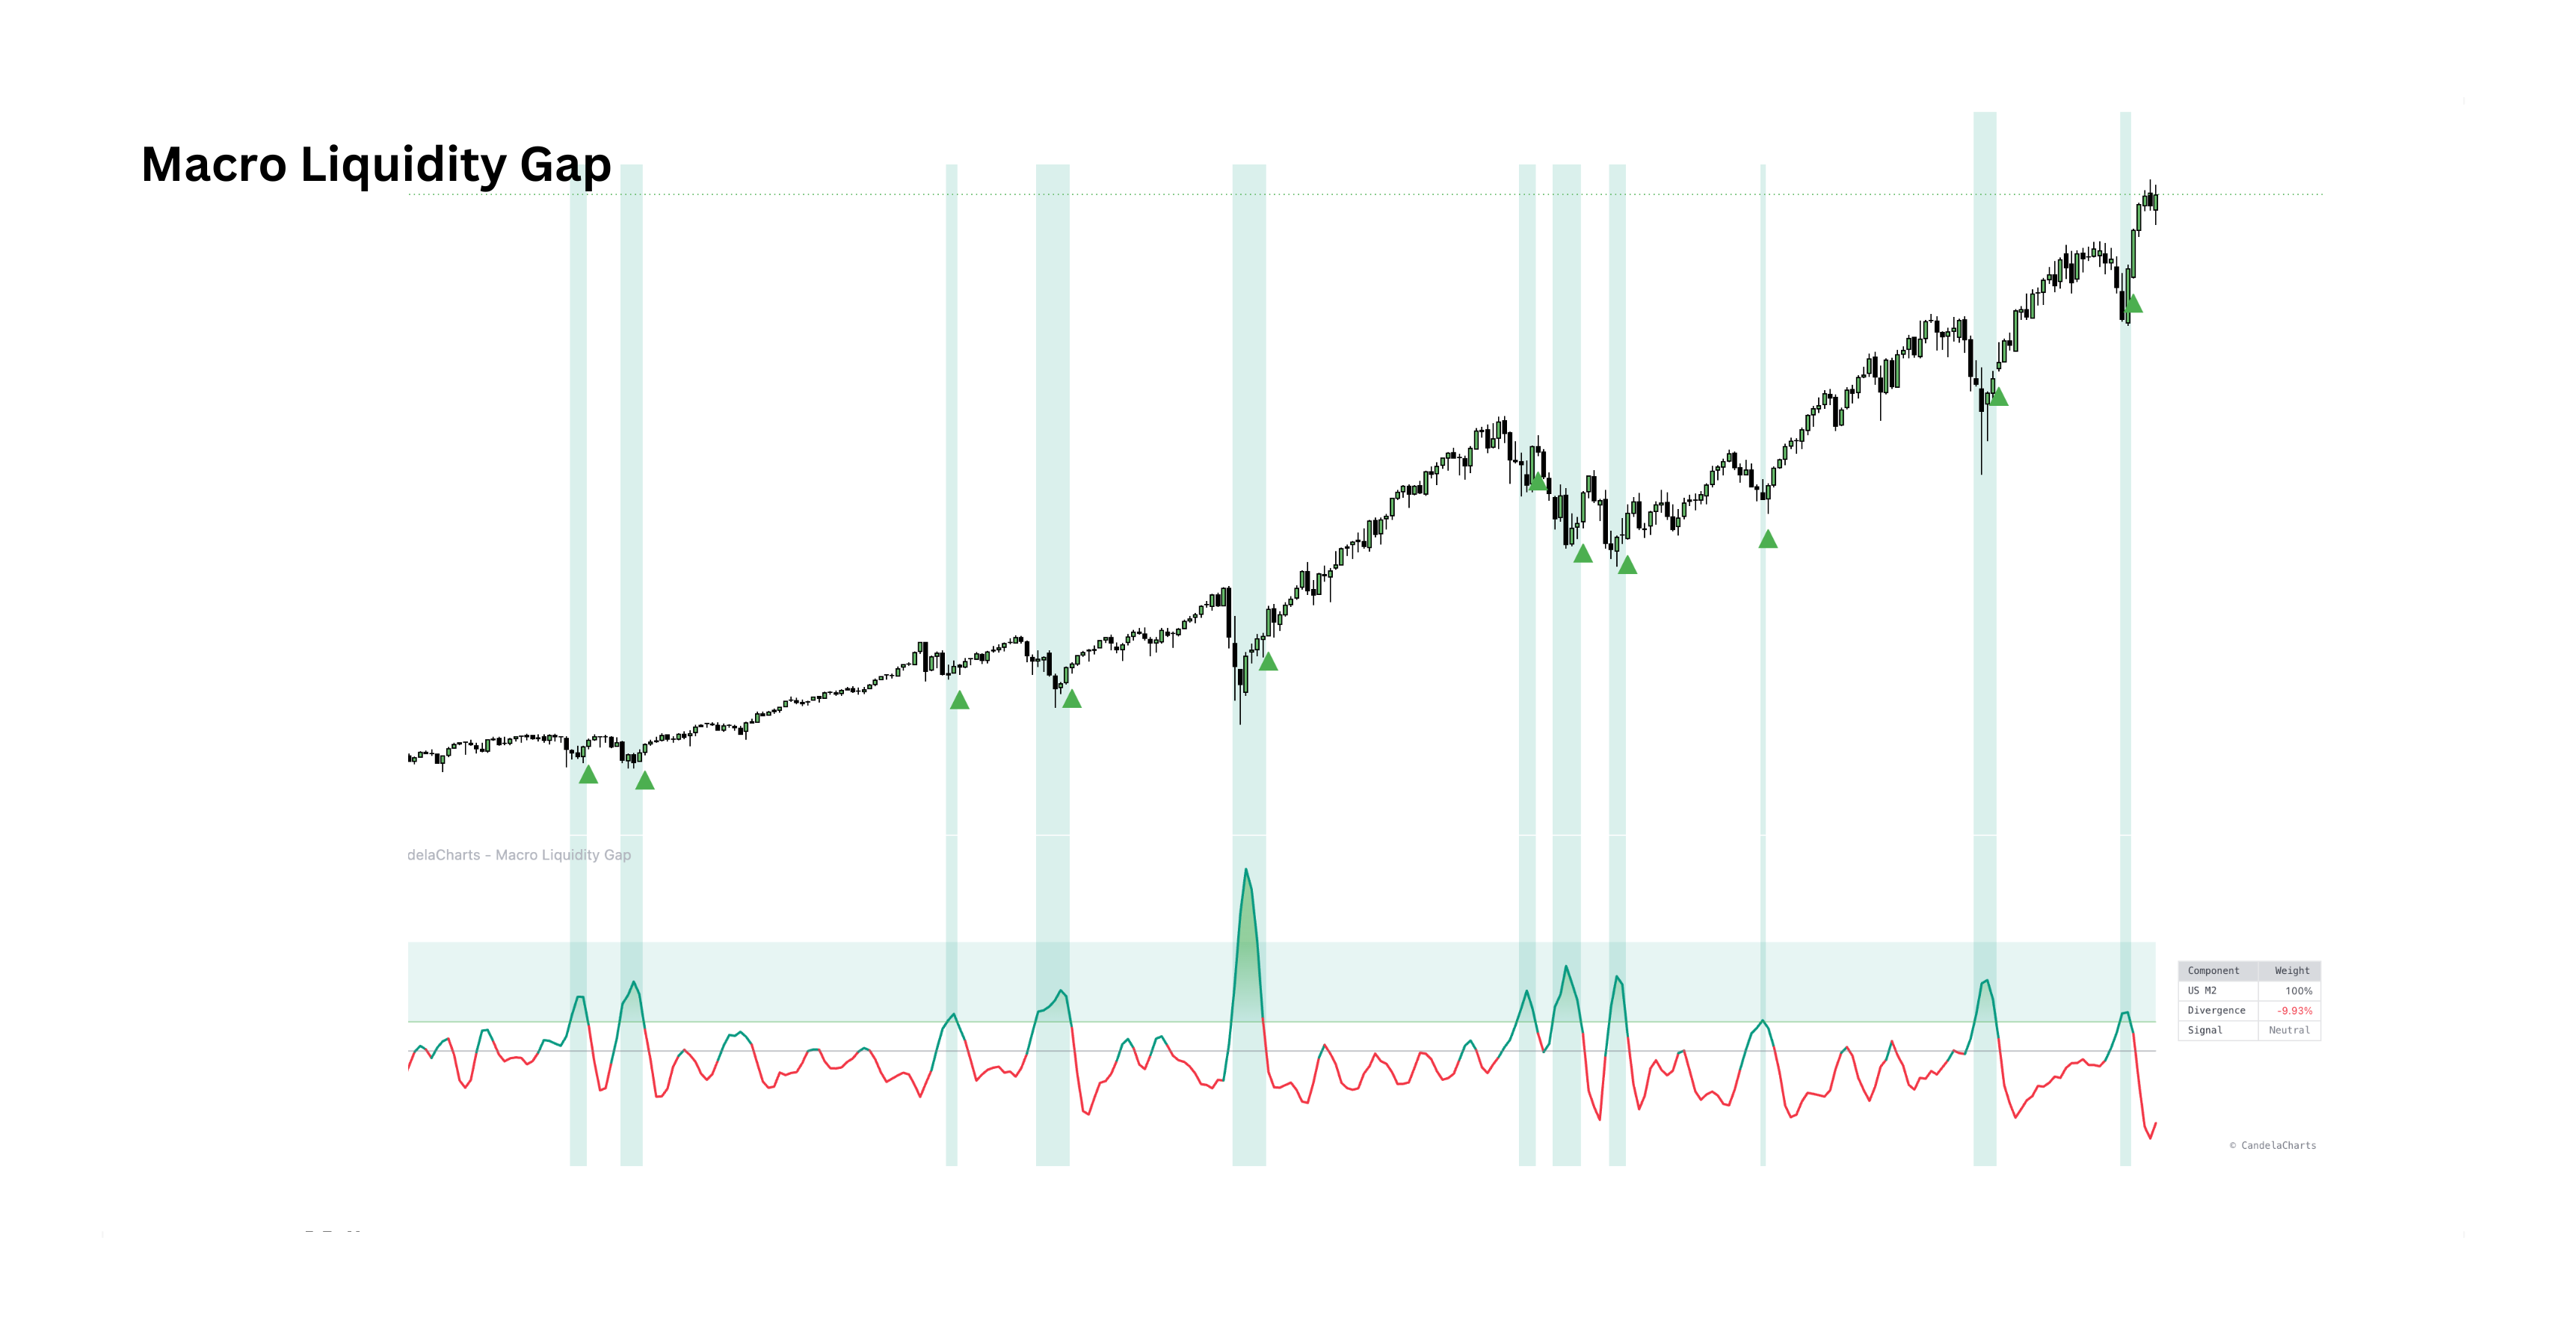
Macro Liquidity Gap

Liquidity divergenceView indicator
Measures the divergence between the true growth of global money supply and a selected market index — blending central bank M2 data with optional Fed net liquidity to flag deep value zones when liquidity outpaces price.
Central Bank M2Blends M2 from eight major economies with optional Fed net liquidity.
Live FX ConversionConverts international supplies to USD at interbank rates.
Buy ZonesPaints the background when liquidity heavily outpaces the index.
Macro Horizon Model preview

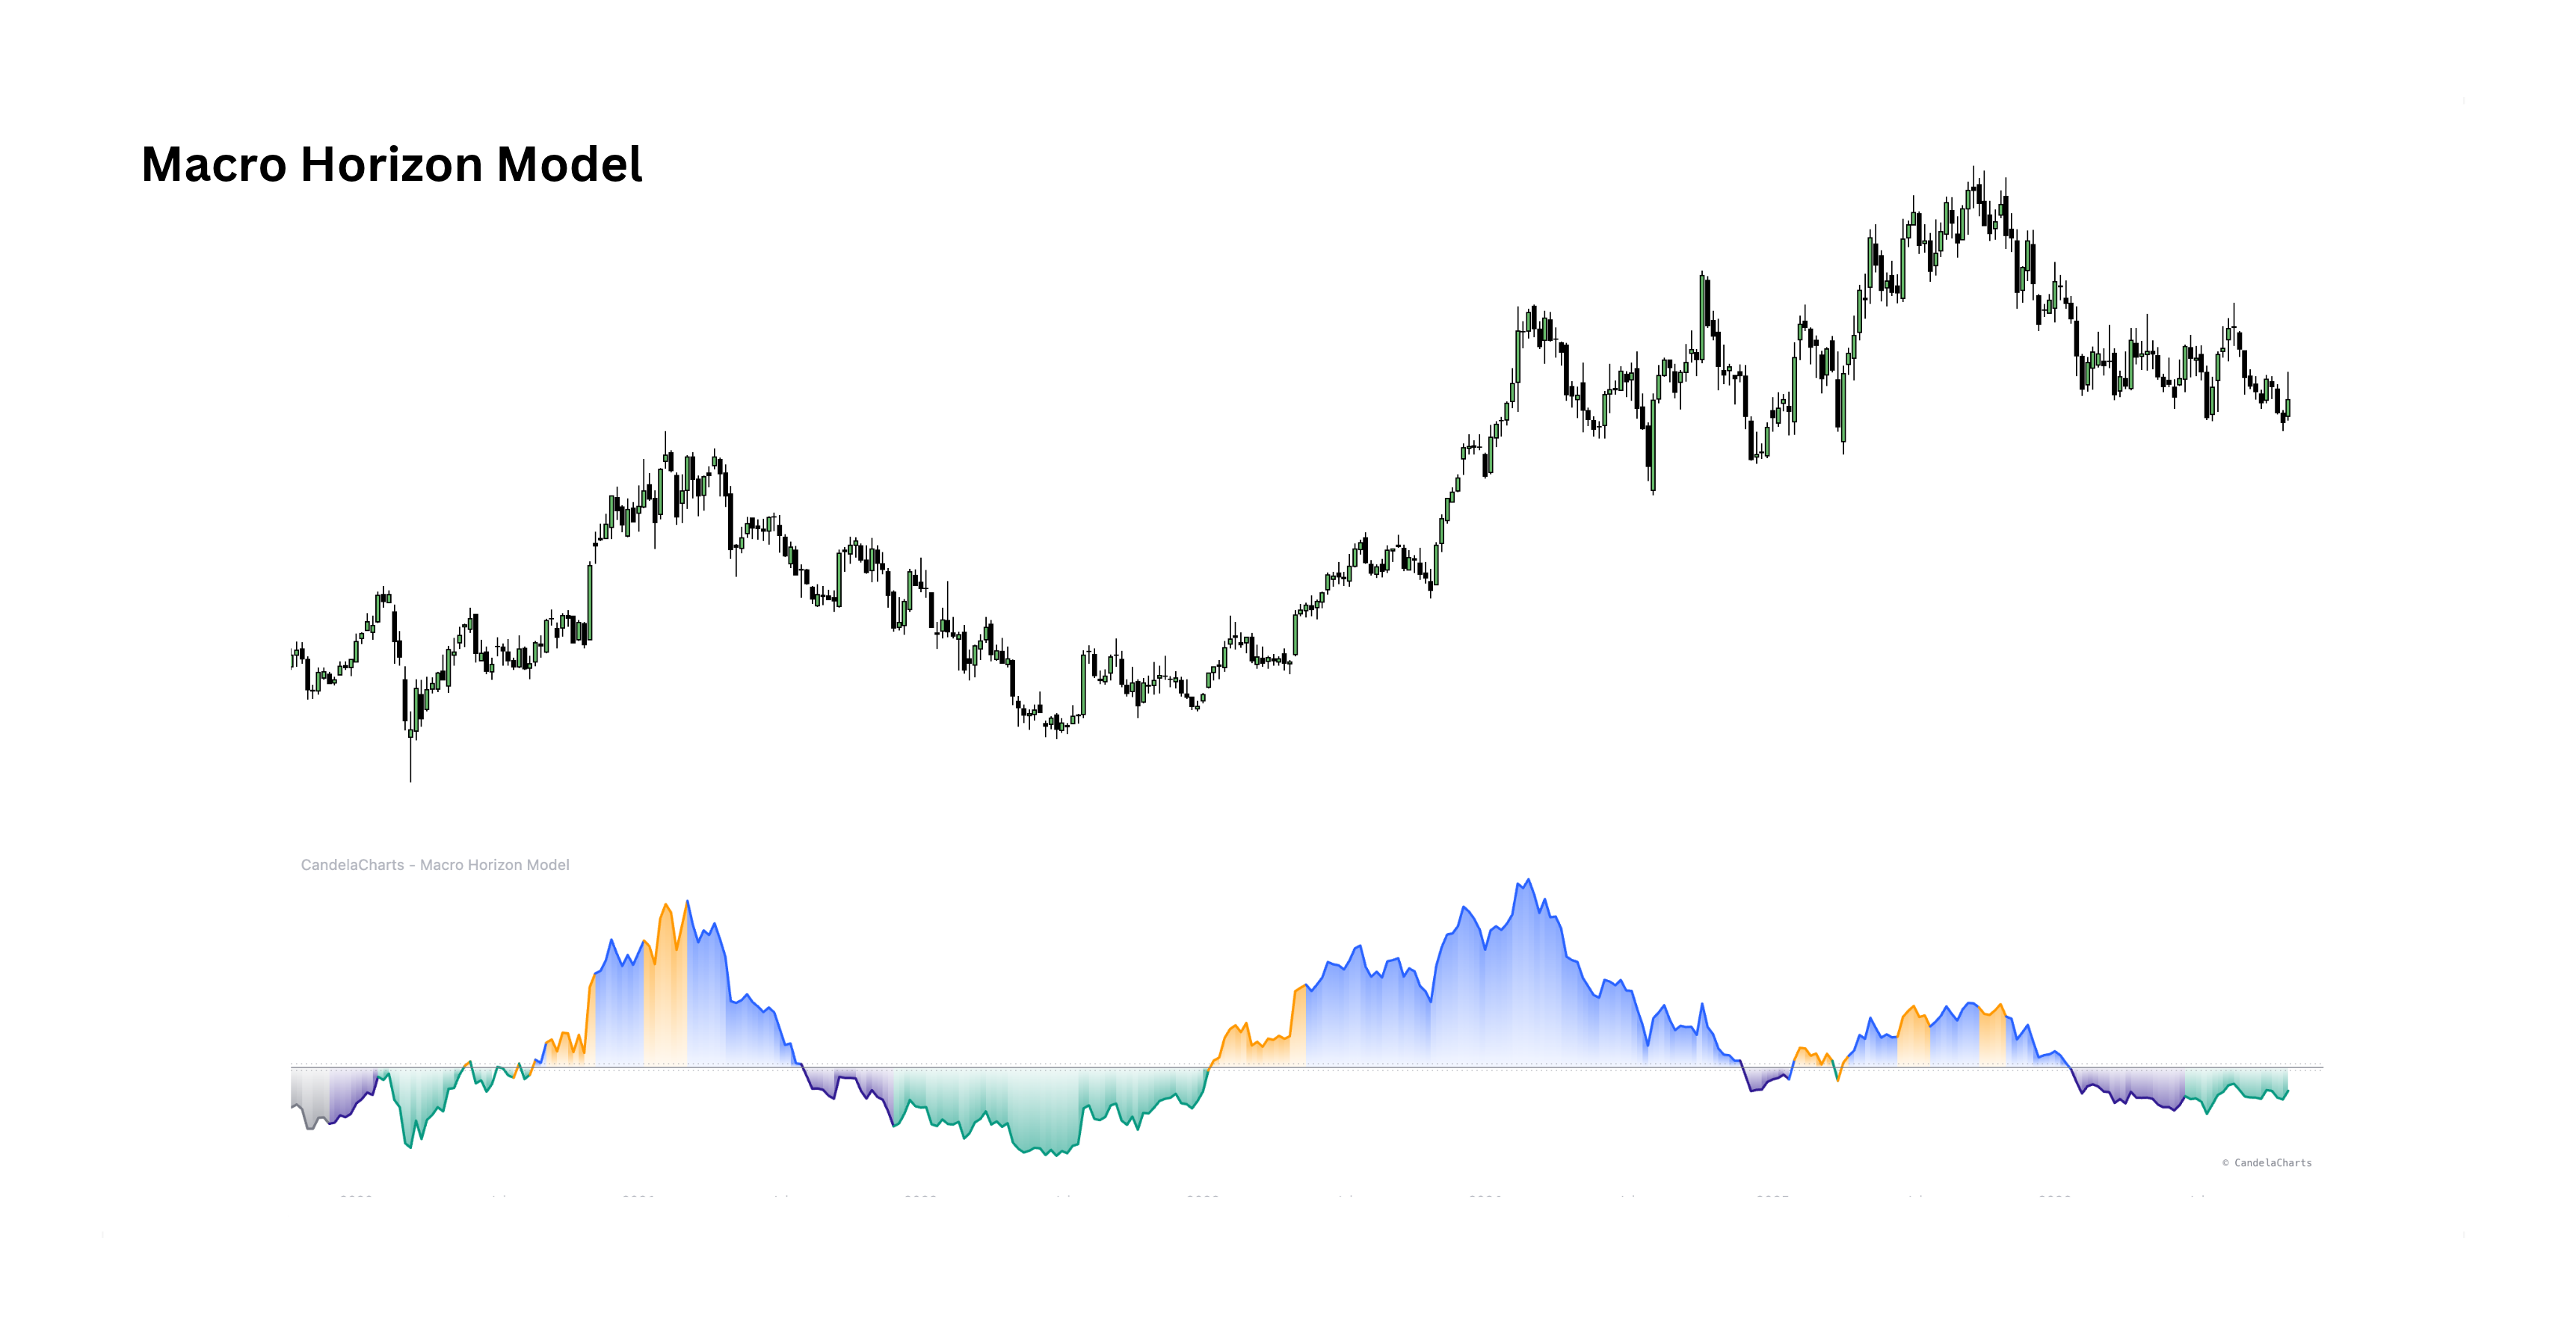
Macro Horizon Model

Lagging news vs priceView indicator
Price against a six-month average carried six months forward — the gap between current mood and the tone of lagging news, sorted into four states.
Hall Lag LineA six-month average displaced six months into the future.
Four StatesAligned expansion and contraction, plus peak and trough divergence.
Scheduled TurnThe lag line's next direction change is knowable in advance.
Macro Stress Index preview

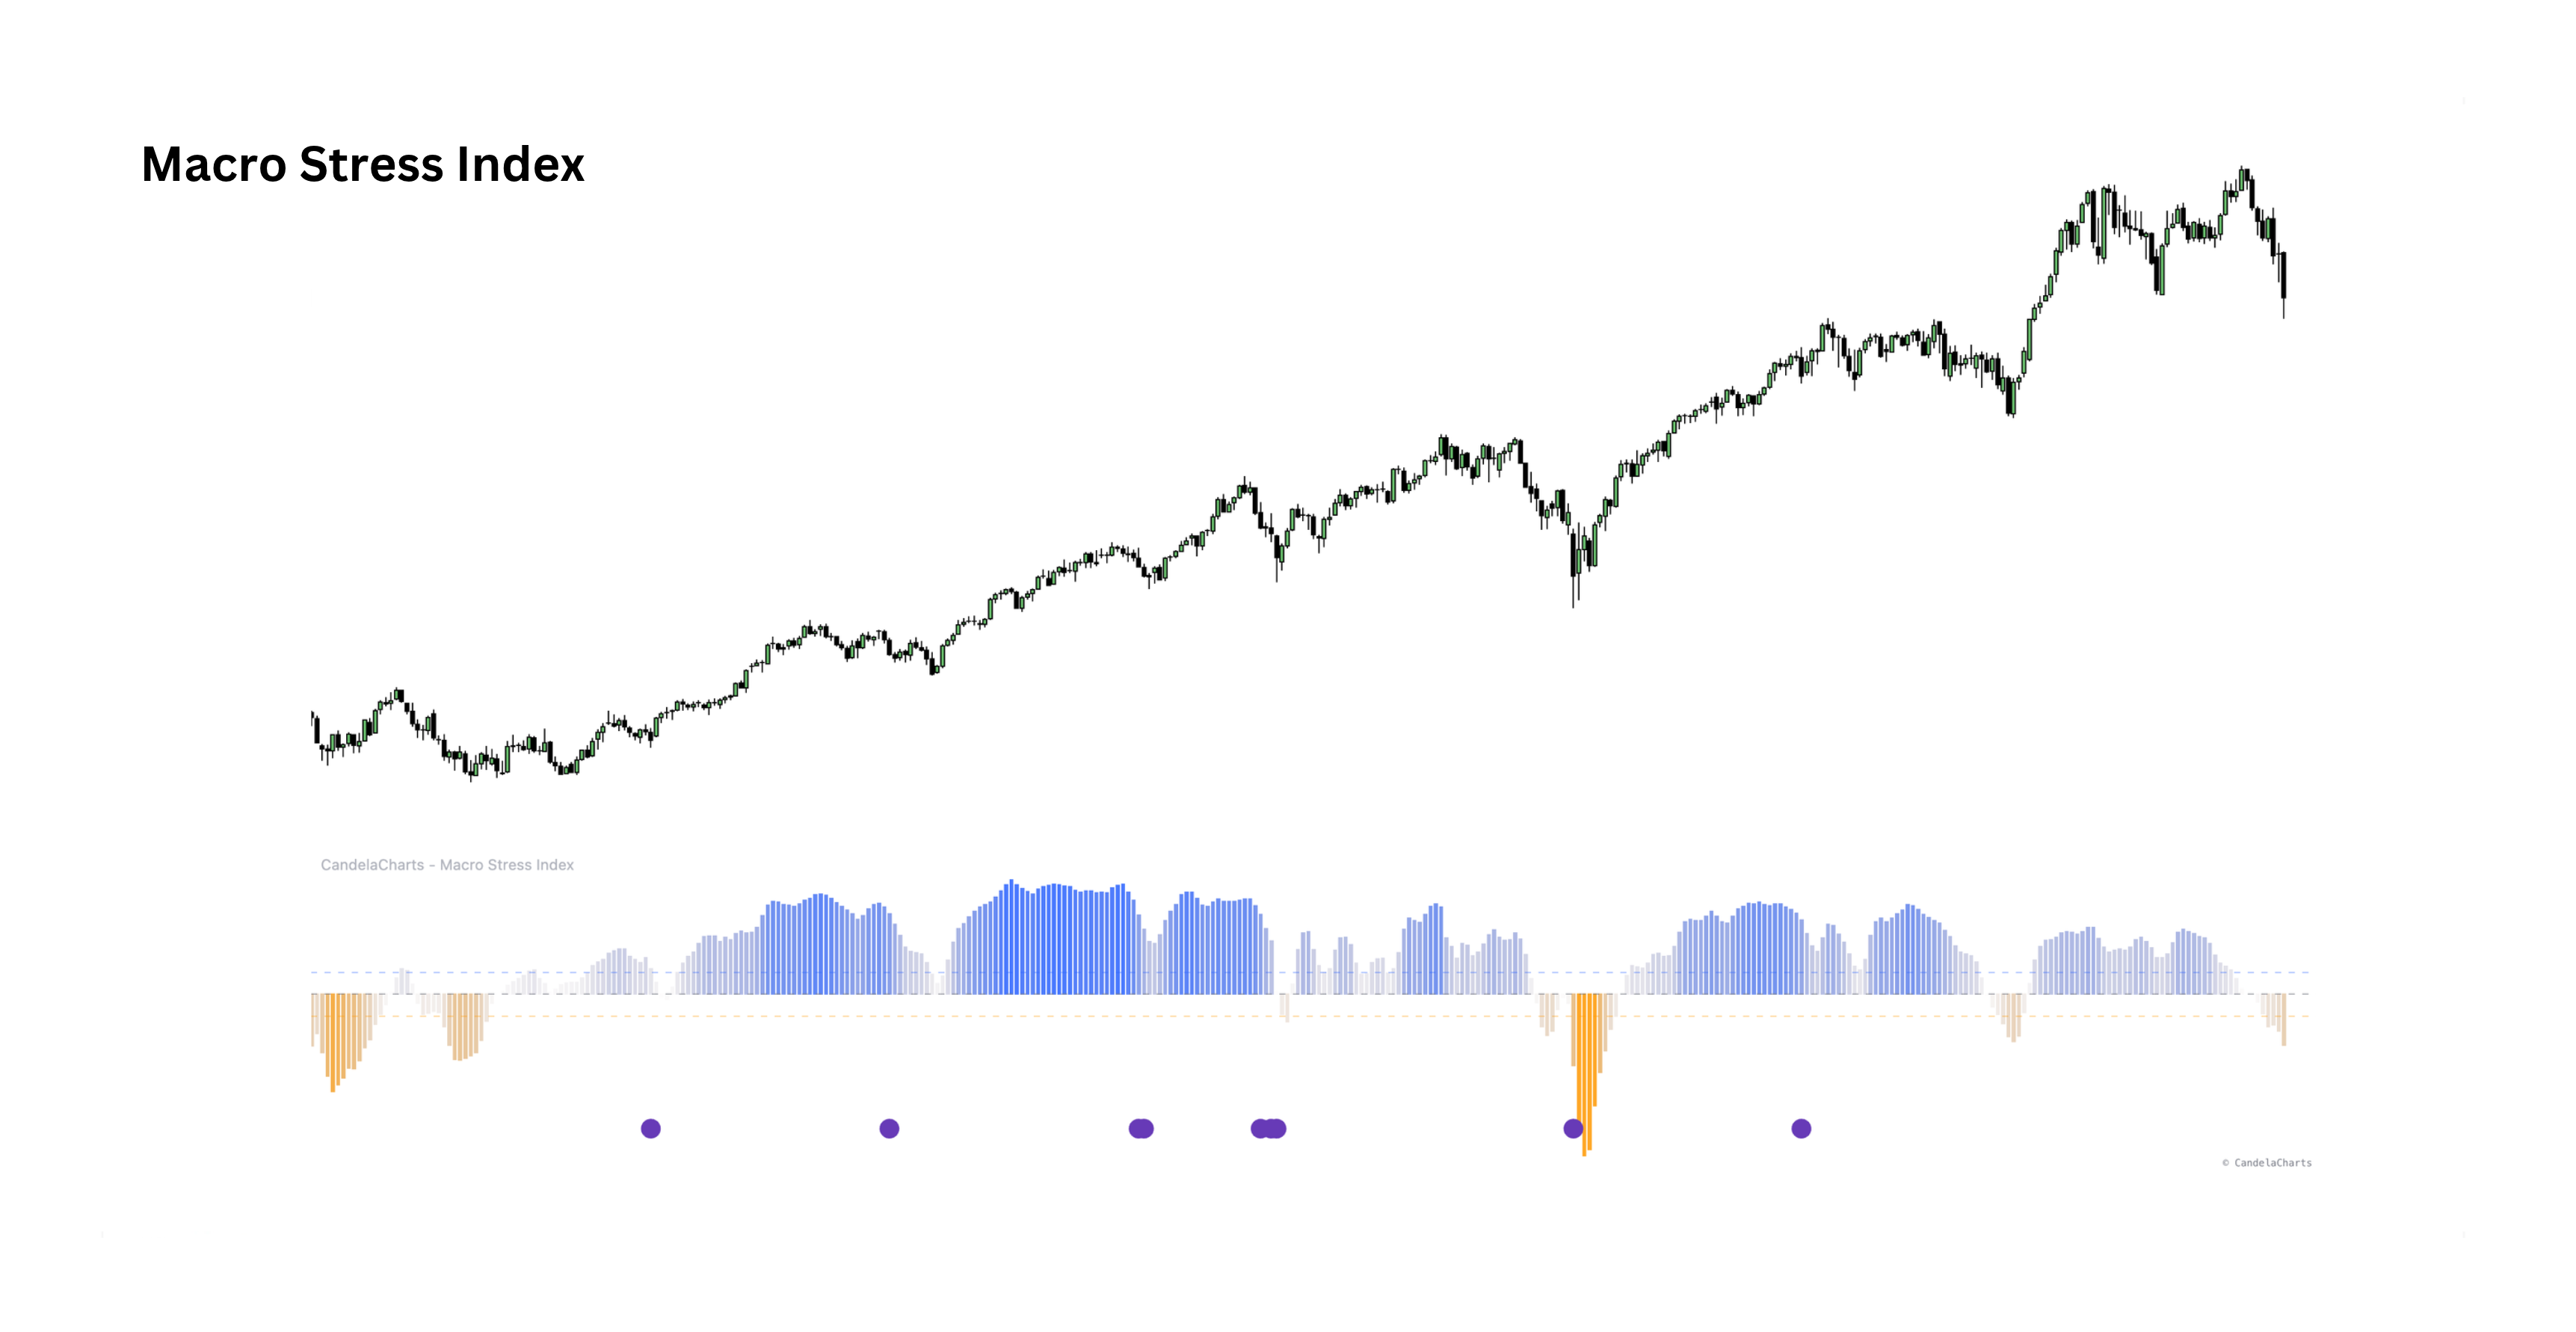
Macro Stress Index

Macro risk filterView indicator
One risk reading of the macro backdrop from volatility, credit and the stocks-to-Treasuries ratio — each z-scored against its own trailing year and weighted.
Three LegsVolatility, credit spreads and relative equity demand.
One ScoreEach leg is z-scored and weighted into a single macro reading.
Anomaly FlagsRare extremes more than three standard deviations from normal.
Contango Slope Index preview

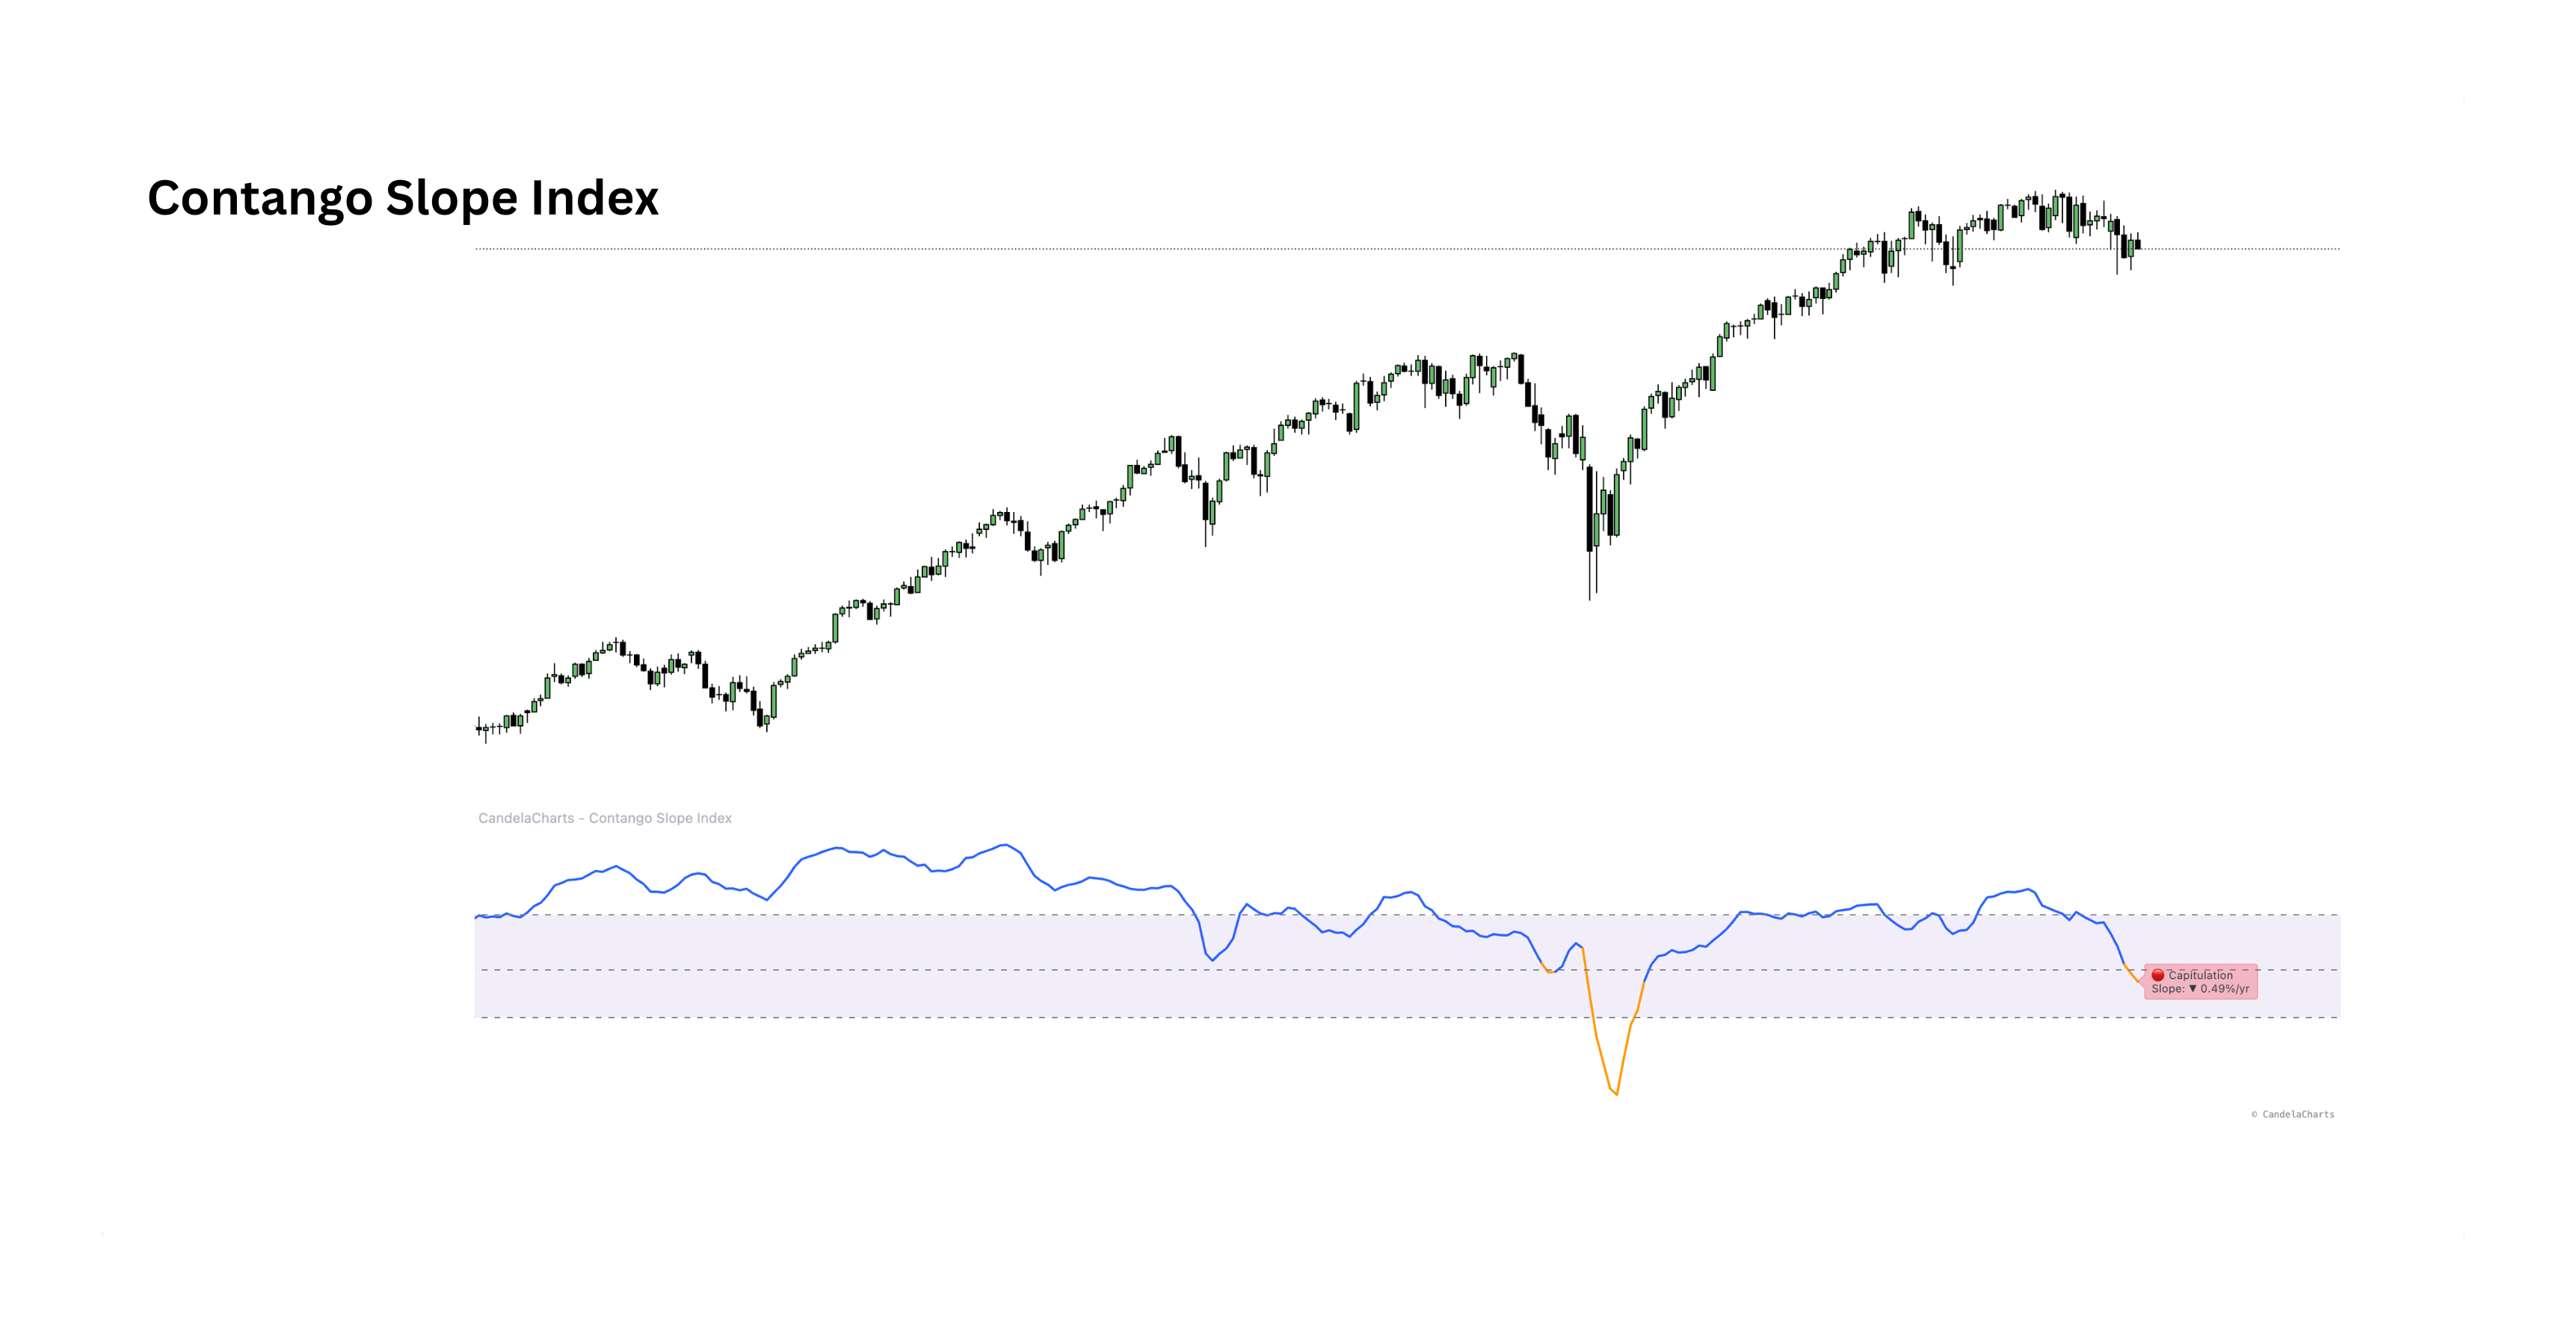
Contango Slope Index

Volatility term structureView indicator
Measures the slope of the VIX curve with a linear regression across multiple volatility tenors — reading whether markets price complacency (contango) or stress (backwardation) in real time.
Multi-Tenor InputsCombines VIX1D, VIX, VIX3M, VIX6M and VIX1Y into one curve.
Regime DetectionPositive slope signals contango; negative slope signals backwardation.
MA OverlayOptional moving average tracking slope trend and momentum shifts.
Shiller PE Ratio preview

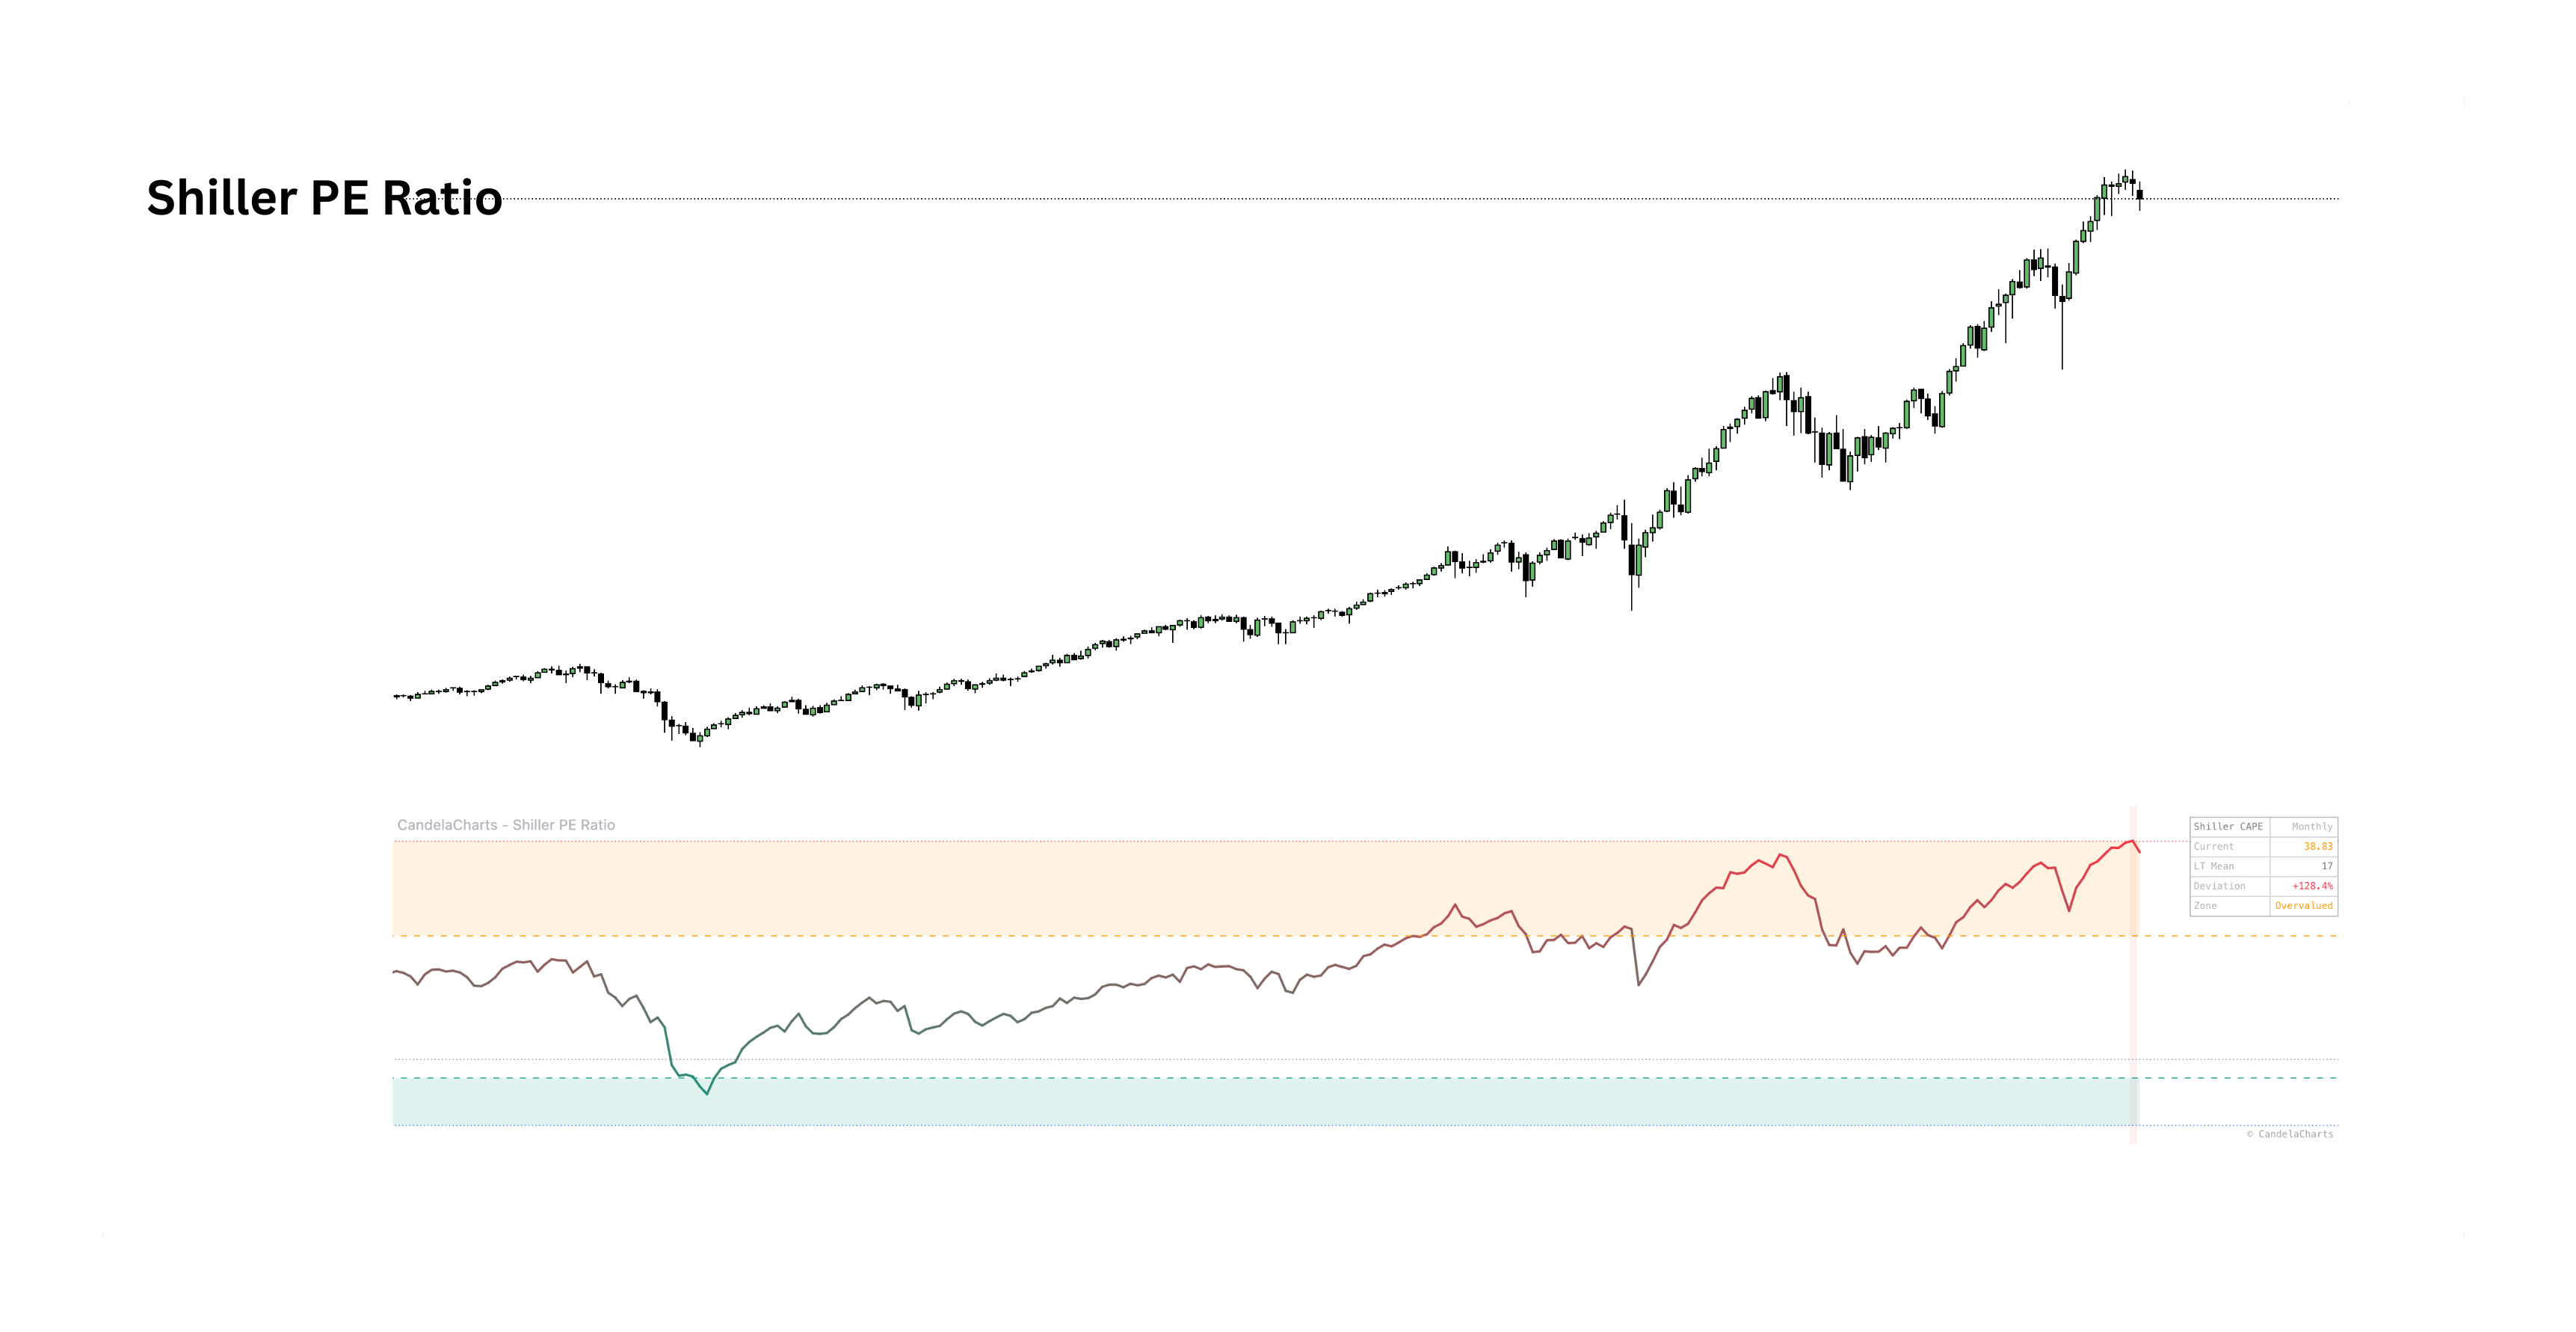
Shiller PE Ratio

Long-term valuationView indicator
Plots the cyclically adjusted P/E ratio anchored to 10 years of inflation-adjusted earnings, visualizing fair-value zones, extreme overvaluation peaks and generational buying opportunities across 140+ years of history.
CAPE RatioOfficial CAPE10 data pulled monthly or yearly.
Valuation ZonesExtreme undervalued through extreme overvalued regimes.
Mean DeviationTracks percentage deviation from the historical mean.
VIX Risk Z-Score preview

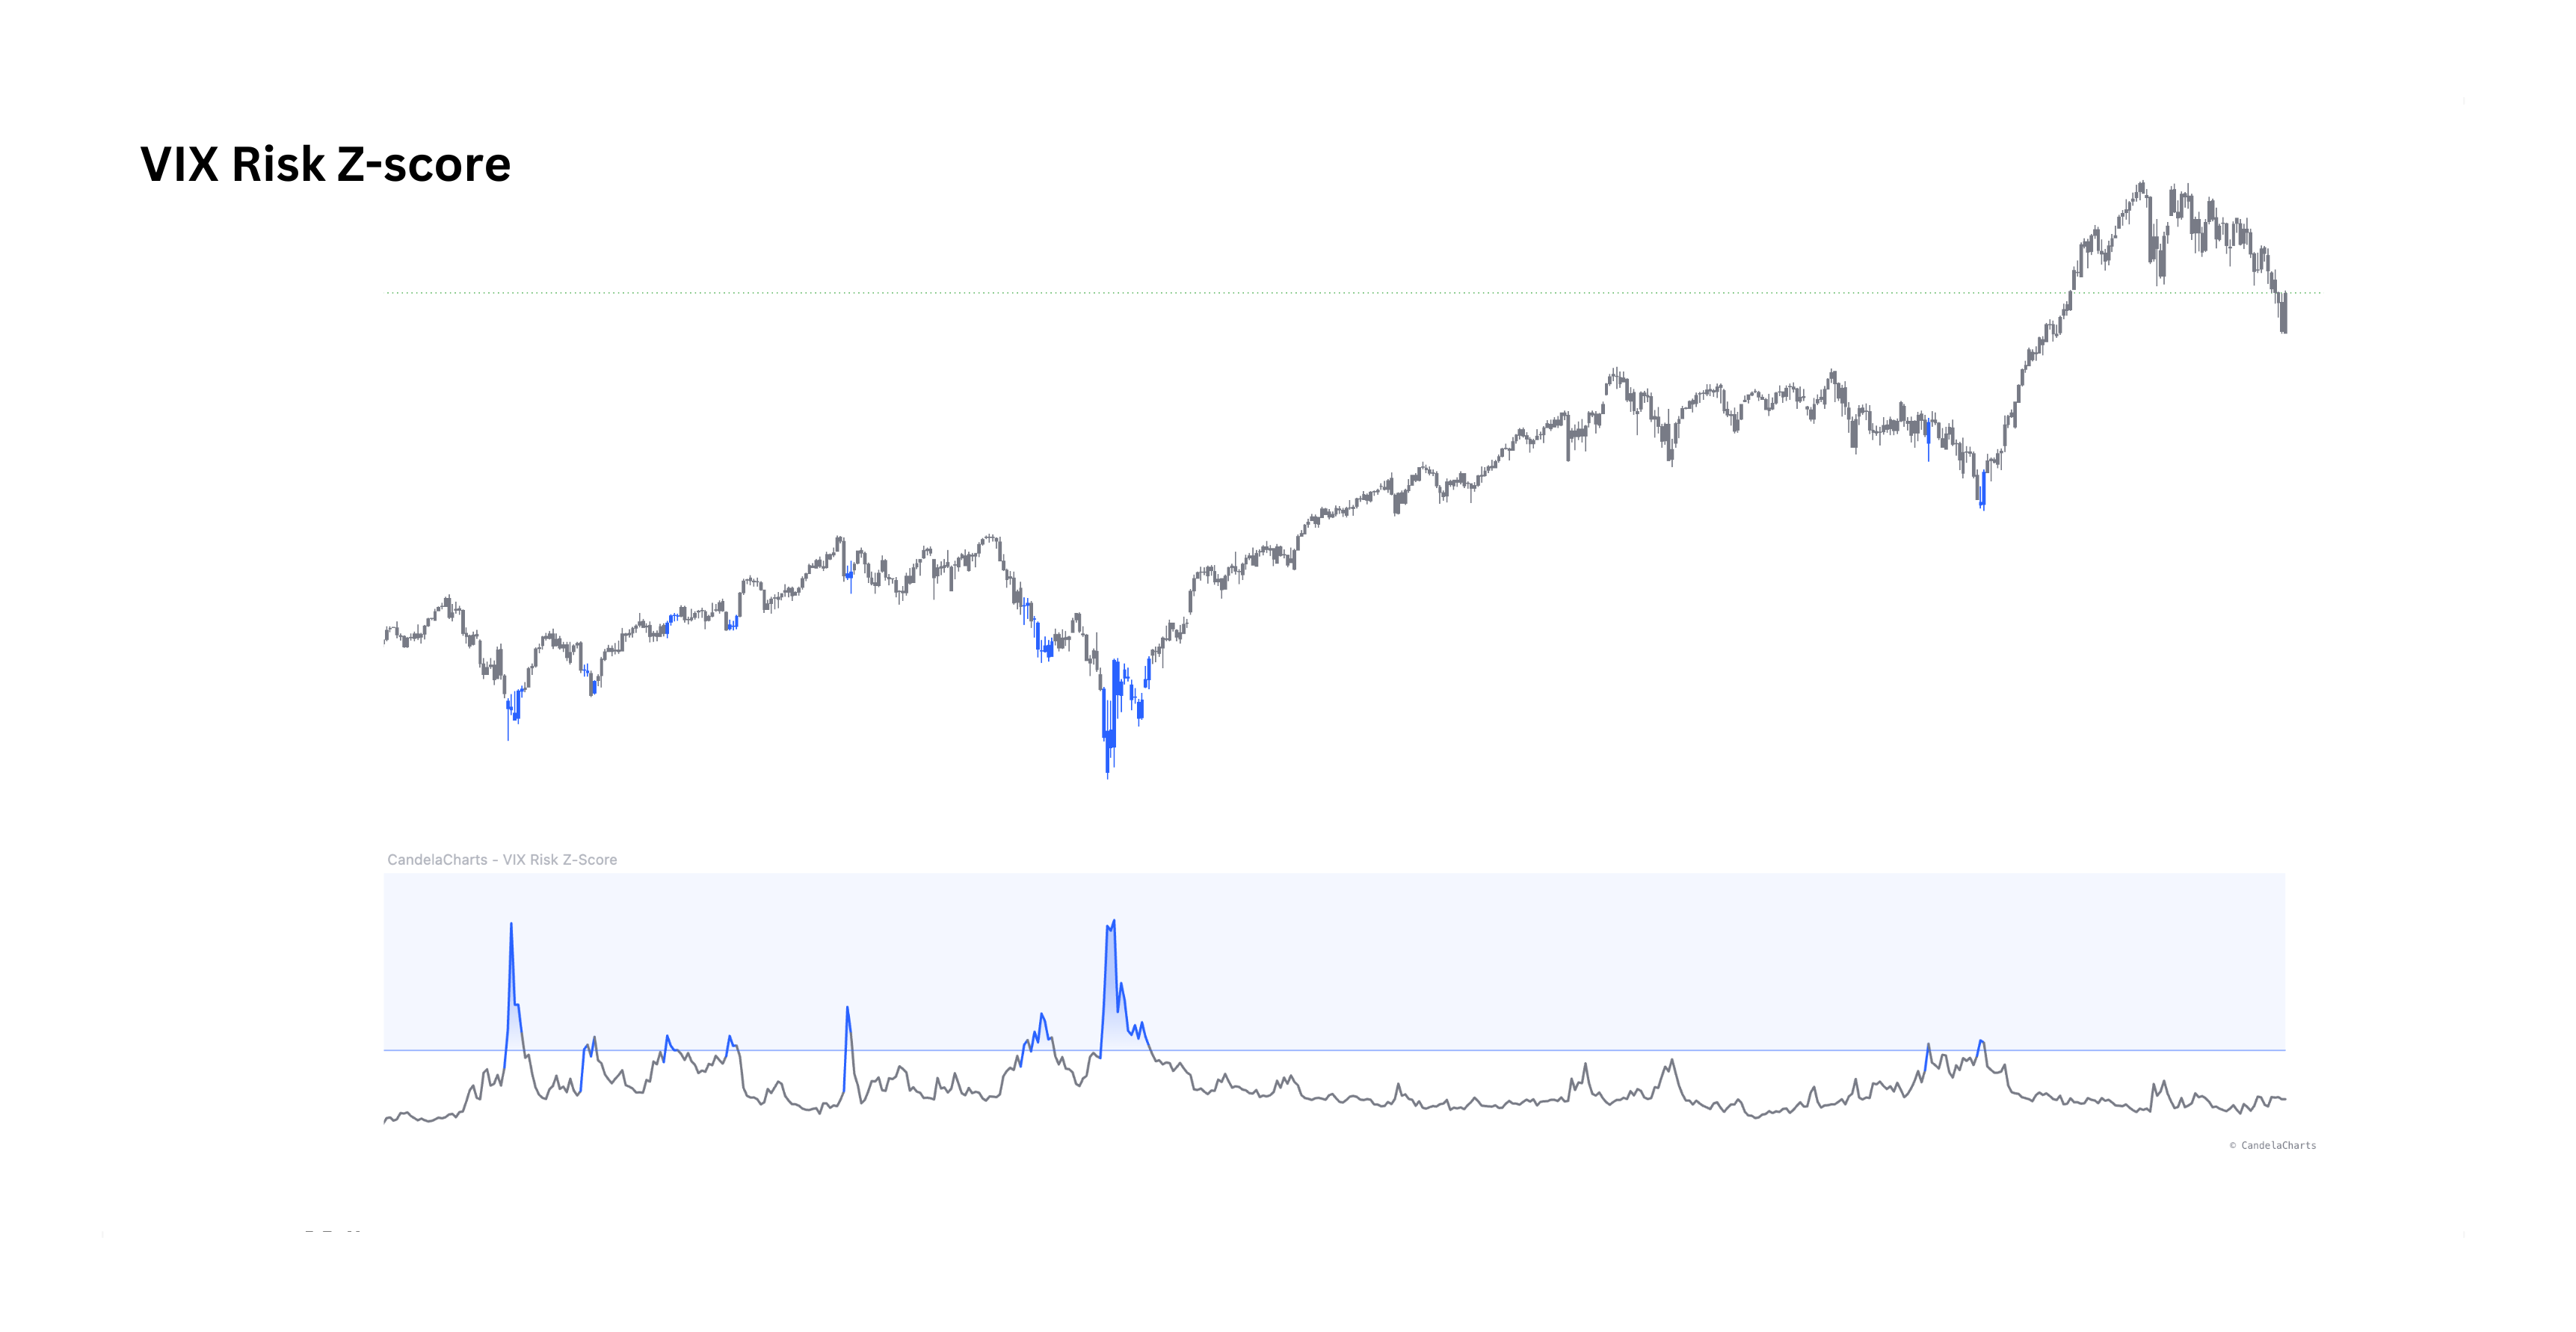
VIX Risk Z-Score

Volatility extremesView indicator
Gauges market volatility and risk by applying a Z-Score normalization to the VIX over a configurable lookback — flagging statistical extremes of fear (overbought) and complacency (oversold).
Z-Score NormalizationMeasures VIX deviation from its rolling mean in sigma units.
Statistical ExtremesHighlights extreme levels on price candles at ±2σ by default.
Custom ThresholdsConfigurable overbought, oversold and lookback settings.
03

Regime

The state of the tape and how much exposure it deserves — volatility, capitulation, trend consensus and position sizing.
Volatility Regime Model preview

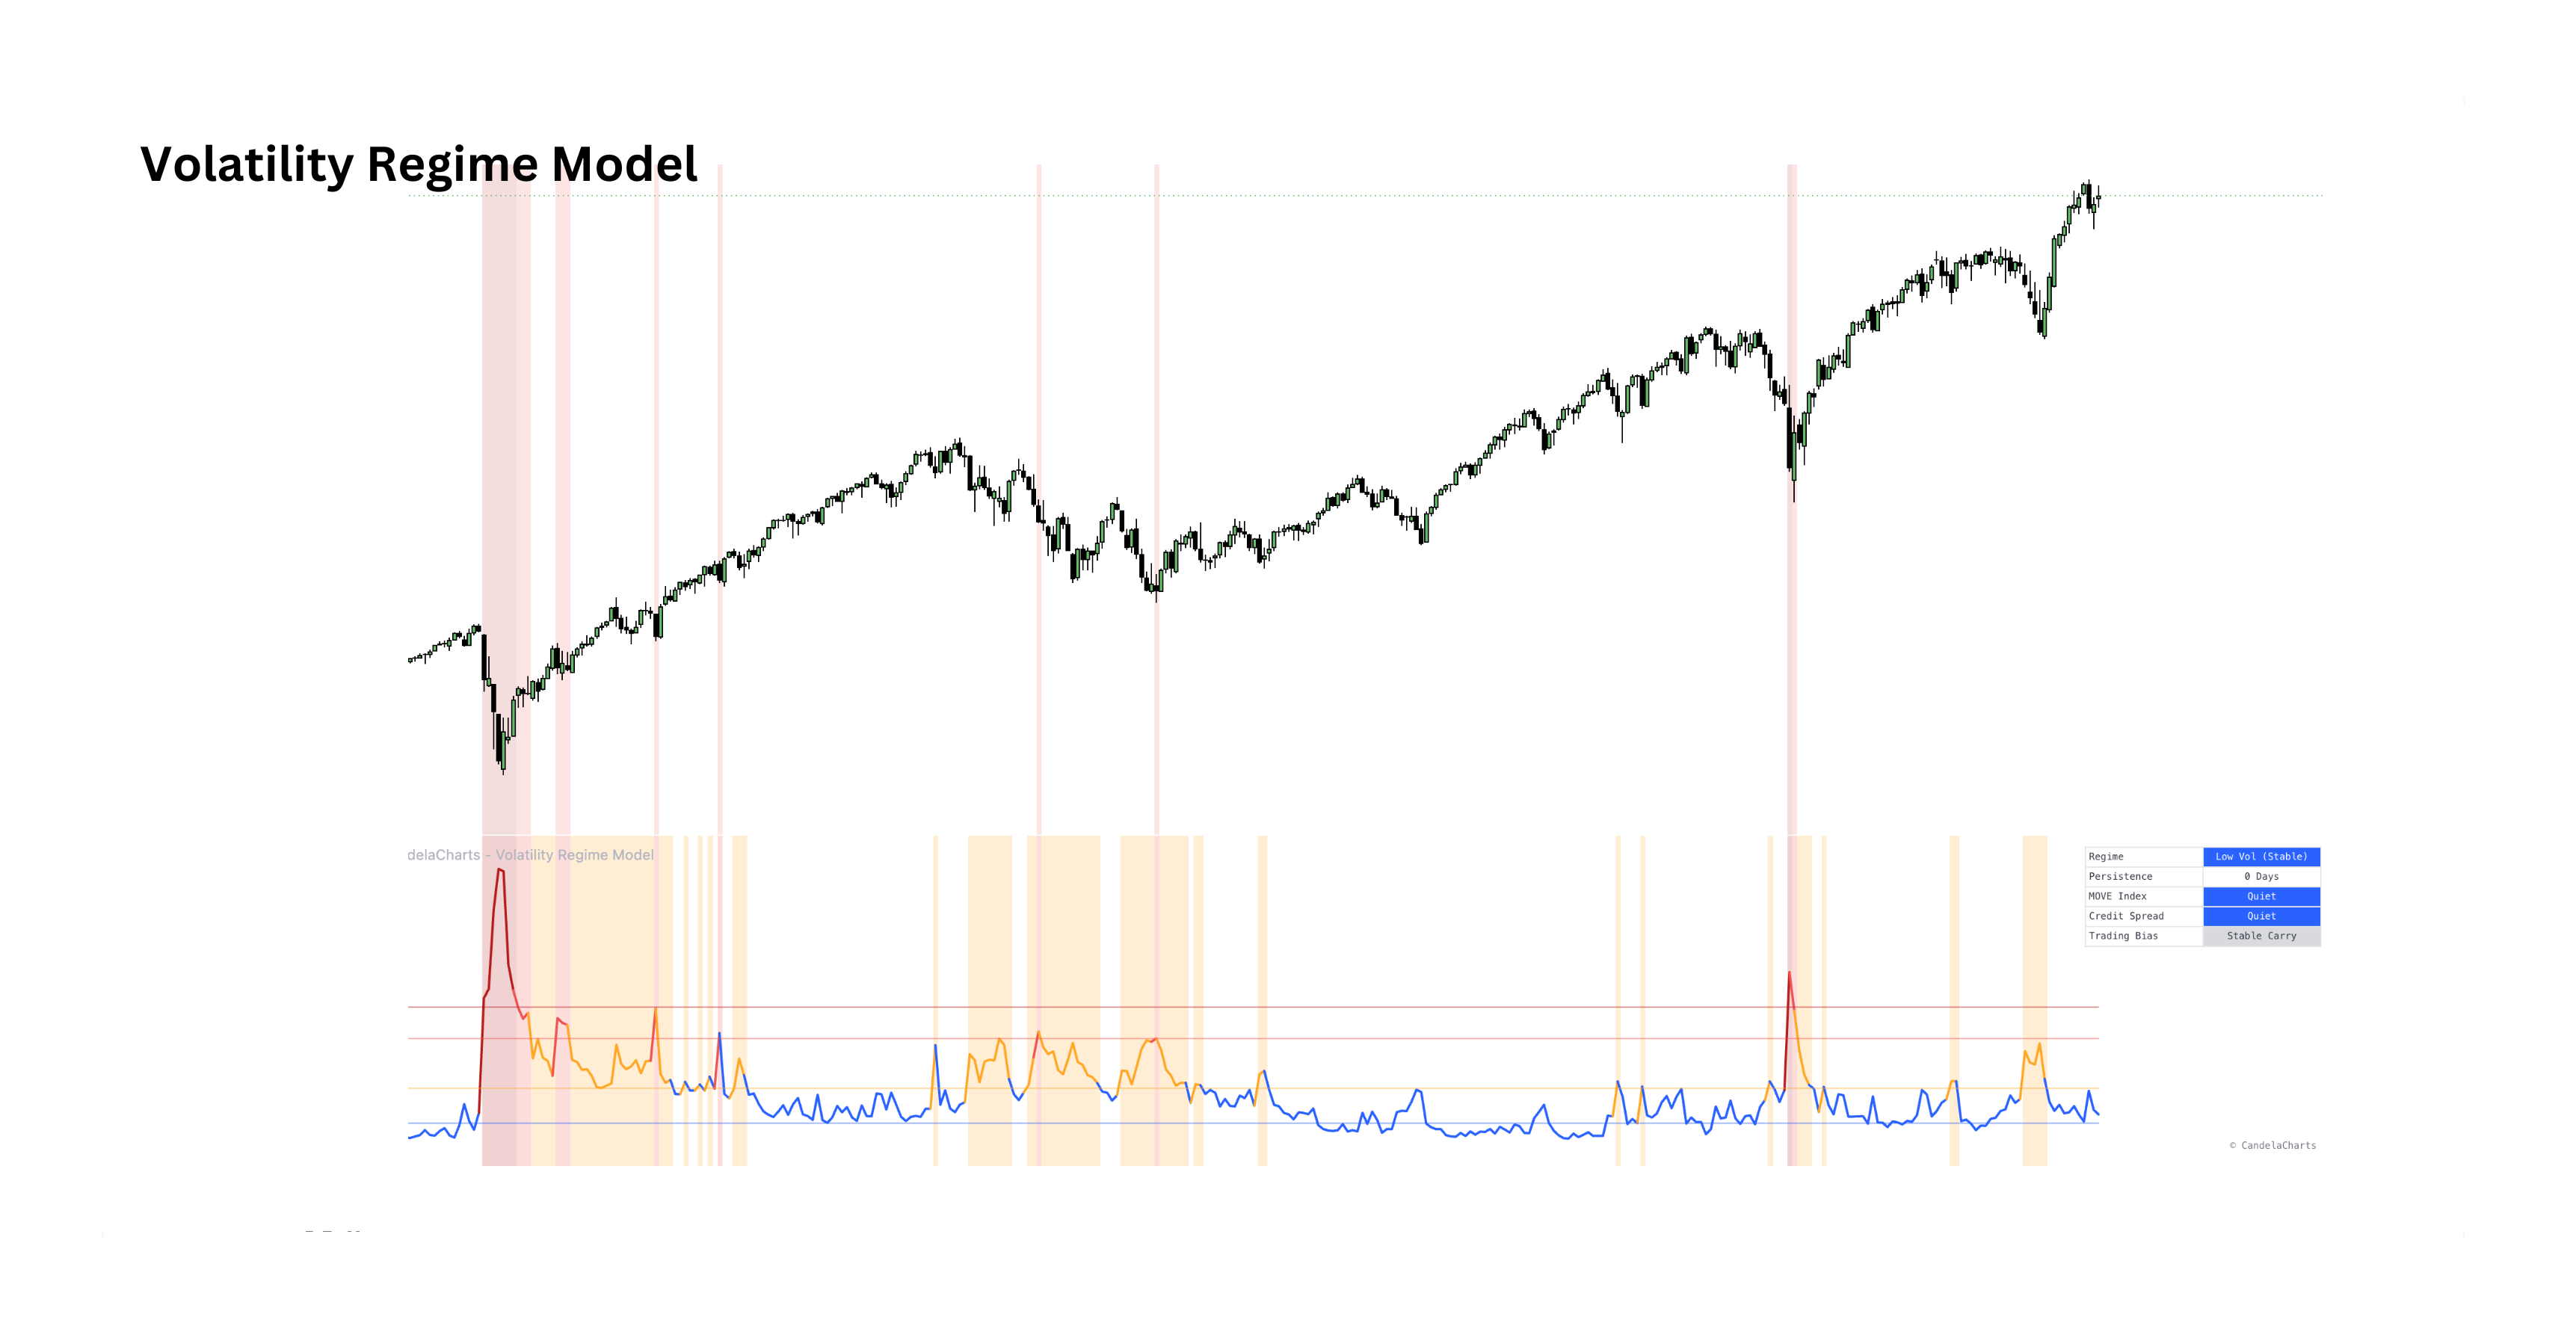
Volatility Regime Model

Regime classificationView indicator
Analyzes volatility as a series of distinct regimes rather than a single oscillator — classifying states, tracking persistence and validating with bond volatility and credit spreads to output a dynamic trading bias.
Regime ClassificationLow, mid, high volatility and crisis cluster states.
Persistence TrackingMeasures consecutive days elevated, shifting bias with time decay.
Cross-Asset ValidationConfirms stress via the MOVE Index and high-yield credit spreads.
Cycle Capitulation Model preview

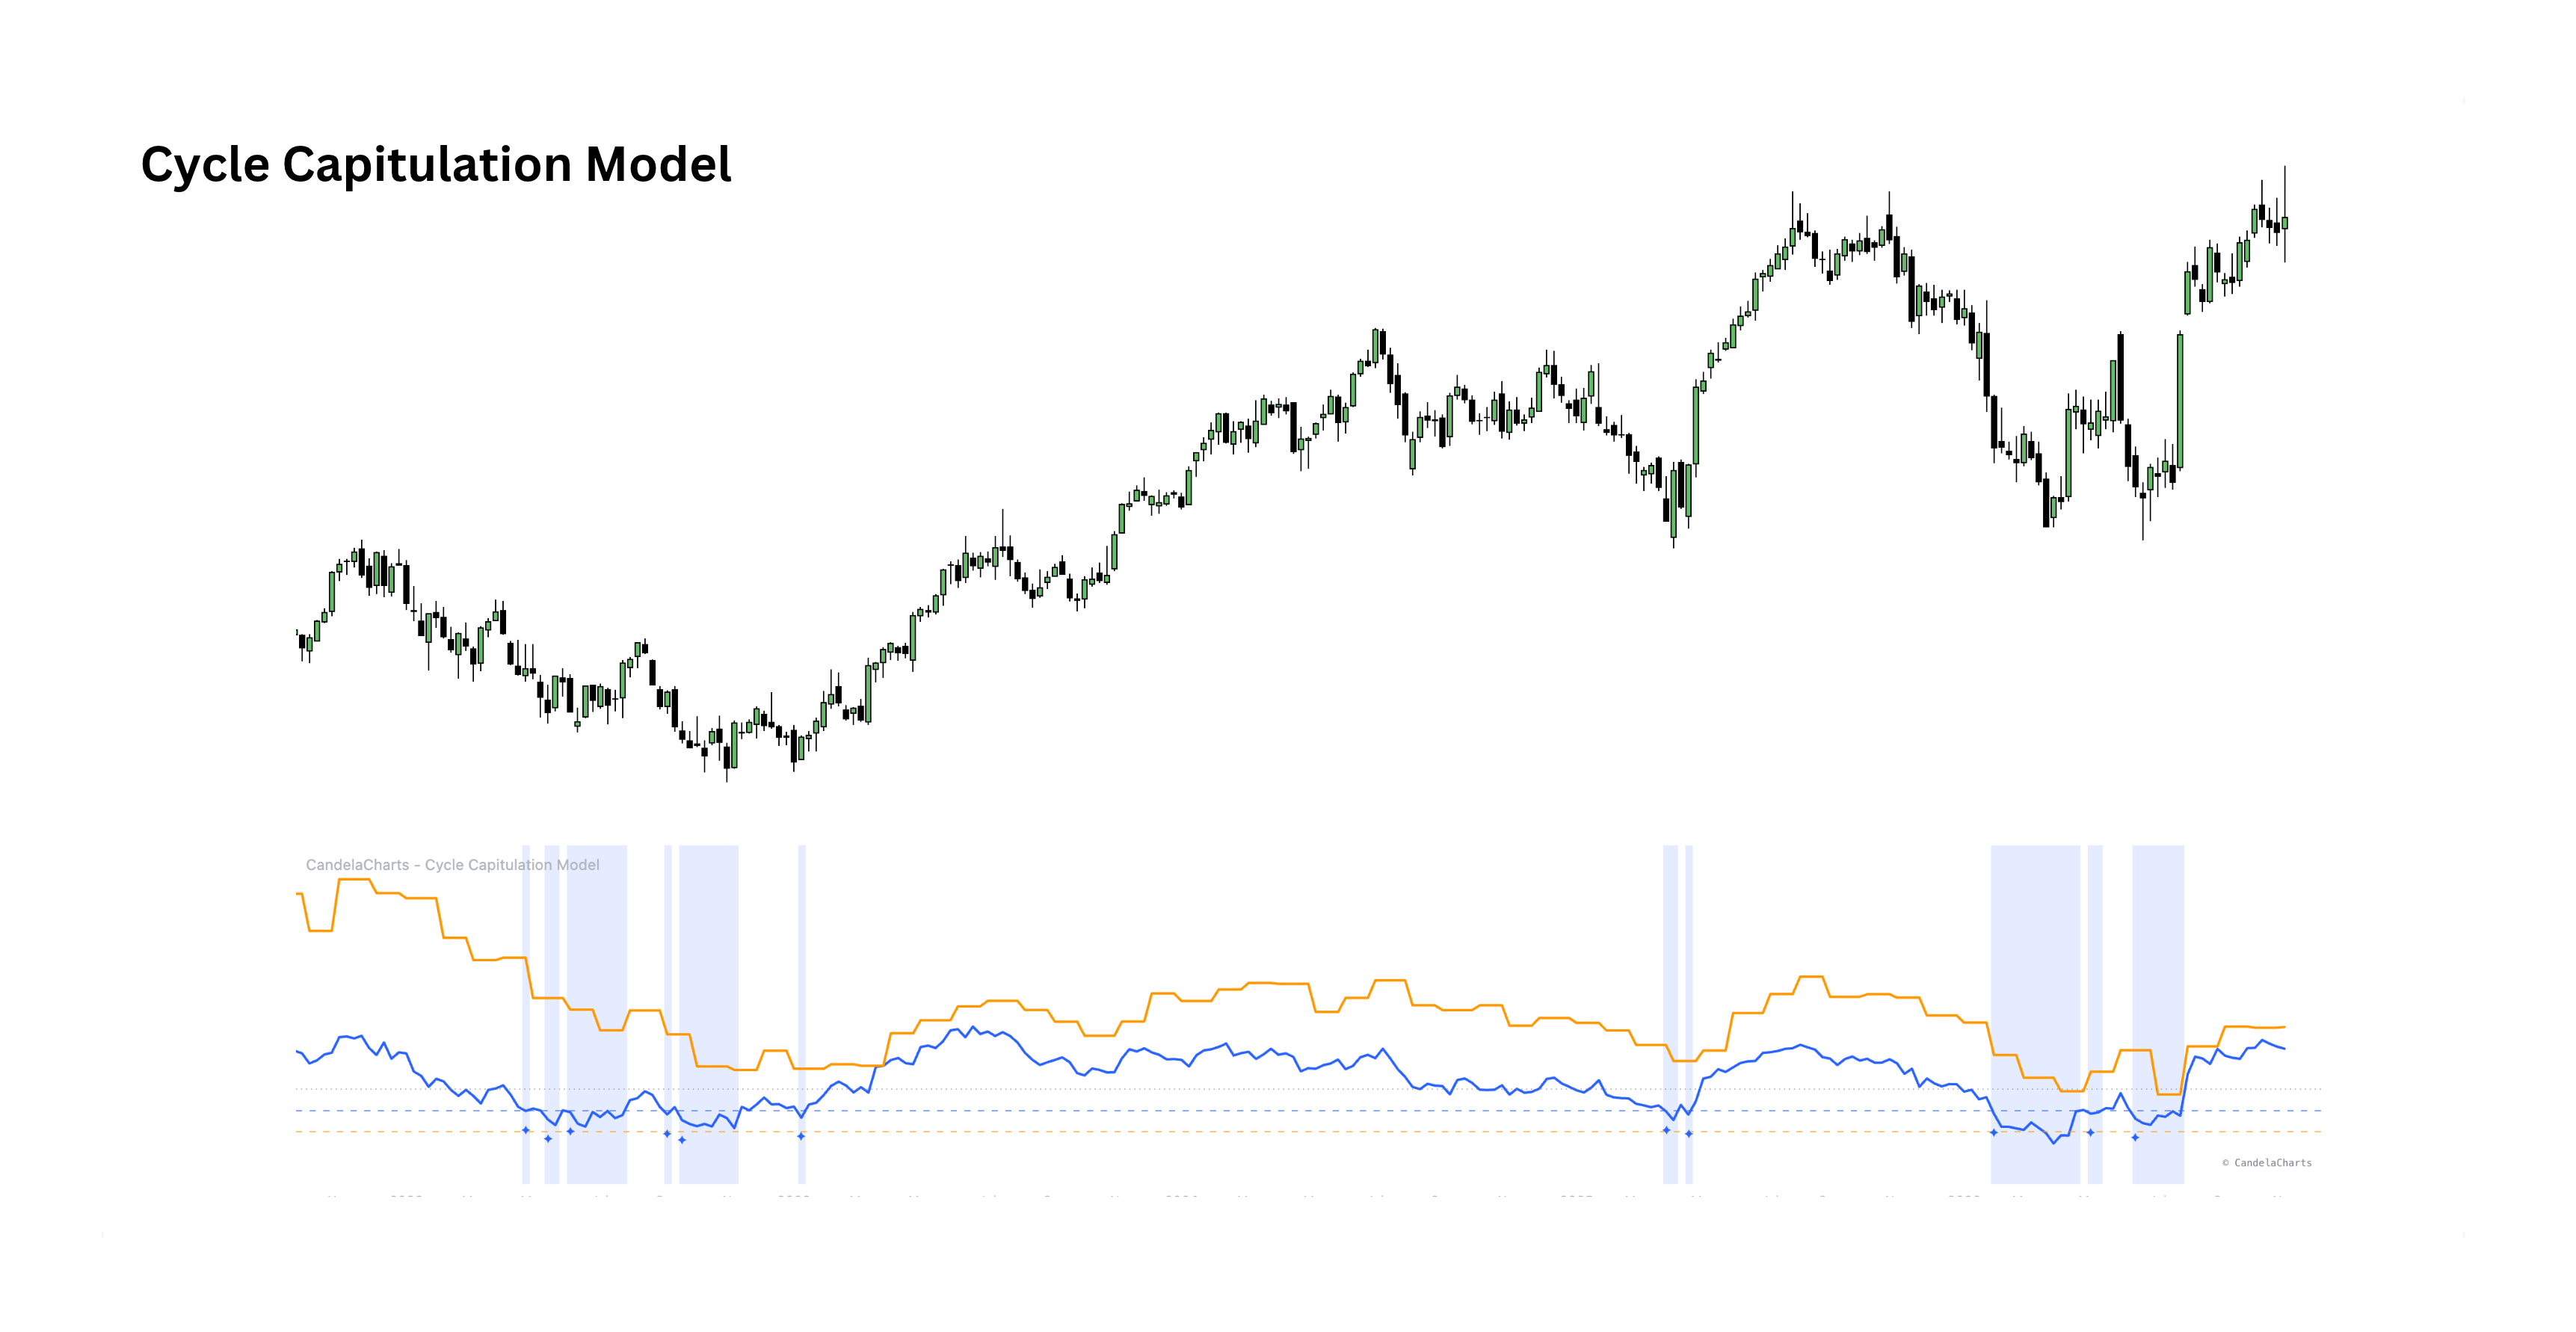
Cycle Capitulation Model

Tactical & generational dipsView indicator
How far price sits below its 200-day and 48-month averages — the tactical and generational capitulation thresholds, shaded while either is active.
Tactical ThresholdPrice 10% or more below its 200-day average.
Generational ThresholdPrice 20% or more below its 48-month average.
Dual CapitulationBoth clocks active at once, shaded as the extreme reading.
Dynamic Exposure Model preview

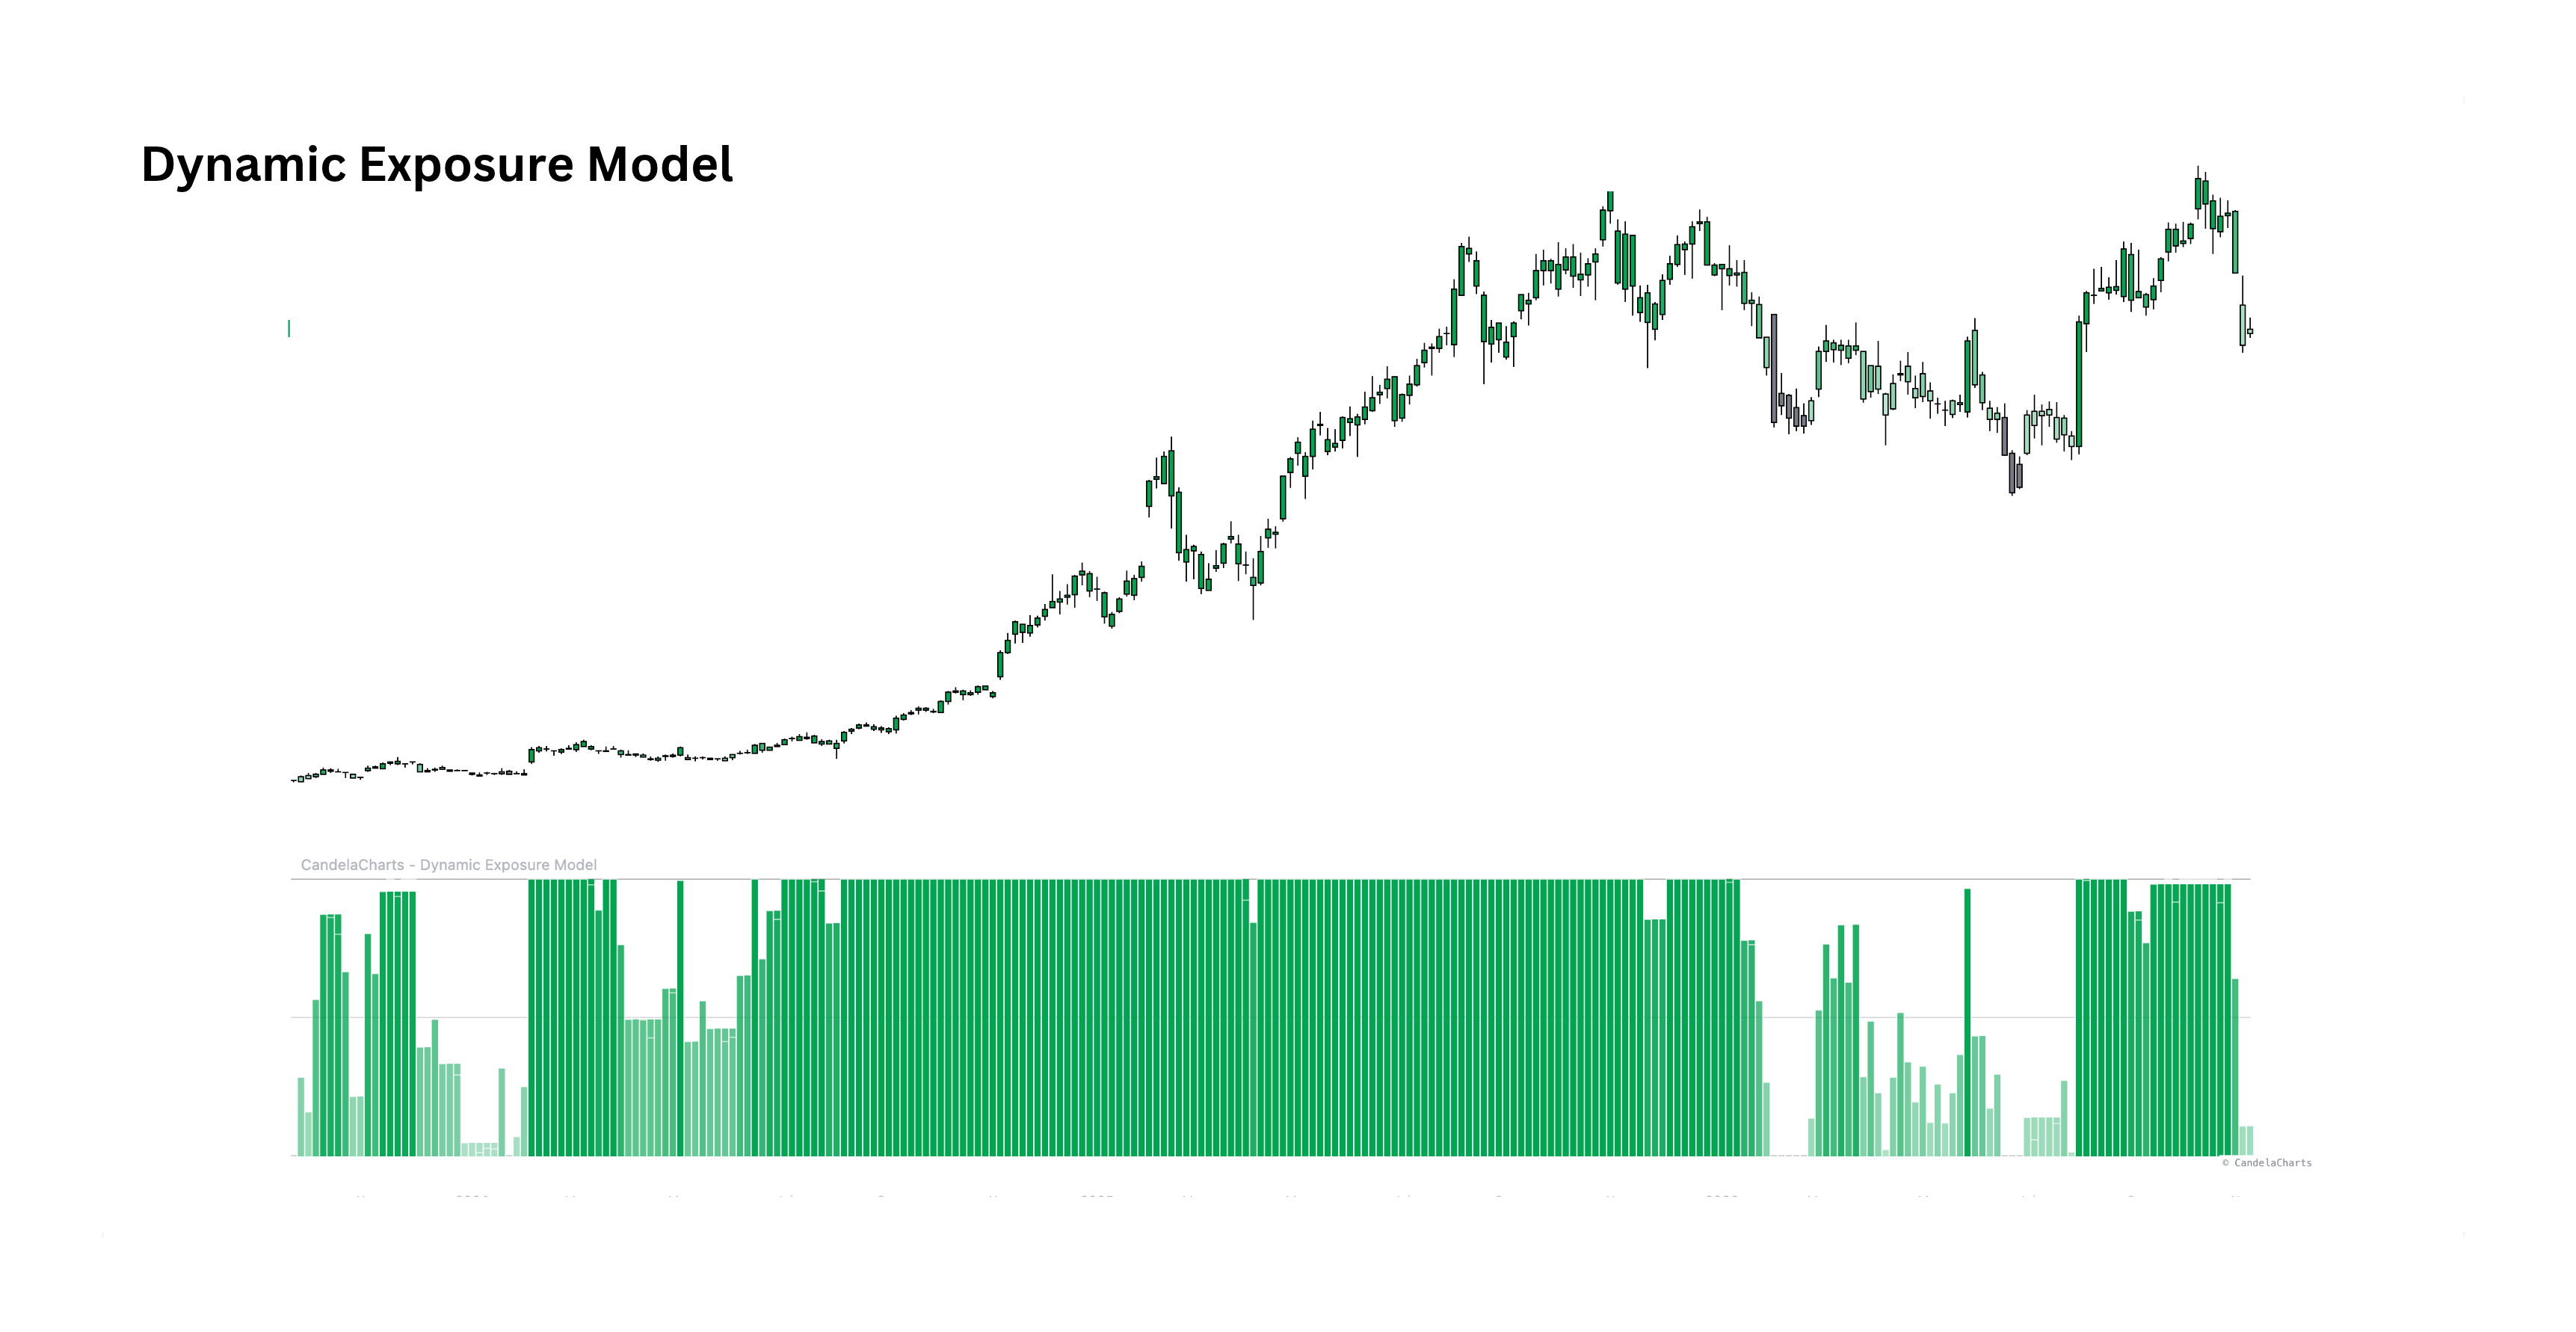
Dynamic Exposure Model

Position sizingView indicator
A position sizer: volatility-scaled momentum across six horizons, cut back whenever the asset's own volatility runs above normal, and held until the target drifts.
Volatility-Scaled MomentumSix horizons scored in units of the asset's own volatility.
Exposure TargetTurns trend strength into a 0–100% position target.
Rebalance BandHolds the position steady until the target drifts far enough.
Altseason Index preview

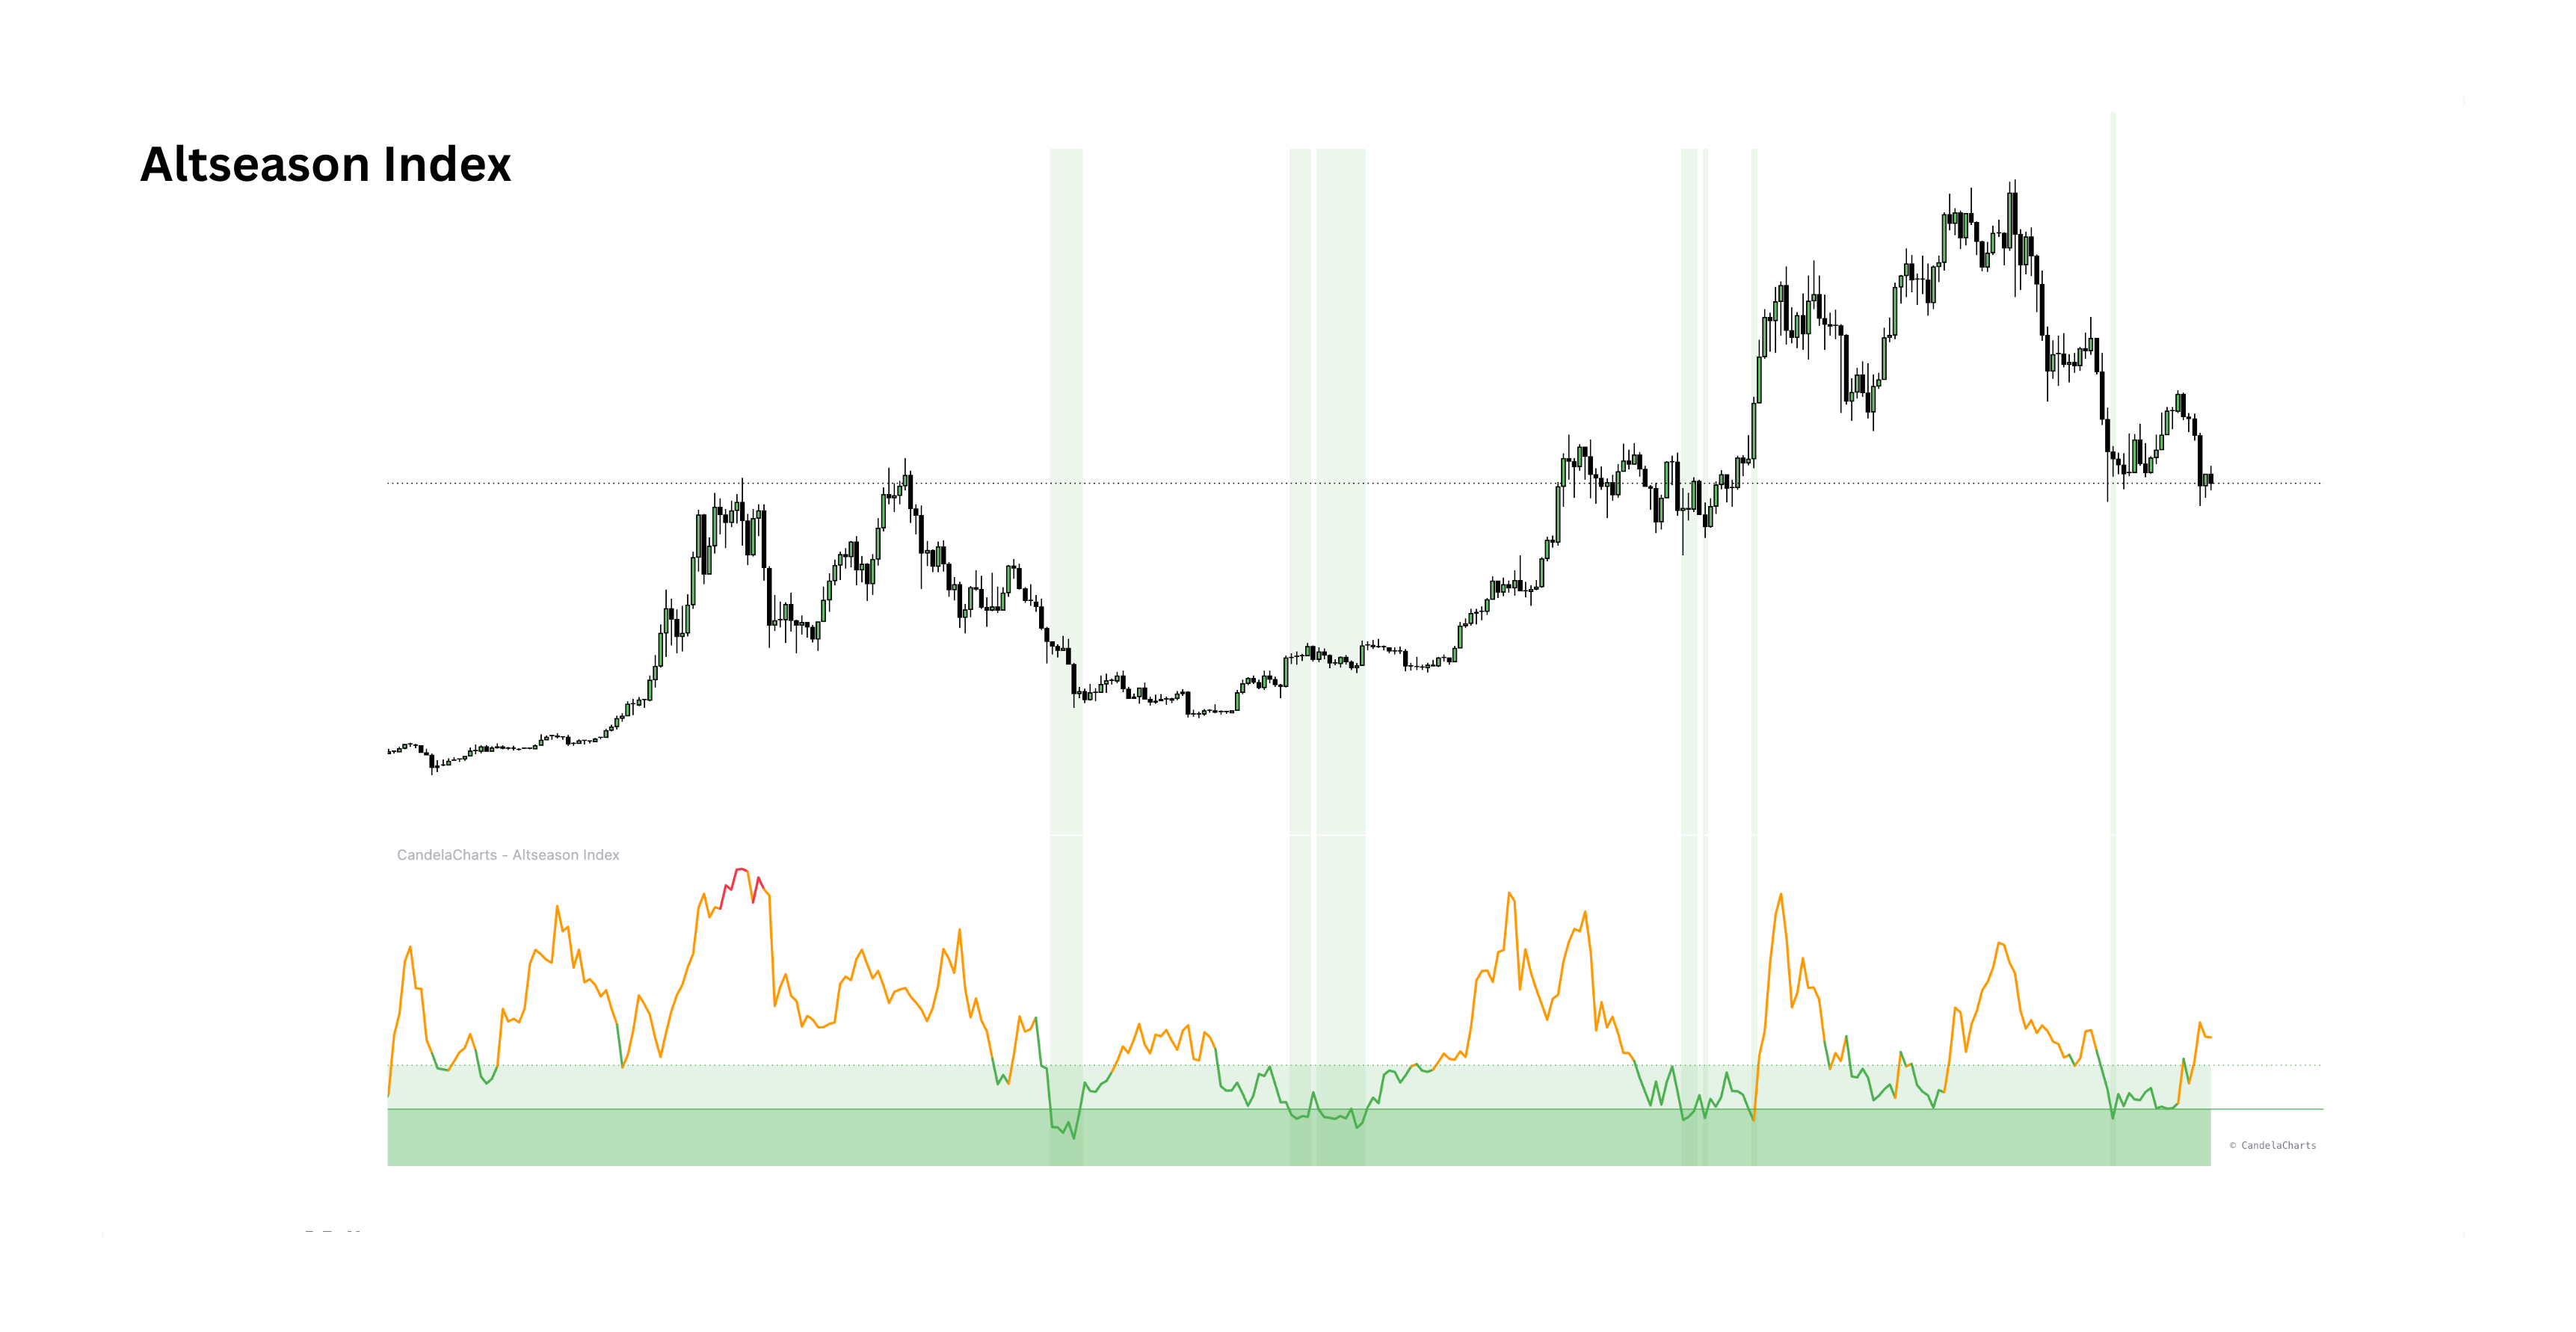
Altseason Index

Altcoin rotationView indicator
A multi-metric composite oscillator gauging whether capital is flowing toward Bitcoin or altcoins — aggregating four independent metrics into a single noise-reduced 0–100 index.
Composite ScoreFour metrics aggregated into one 0–100 oscillator.
Opportunity ZonesTiered gradients for opportunity under 30 and deep opportunity under 20.
CustomizableComponent weights, timeframes and inputs are fully configurable.
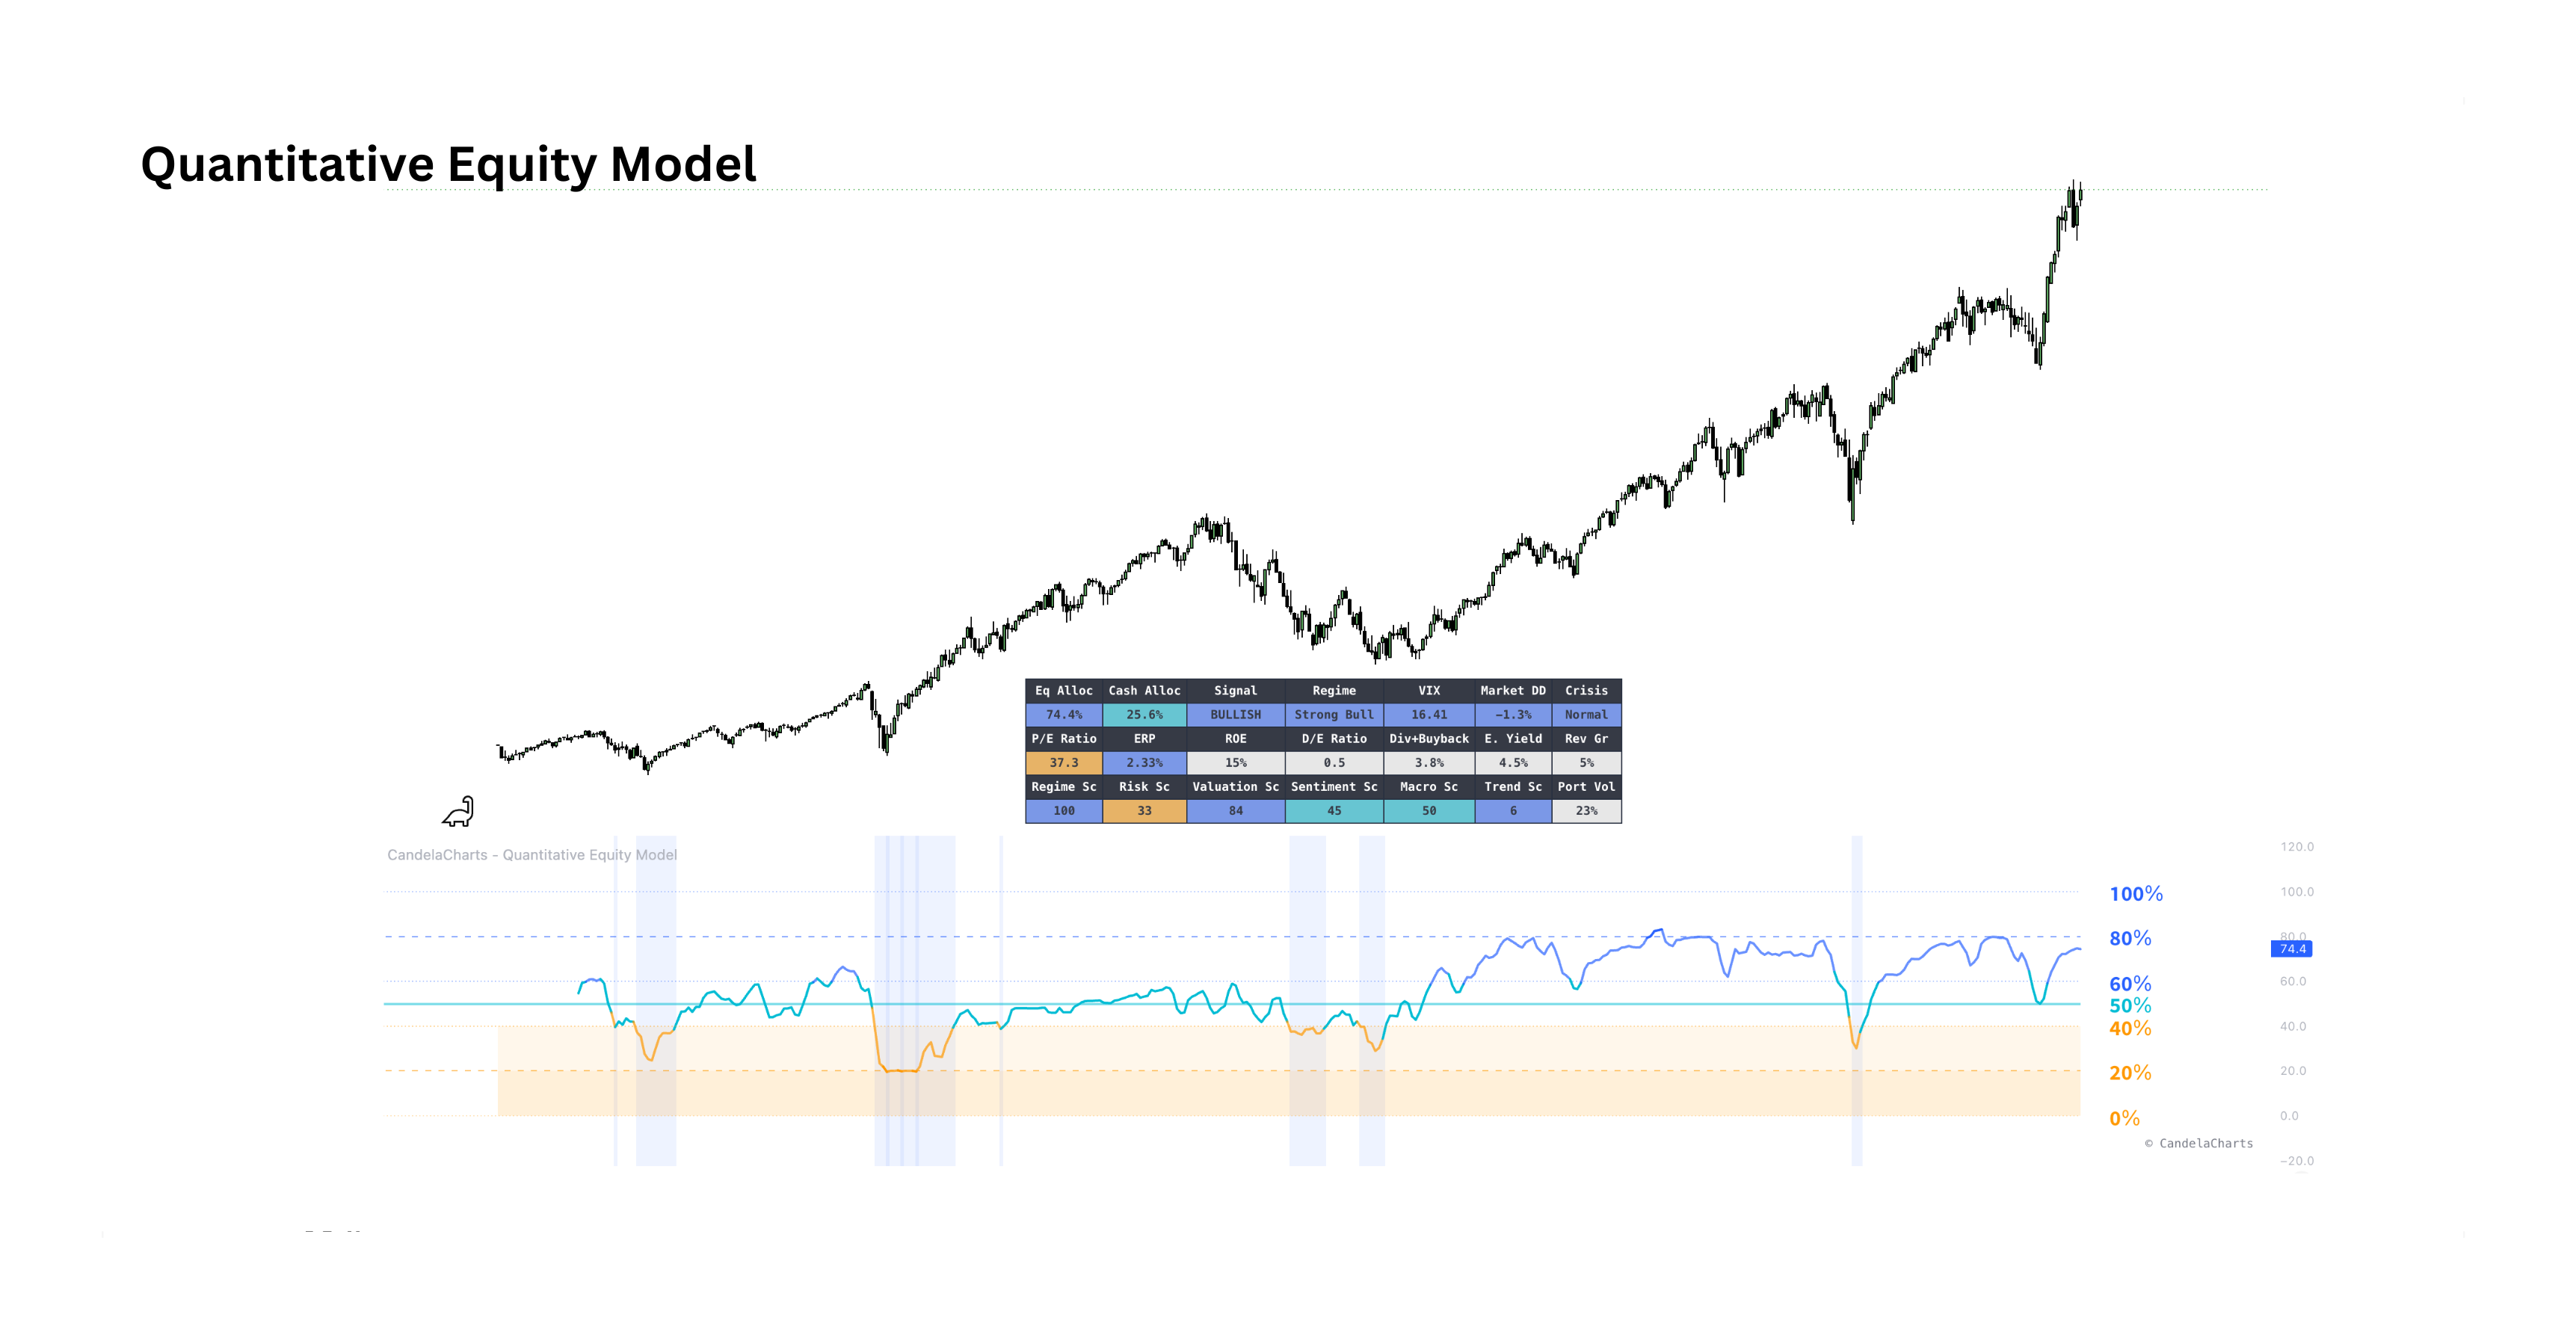
Quantitative Equity Model preview

Quantitative Equity Model

Five-pillar allocationView indicator
An institutional-grade allocation model synthesizing five market pillars — regime, risk, valuation, sentiment and macro — into a dynamic 0–100% equity weighting, with automated crisis detection to de-risk in extreme conditions.
Five-Pillar FrameworkRegime, risk, valuation, sentiment and macro with configurable weights.
Dynamic AllocationOutputs an optimal equity exposure from 0% to 100%.
Crisis DetectionOverrides allocations when VIX, drawdowns or credit spreads explode.
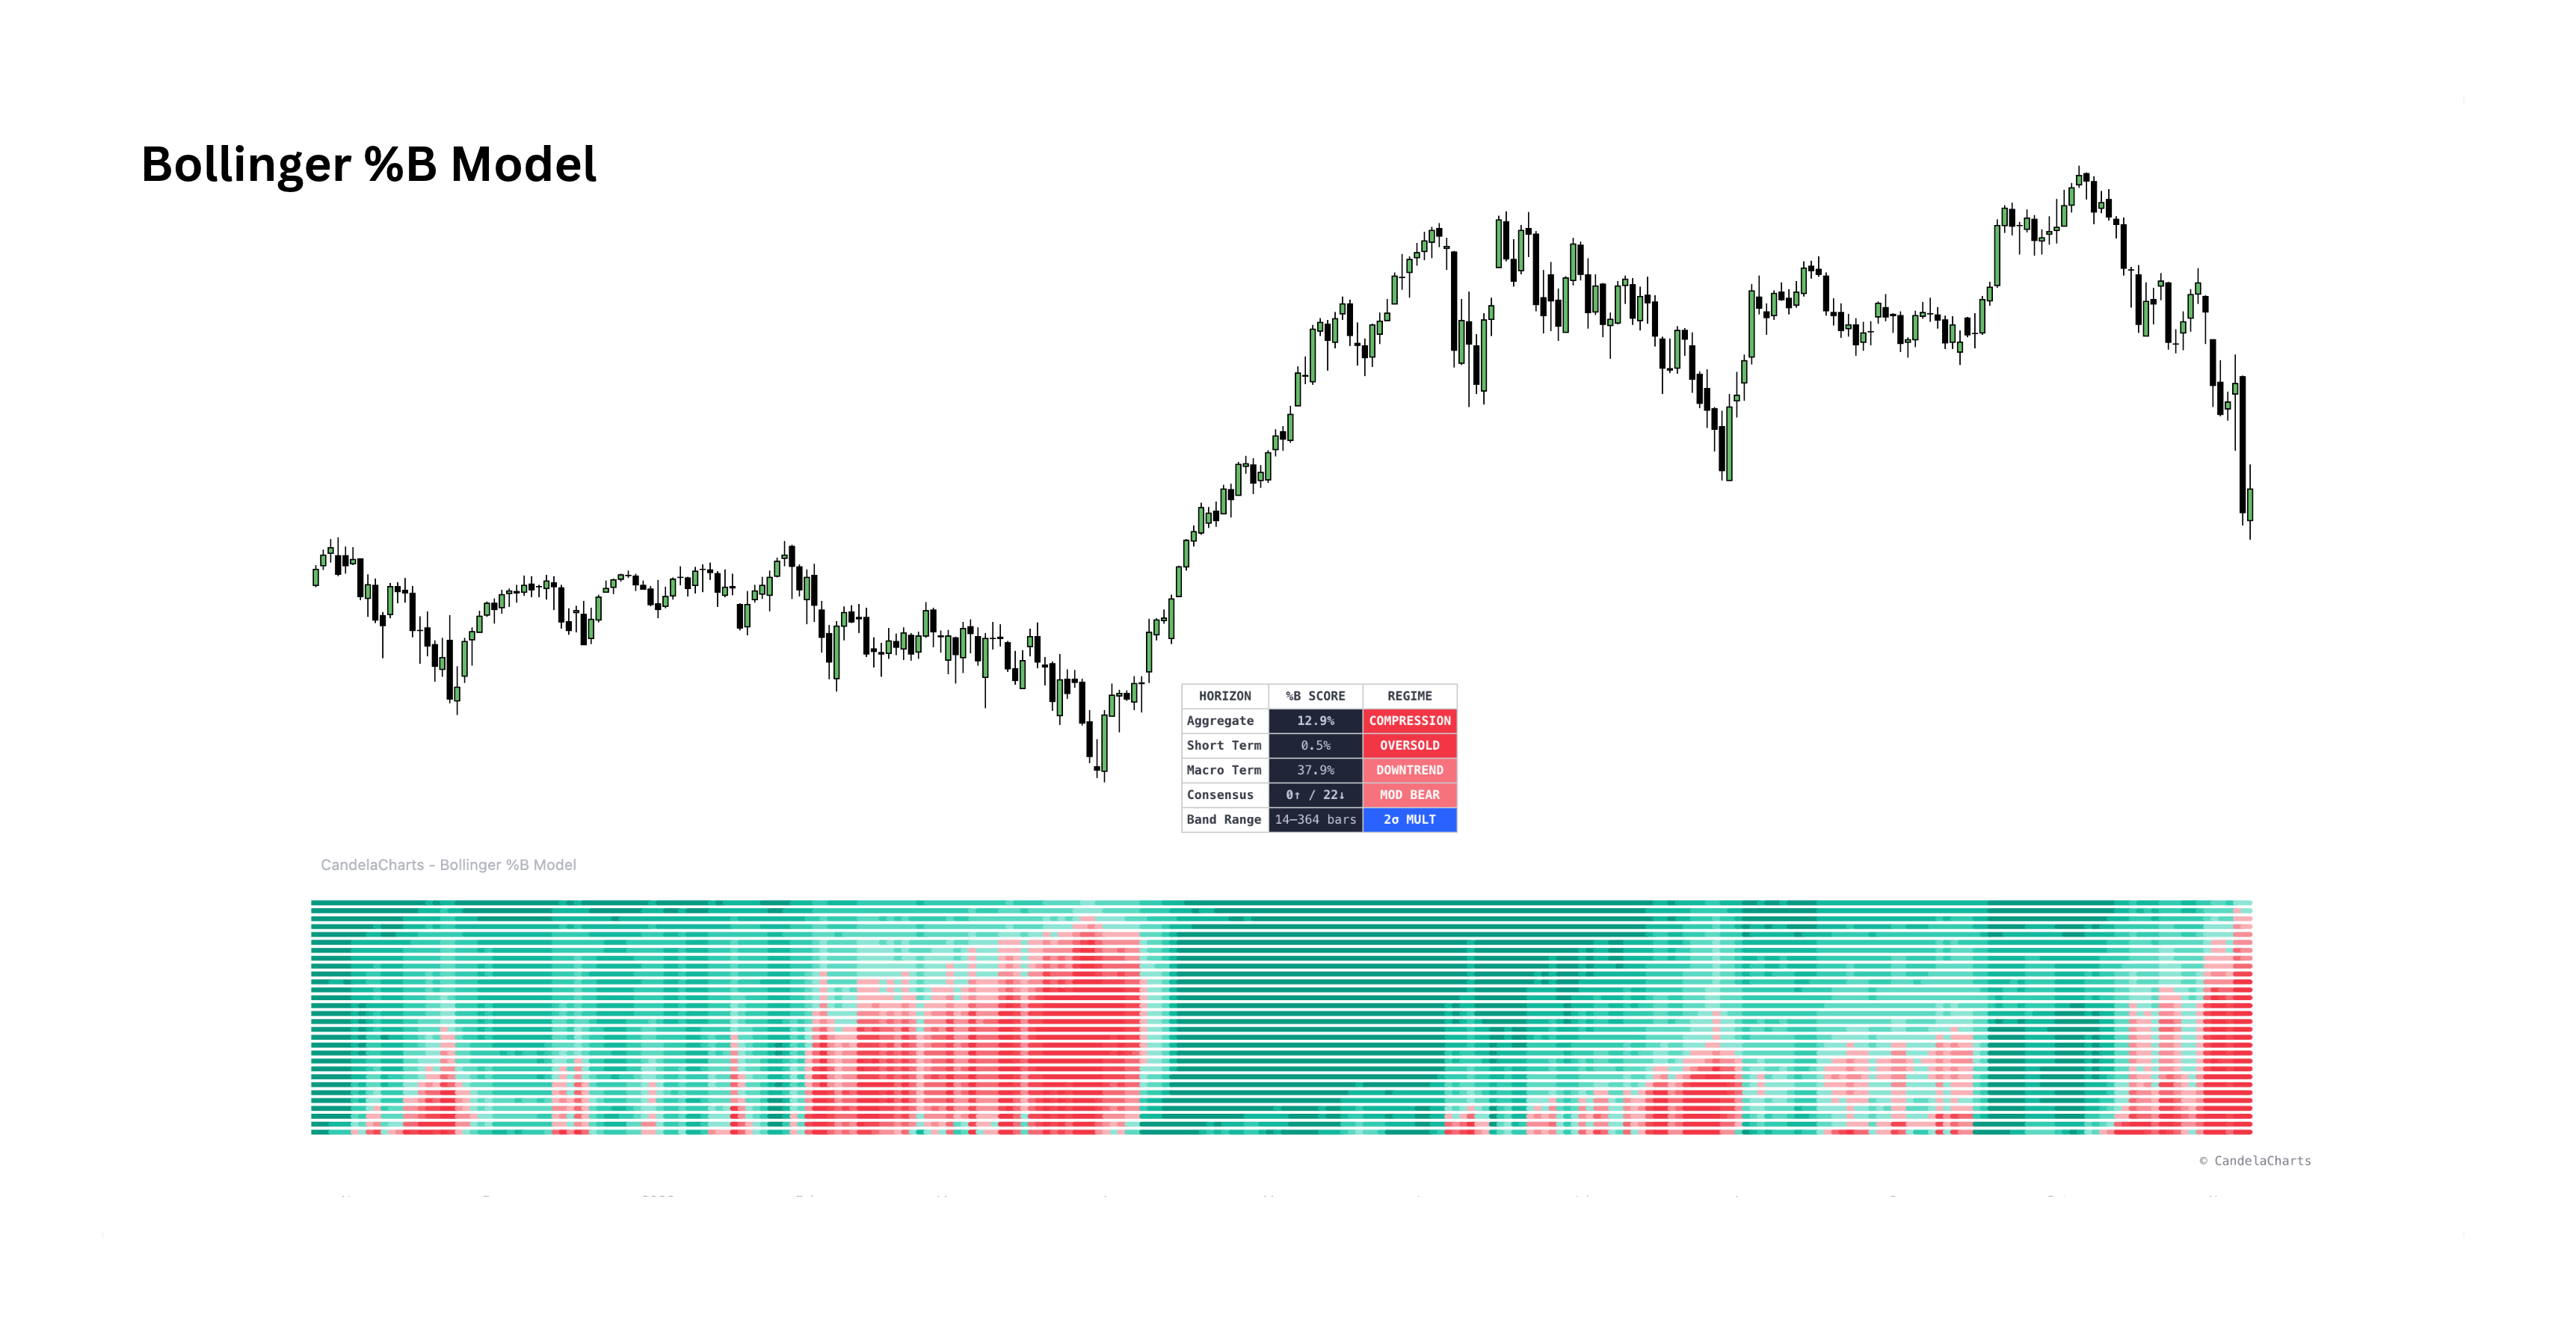
Bollinger %B Model preview

Bollinger %B Model

Multi-horizon bandsView indicator
Thirty Bollinger %B horizons stacked into one heatmap ribbon — where the close sits inside every band from 14 to 364 bars, and whether they agree.
Thirty HorizonsBands from 14 to 364 bars stacked into one heatmap ribbon.
Consensus CountCounts how many horizons are stretched up or down.
Regime PanelExpansion, compression and short- versus macro-term readings.
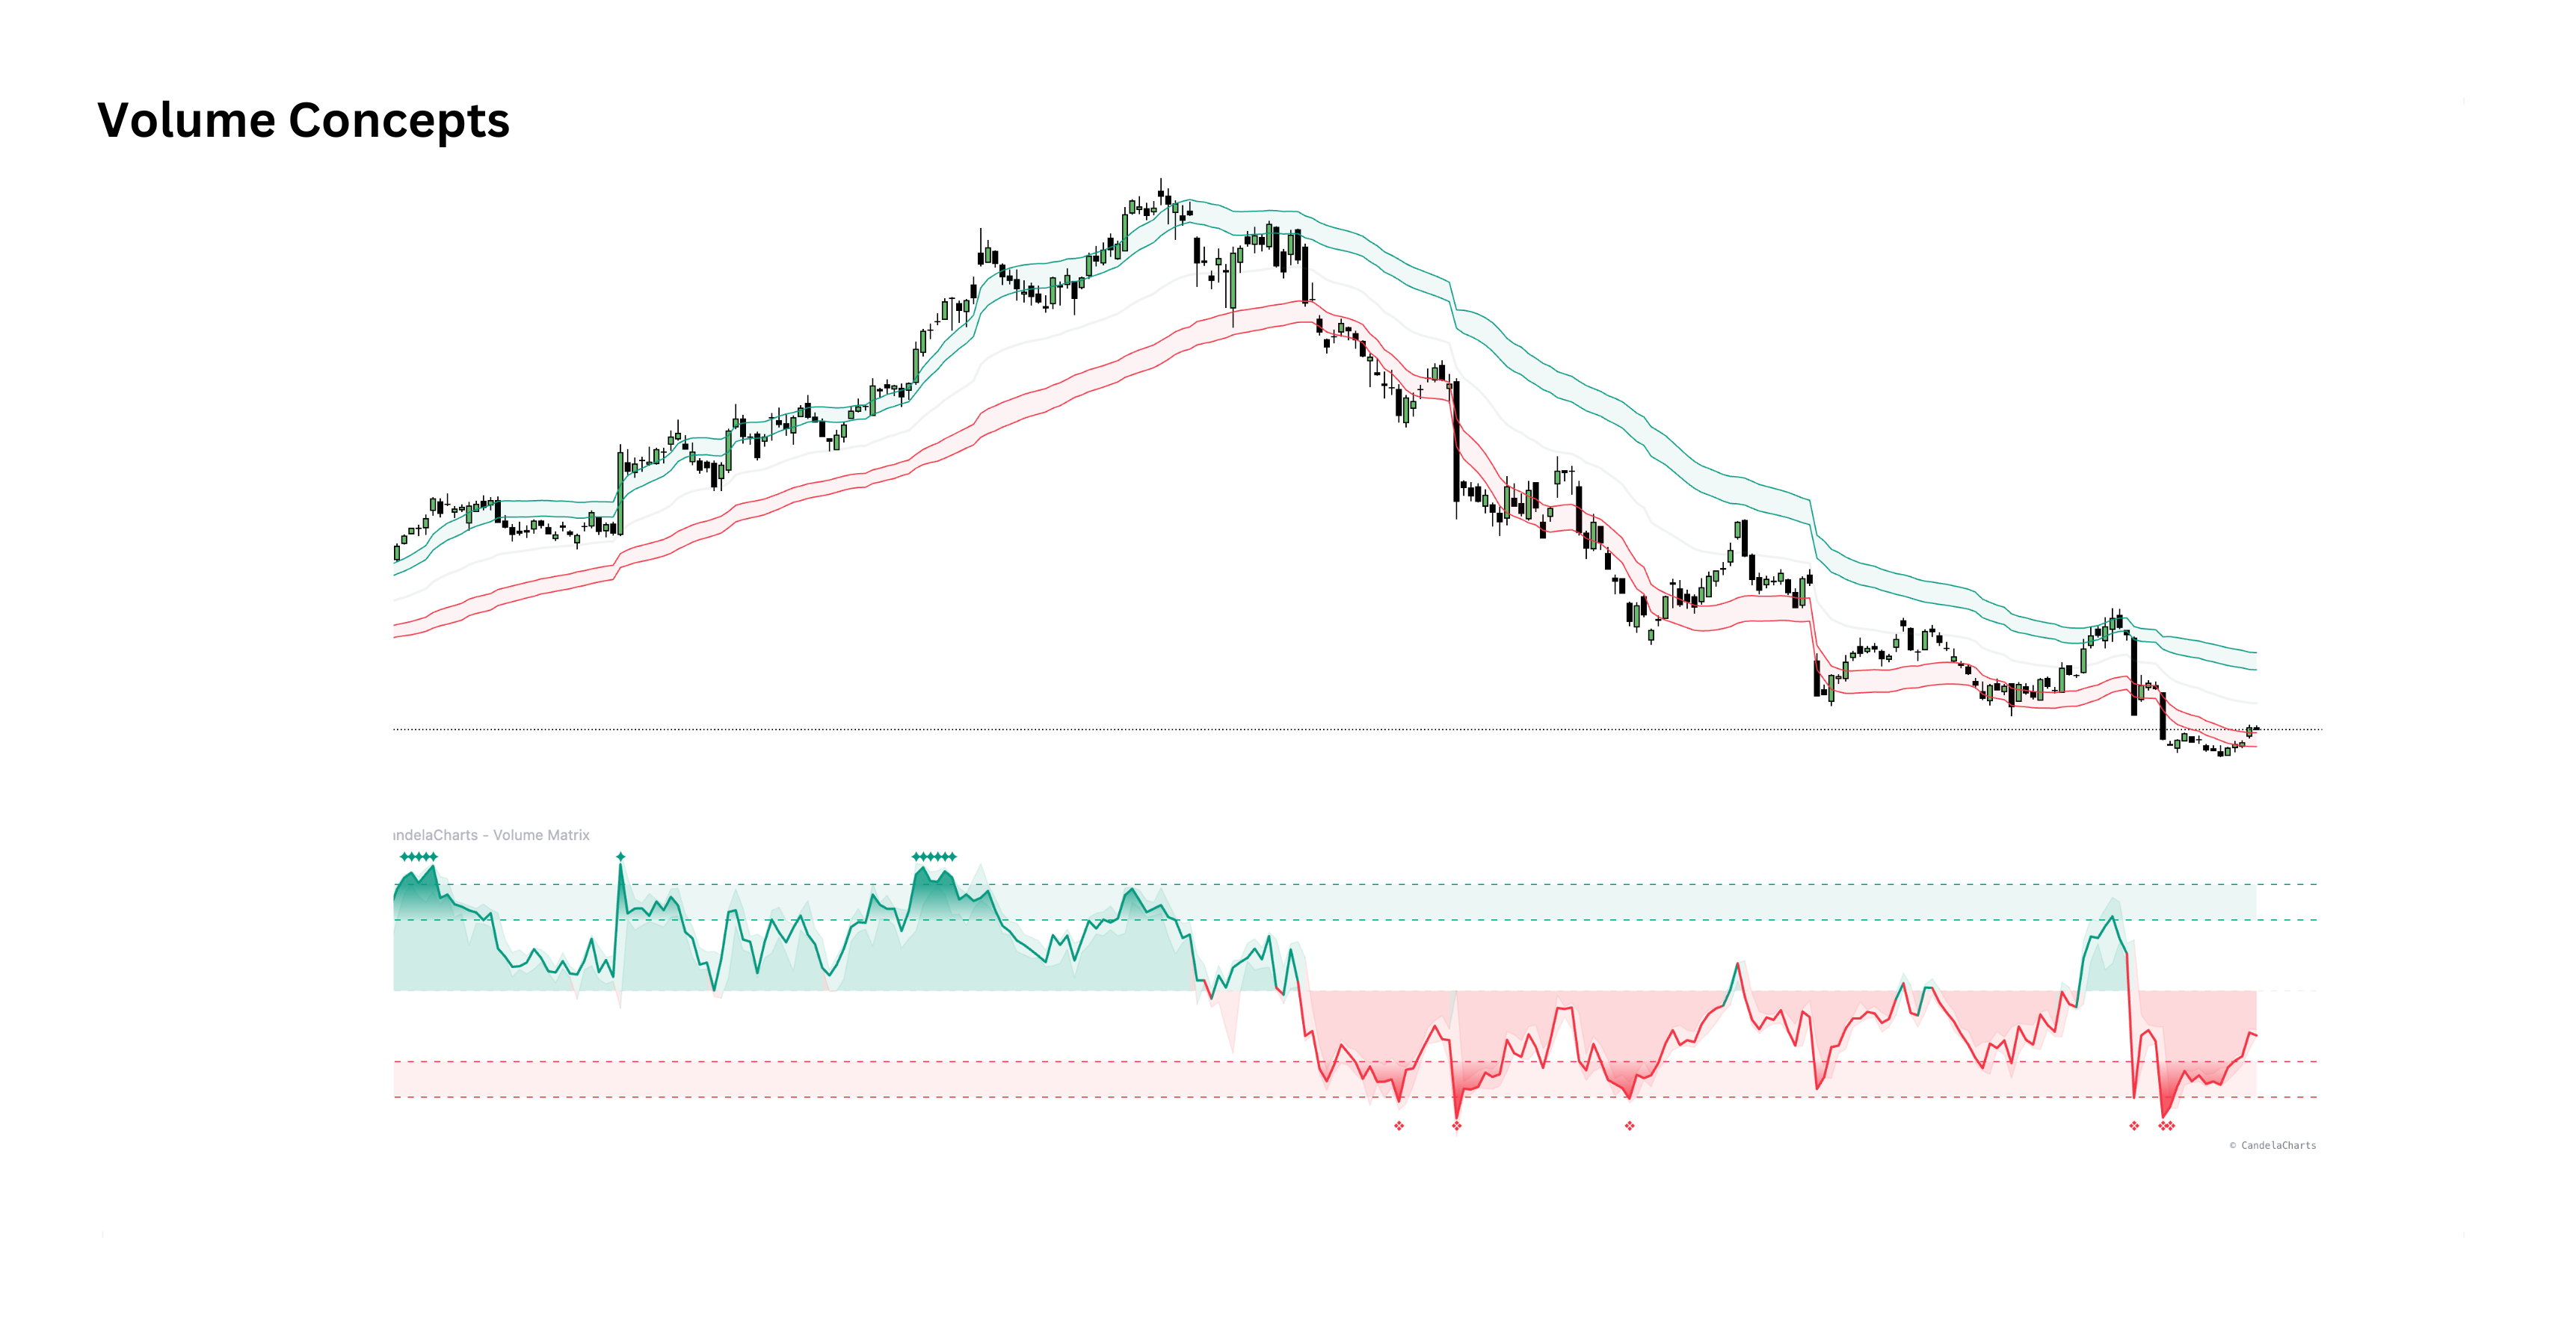
Volume Concepts preview

Volume Concepts

Statistical breakout & exhaustionView indicator
A statistical breakout and exhaustion indicator that adapts to market conditions using the Student-T Distribution — a single source of truth for shifts in volume-weighted fair value and high-probability reversal points.
Volume LineA normalized −1.5 to +1.5 oscillator around volume-weighted fair value.
Elastic Volatility BandsFour dynamic standard deviation bands as statistical price boundaries.
Exhaustion MarkersStar and diamond icons warning of exhaustion at deep ±1.5 extremes.
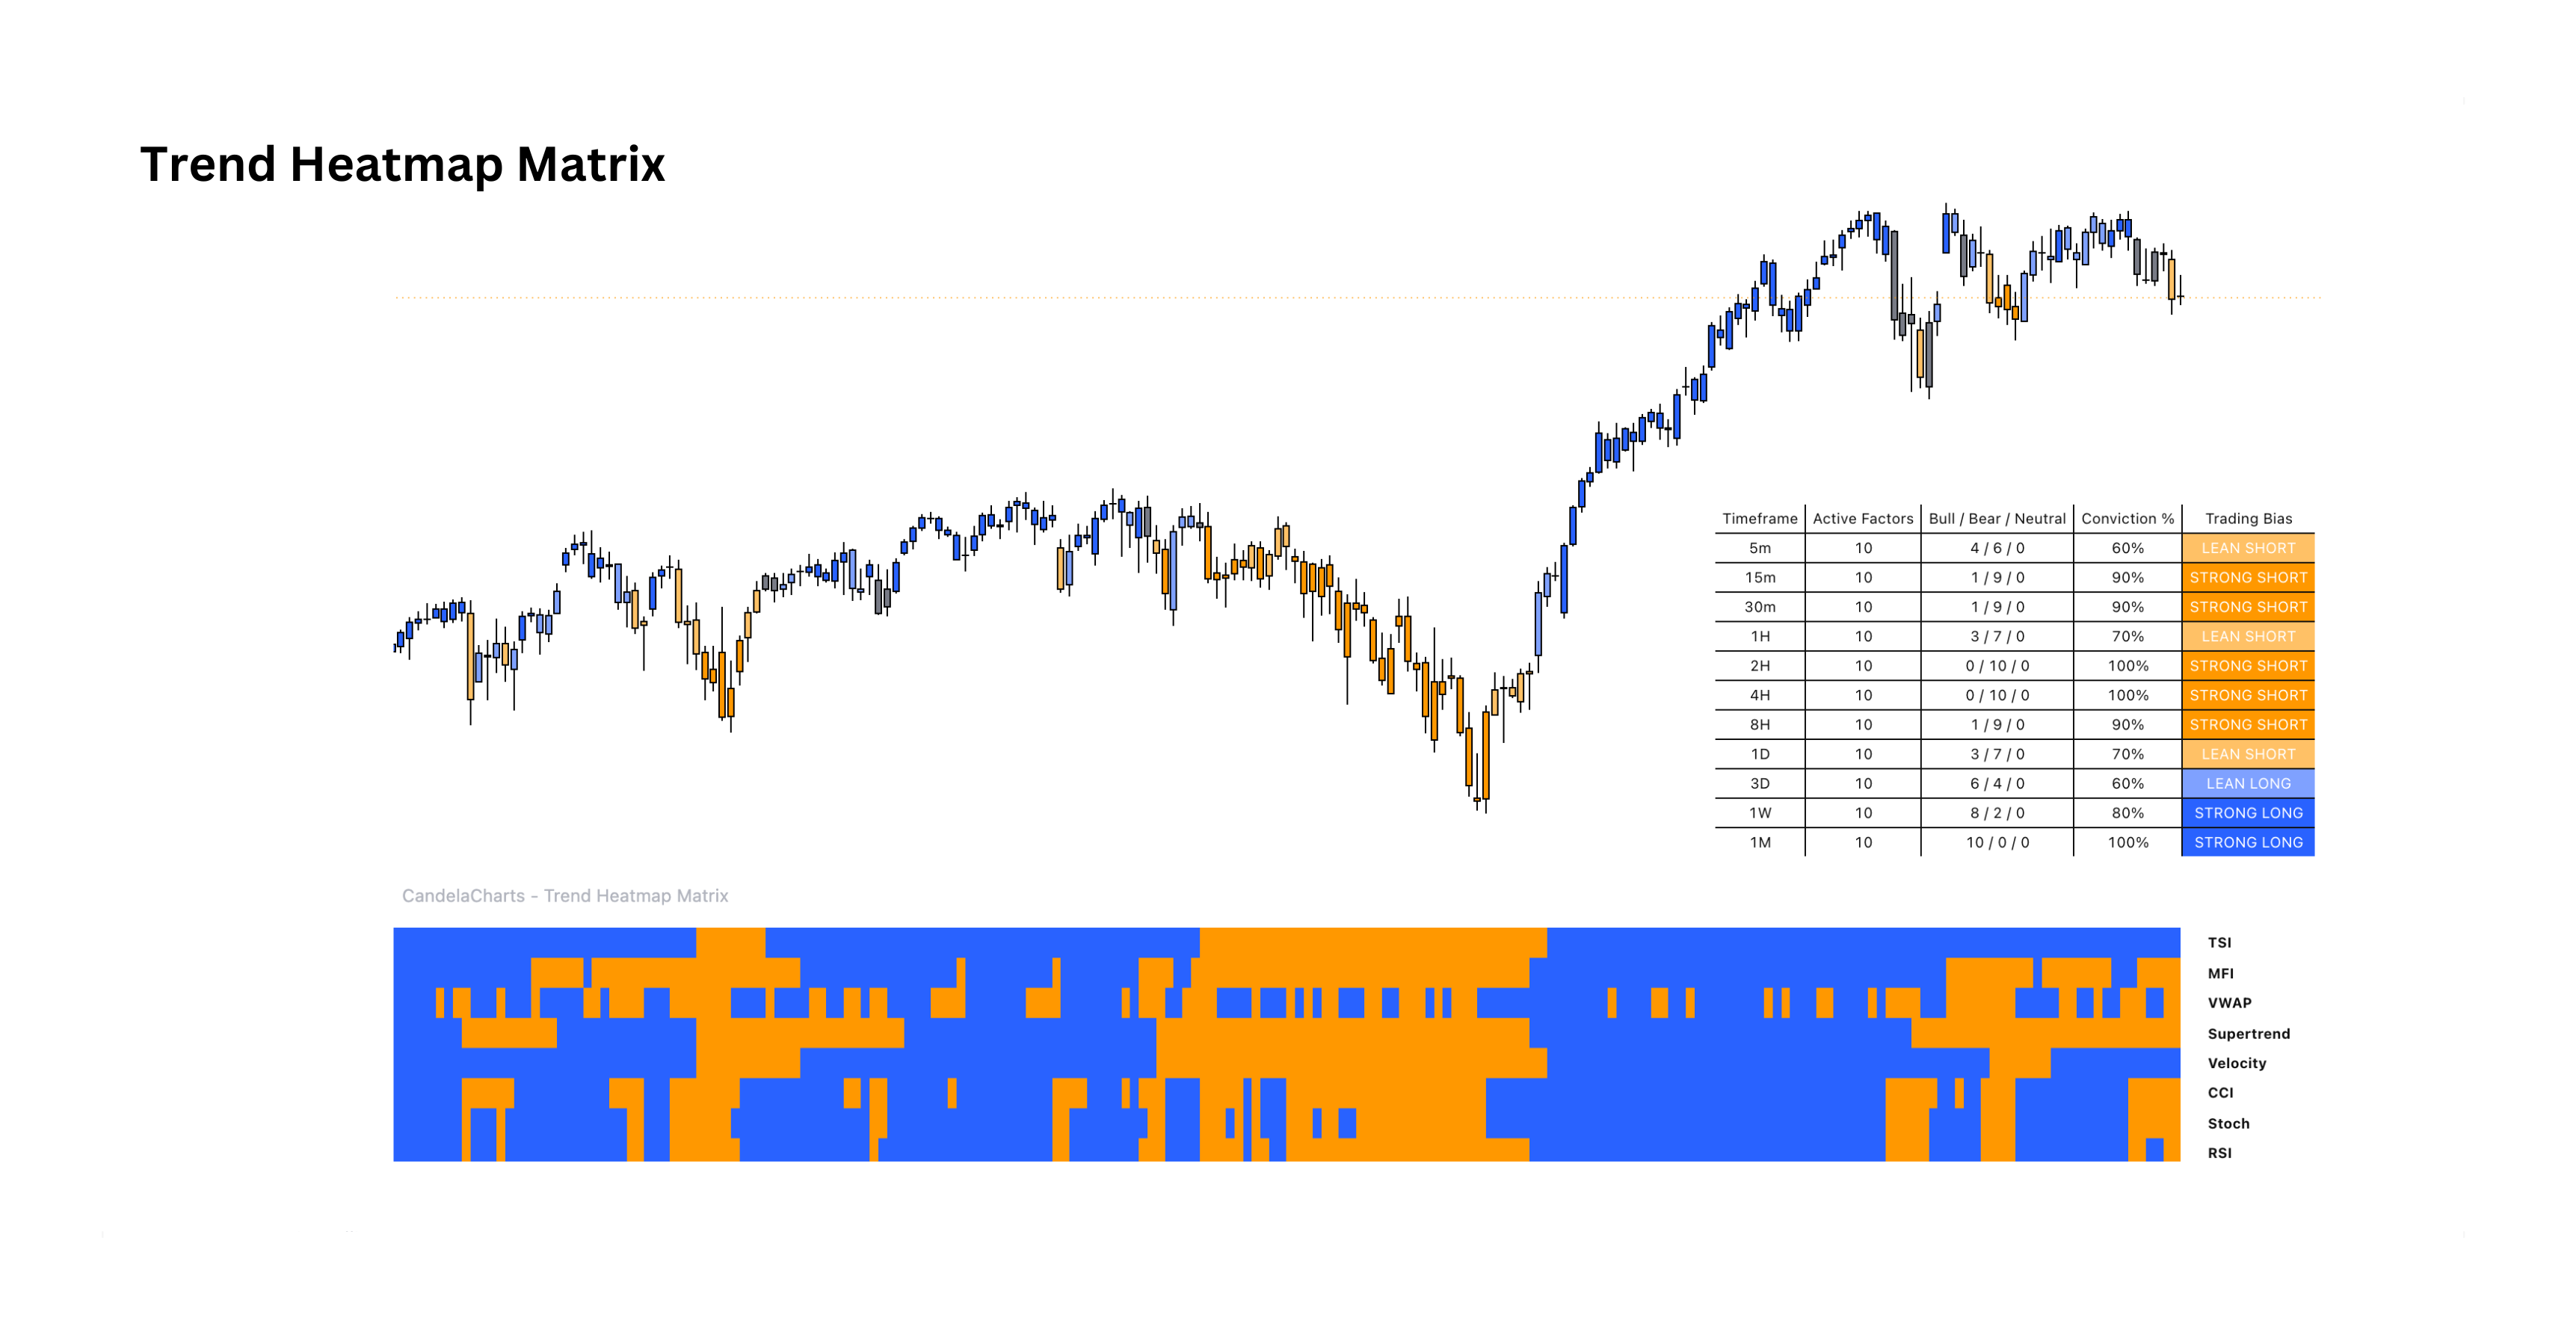
Trend Heatmap Matrix preview

Trend Heatmap Matrix

12-factor consensusView indicator
Aggregates 12 technical factors — momentum, trend direction, volume and volatility — into a single visual heatmap with a conviction dashboard, instead of cluttering the chart with a dozen separate indicators.
12-Factor HeatmapMACD, RSI, Stochastic, CCI, CMF, Supertrend, ADX/DMI, VWAP and more.
Conviction DashboardBulls vs bears summary with a conviction score and trading bias.
Trading ProfilesScalping, day trade, swing or investment profiles retune all components.
04

Ratios

Objective performance and risk readings — return against drawdown, volatility, downside and tail outcomes.
Calmar Ratio preview

Calmar Ratio

Return vs drawdownView indicator
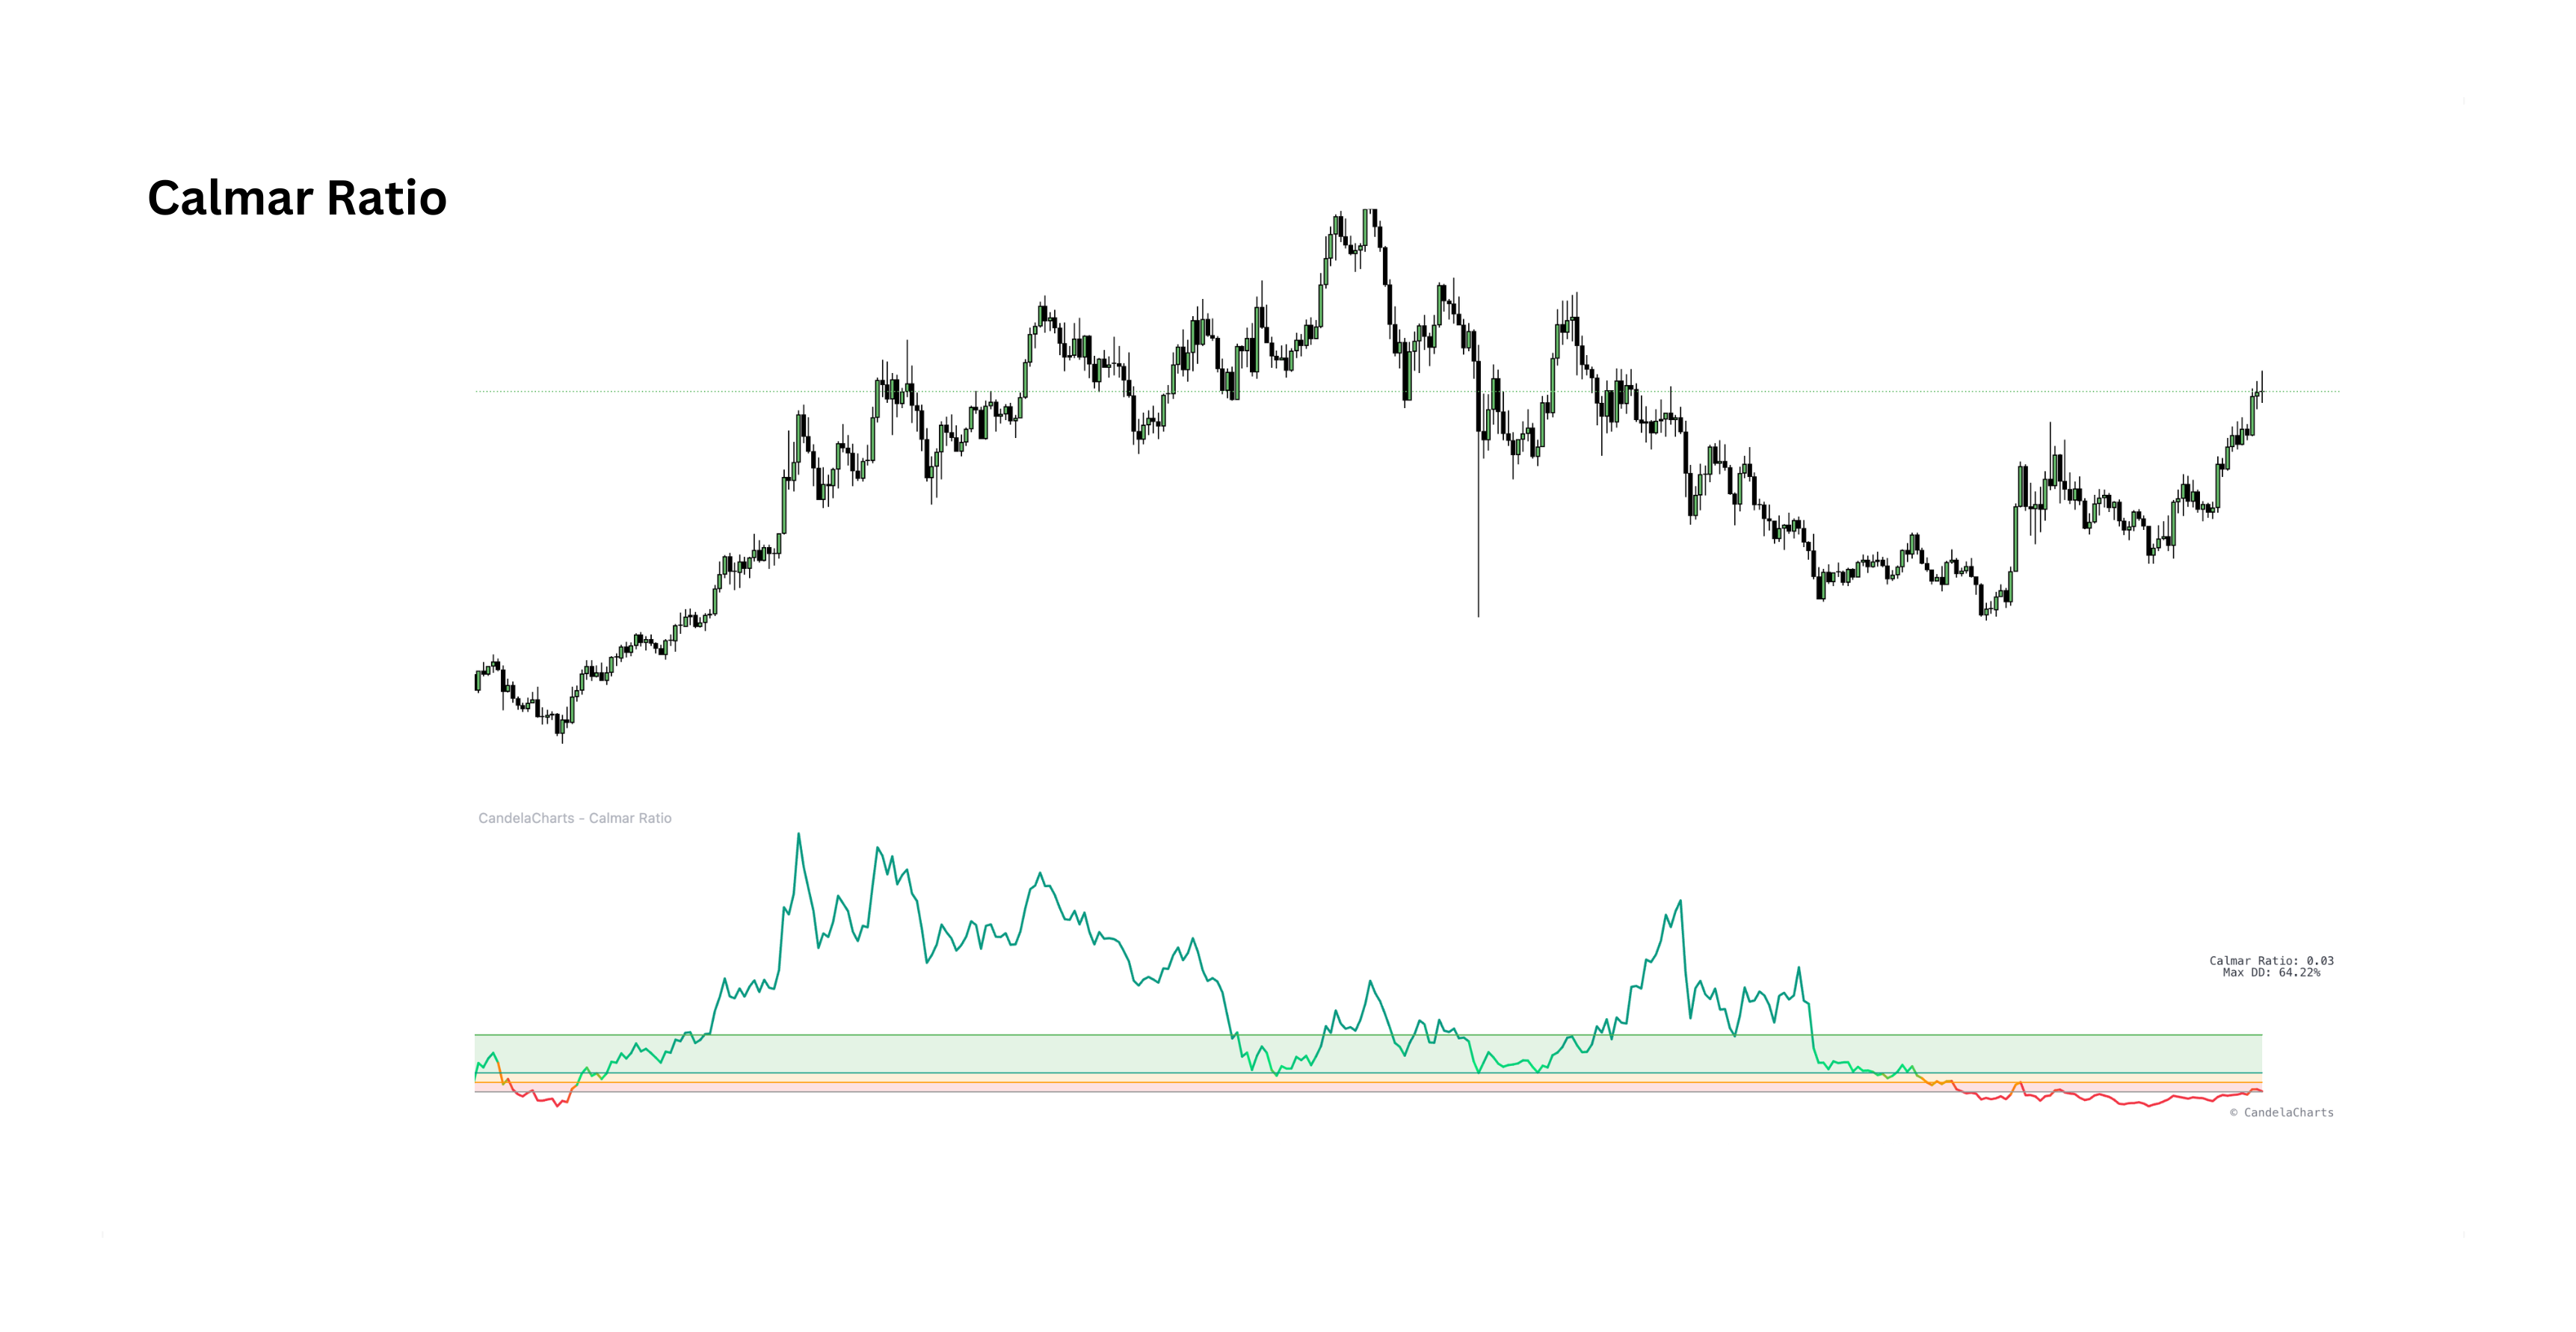
Compares an asset's Compound Annual Growth Rate to its Maximum Drawdown over the same period — using downside risk rather than volatility to quantify how efficient returns really are for capital preservation.
Time-Adjusted CAGRUses exact calendar seconds for a true annualized growth rate.
Max DrawdownTracks the deepest decline from any historical peak in the window.
Performance TiersClassifies results as weak, moderate, strong or exceptional.
Sharpe Ratio preview

Sharpe Ratio

Risk-adjusted returnView indicator
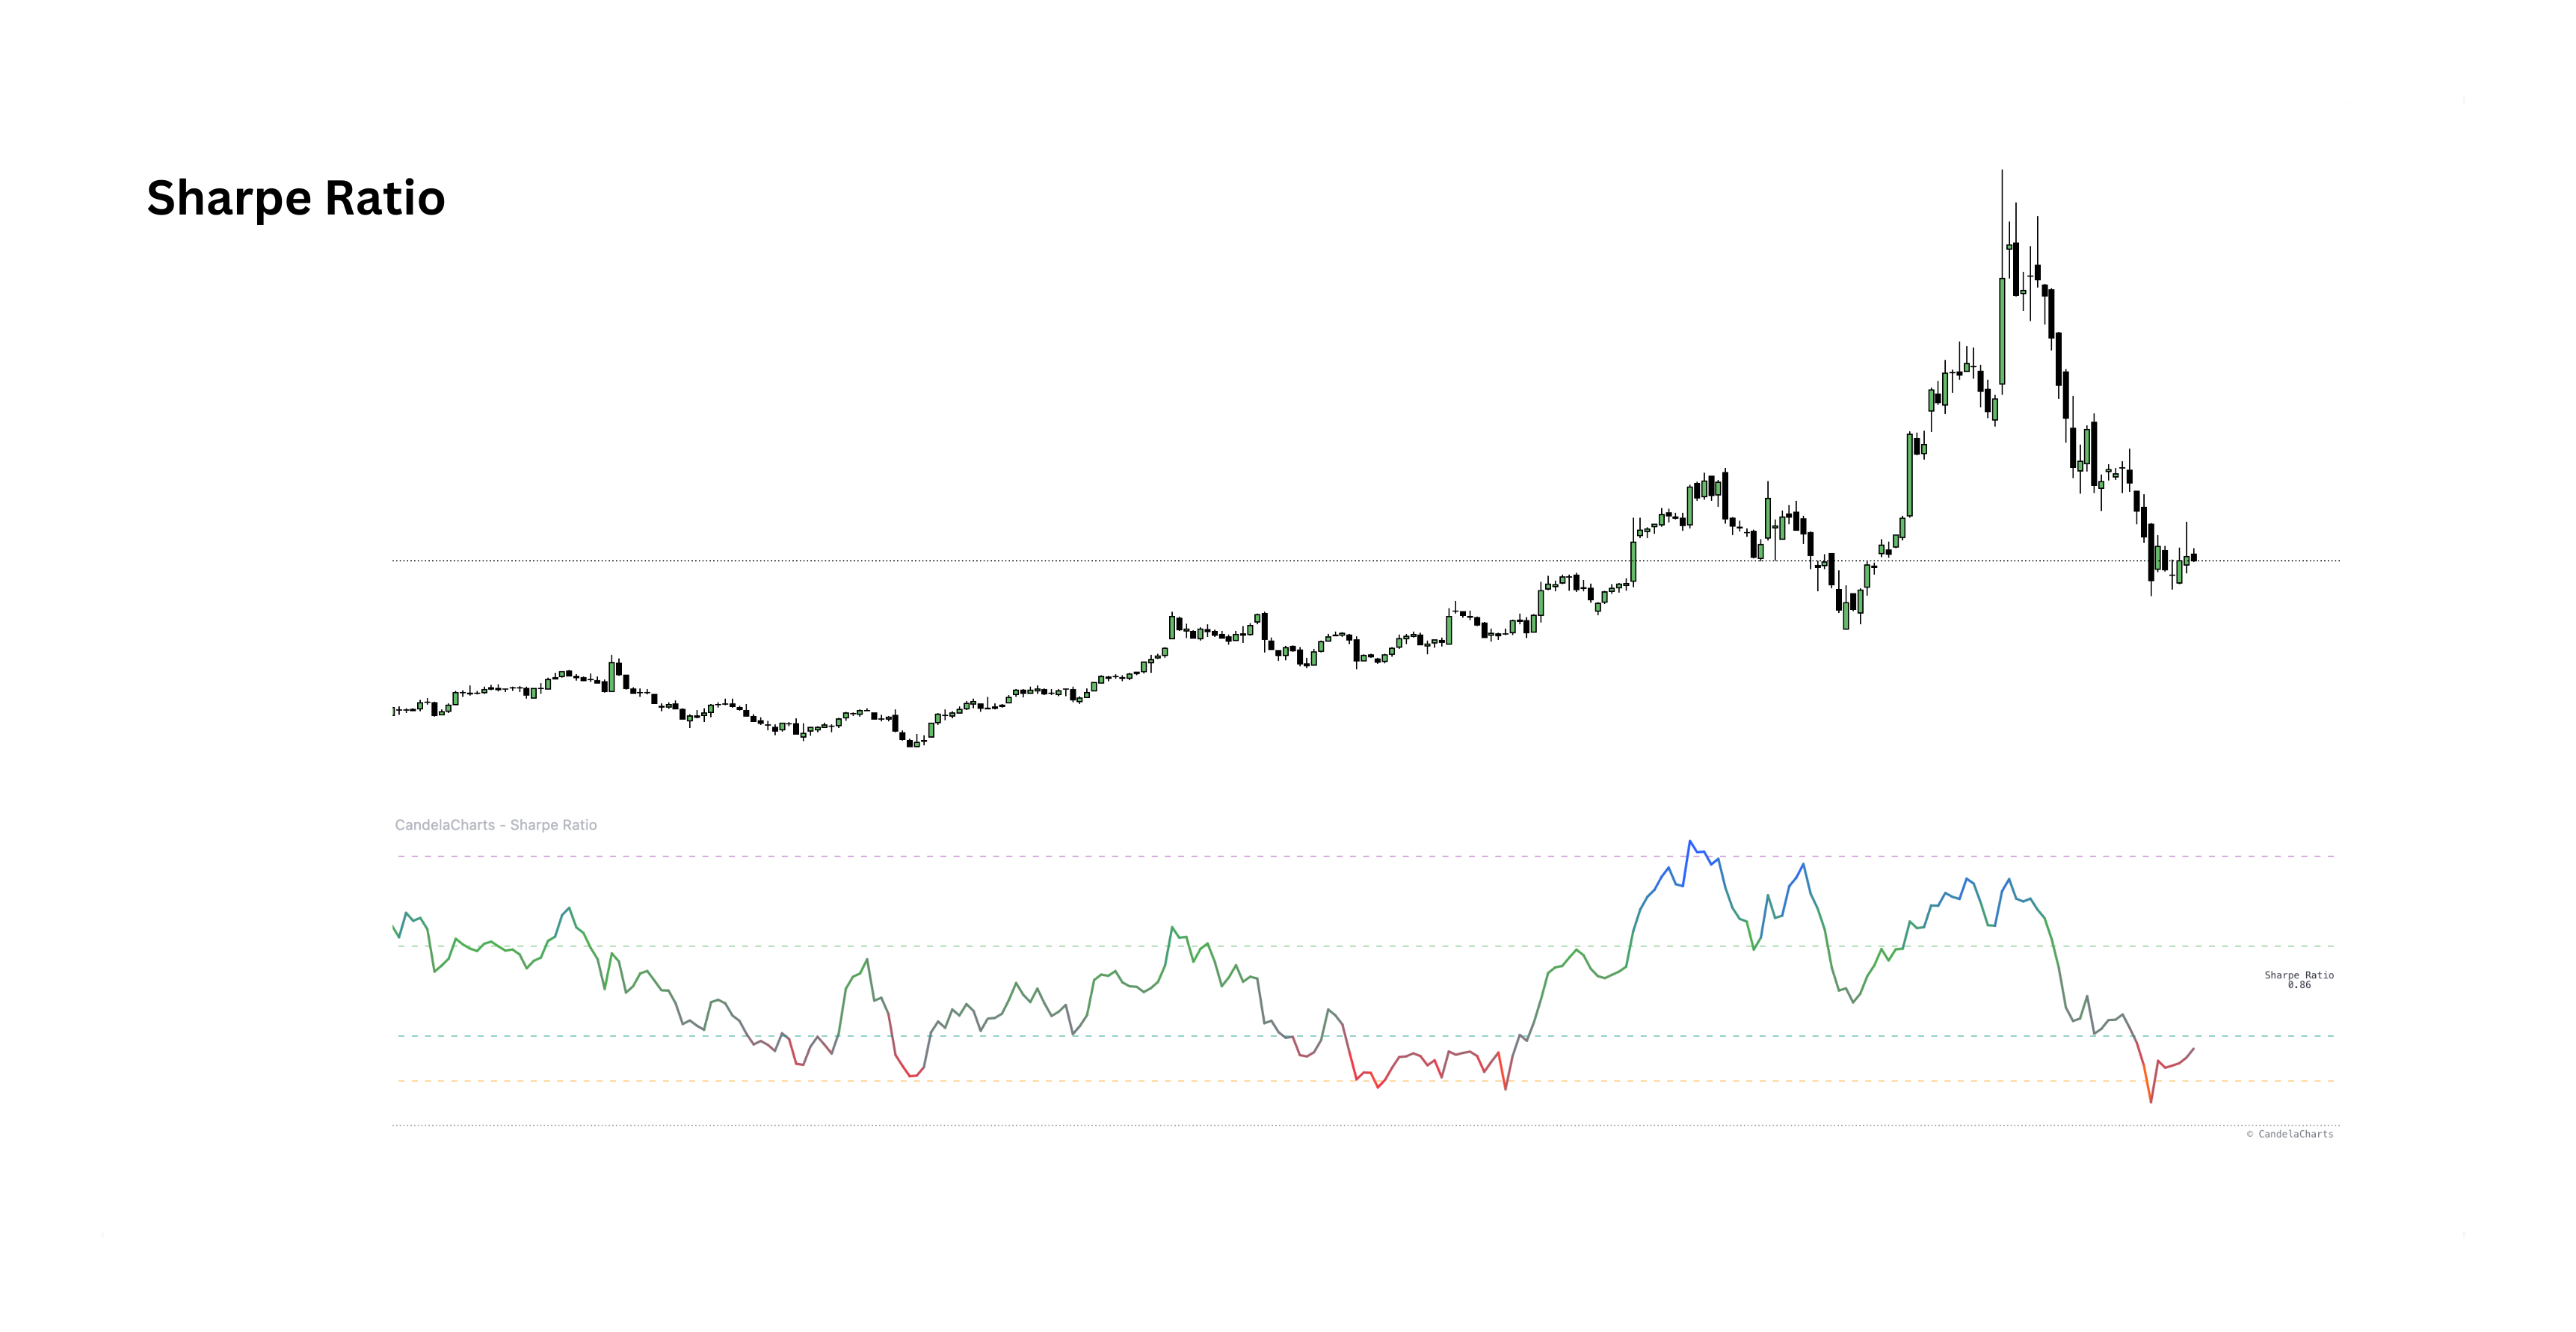
Measures excess return per unit of volatility — how efficiently an asset is rewarded for the risk it takes — with configurable return models, annualization and smoothing for a decision-ready read.
Excess ReturnReturn measured against a per-period risk-free hurdle.
VolatilityRolling standard deviation over a configurable lookback.
AnnualizationScales with √periods per year plus optional EMA smoothing.
Sortino Ratio preview

Sortino Ratio

Downside riskView indicator
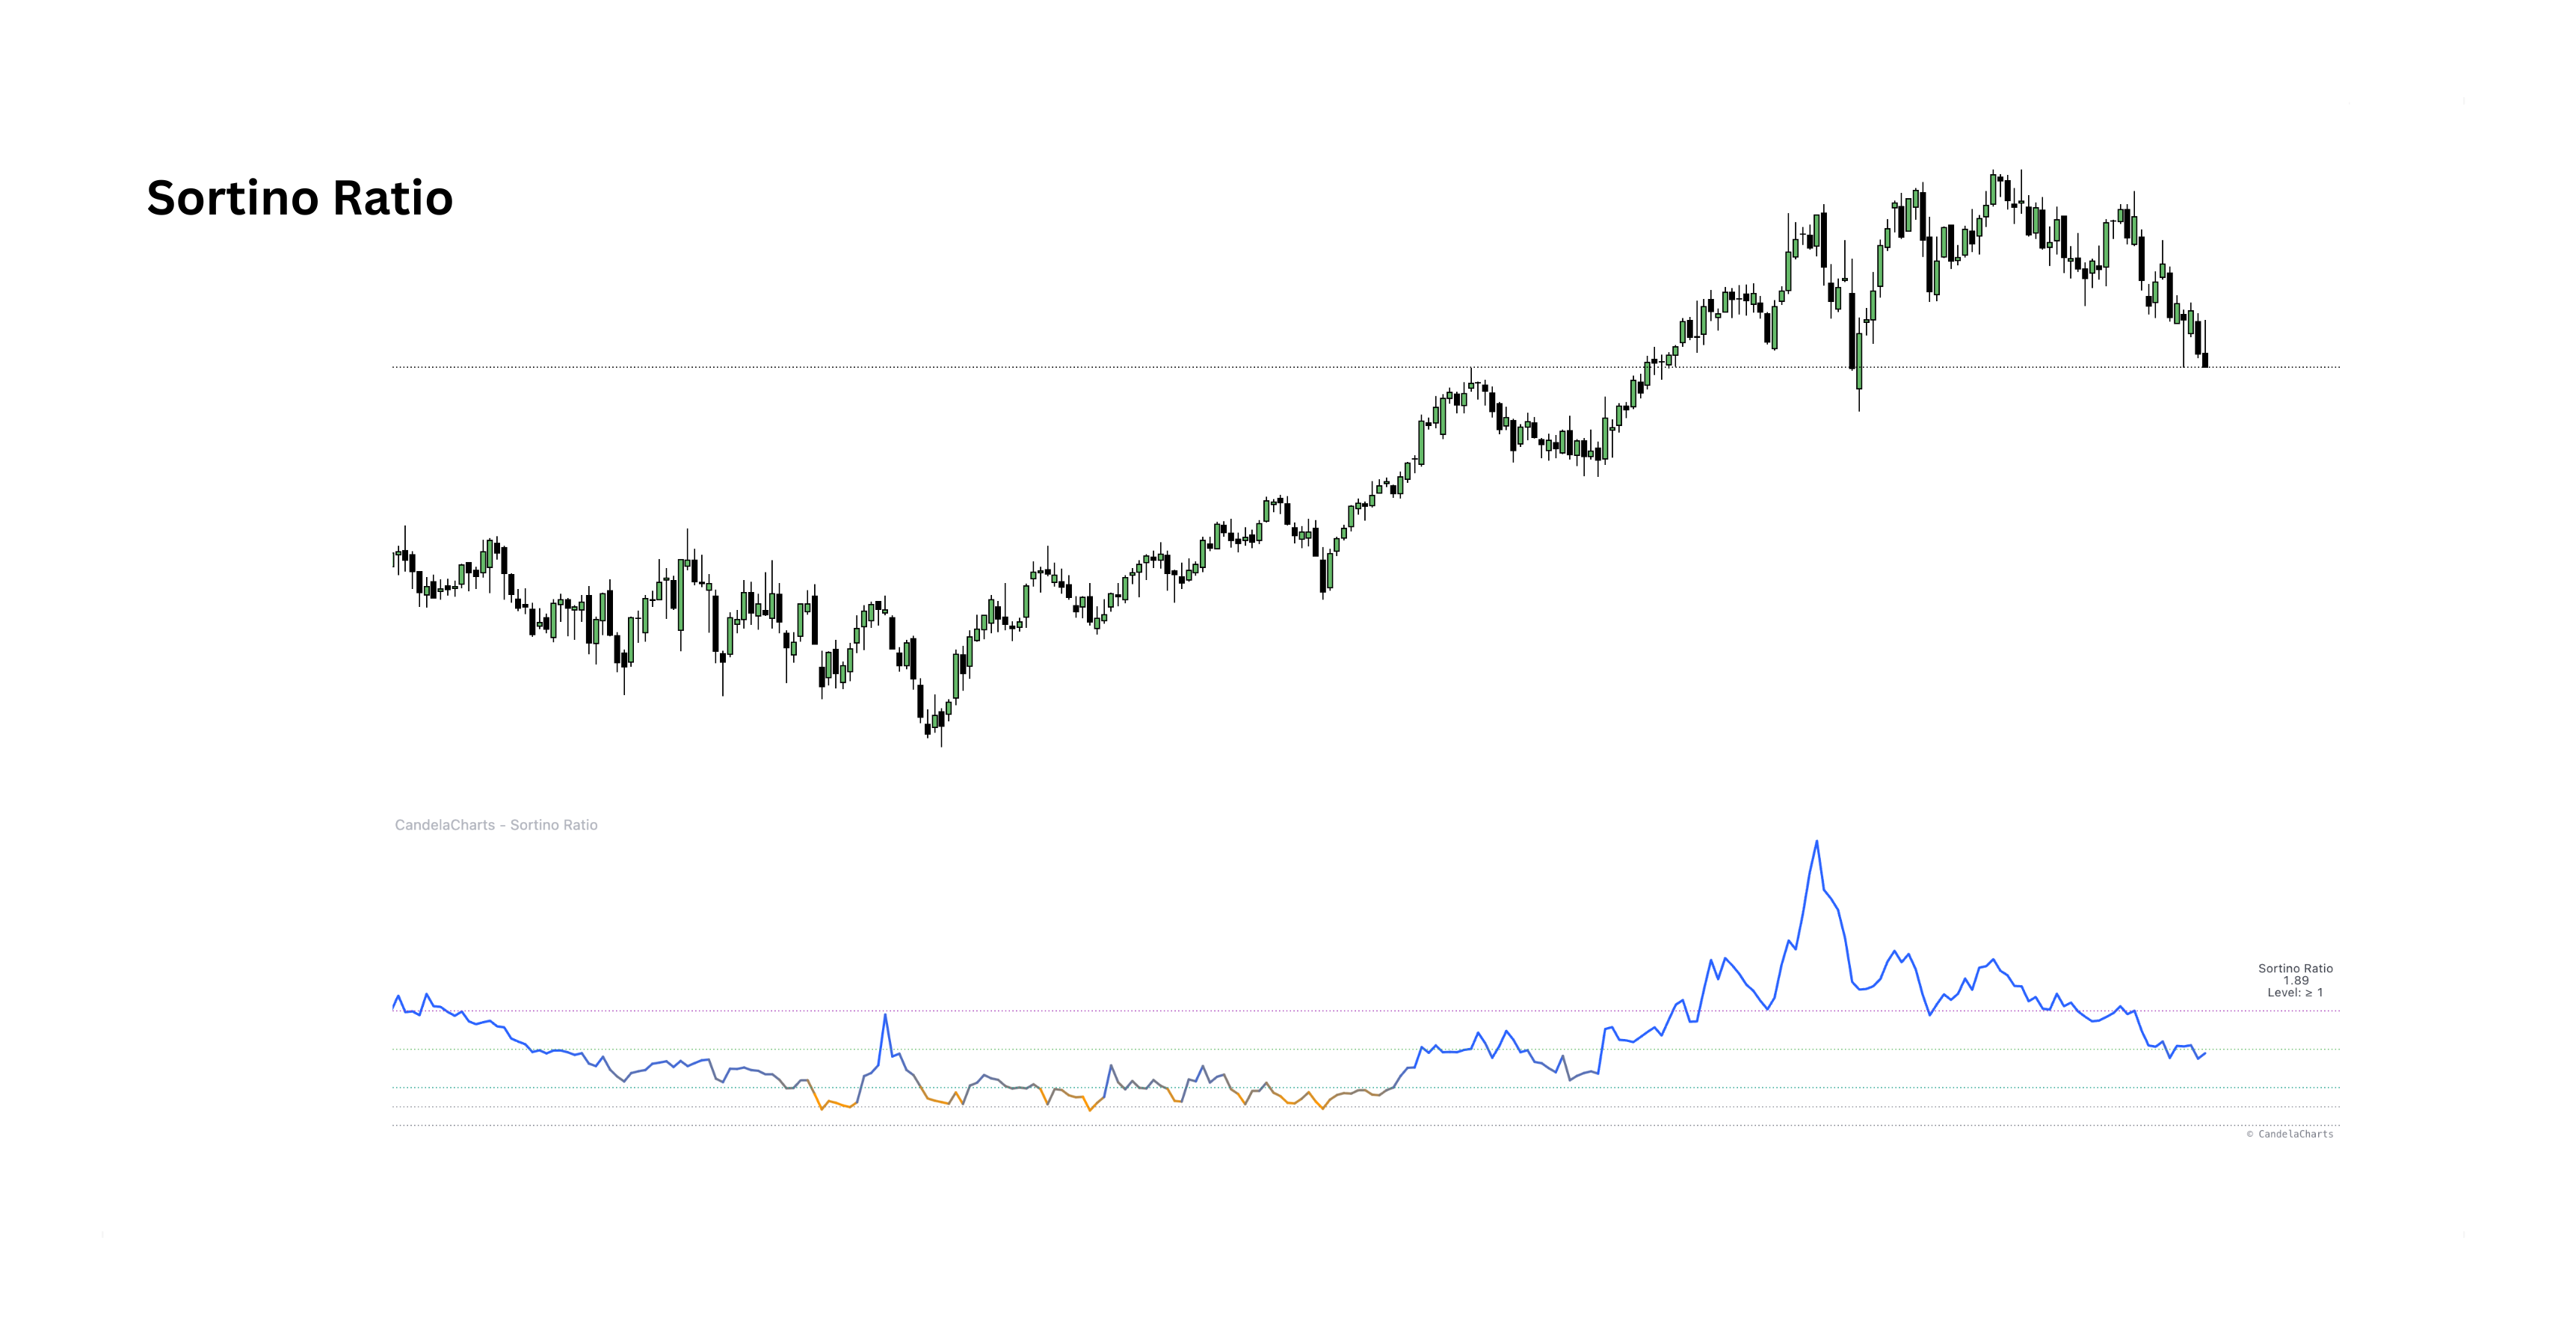
Like Sharpe, but only downside volatility counts — measuring excess return per unit of downside deviation relative to a minimum acceptable return, with percentile or fixed-level views.
Downside DeviationPenalizes only volatility below the target return.
MAR TargetAnchored to a risk-free rate or a custom per-period hurdle.
Percentile BandsRolling P50/P75/P90 bands for cycle-aware context.
Omega Ratio preview

Omega Ratio

Gain vs lossView indicator
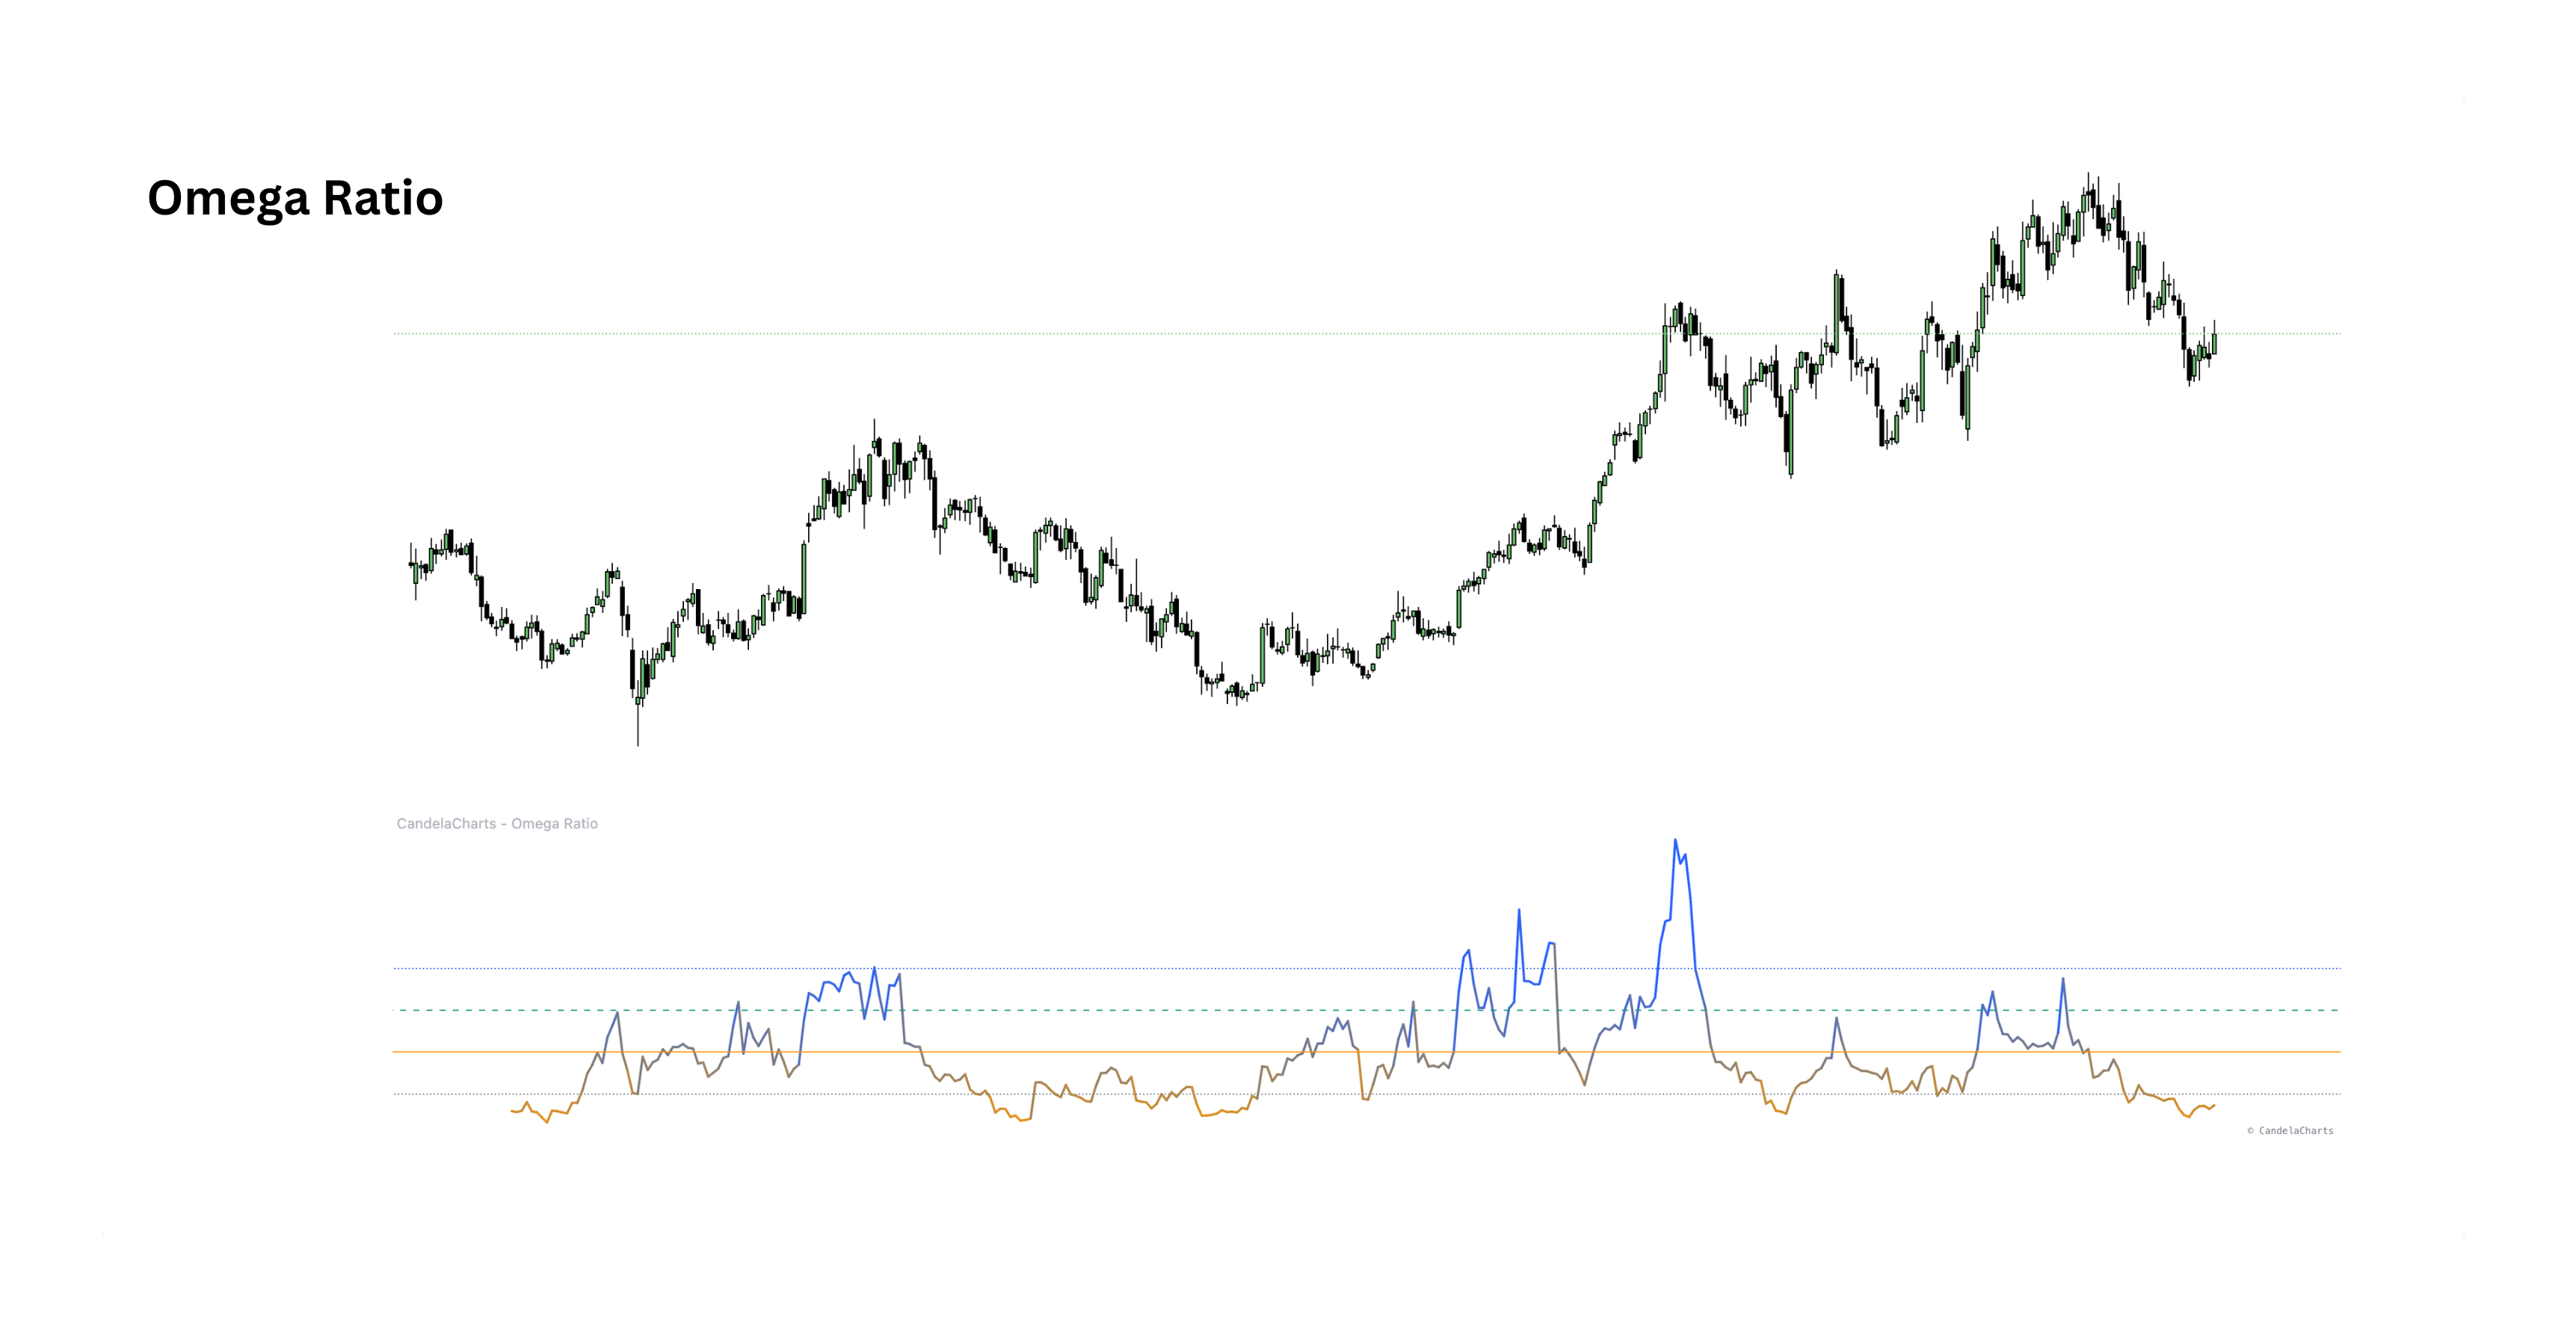
Measures risk-adjusted performance by comparing returns that exceed a chosen hurdle against those that fall short — a rolling Omega where above 1.0 is favorable and strong regimes often read 1.5–2.0.
ThresholdSets the per-bar target return used as the hurdle.
Omega ReadoutRolling sums of excess gains versus shortfalls.
Reference LevelsBuilt-in 0.5/1.0/1.5/2.0 levels framing weak to strong regimes.
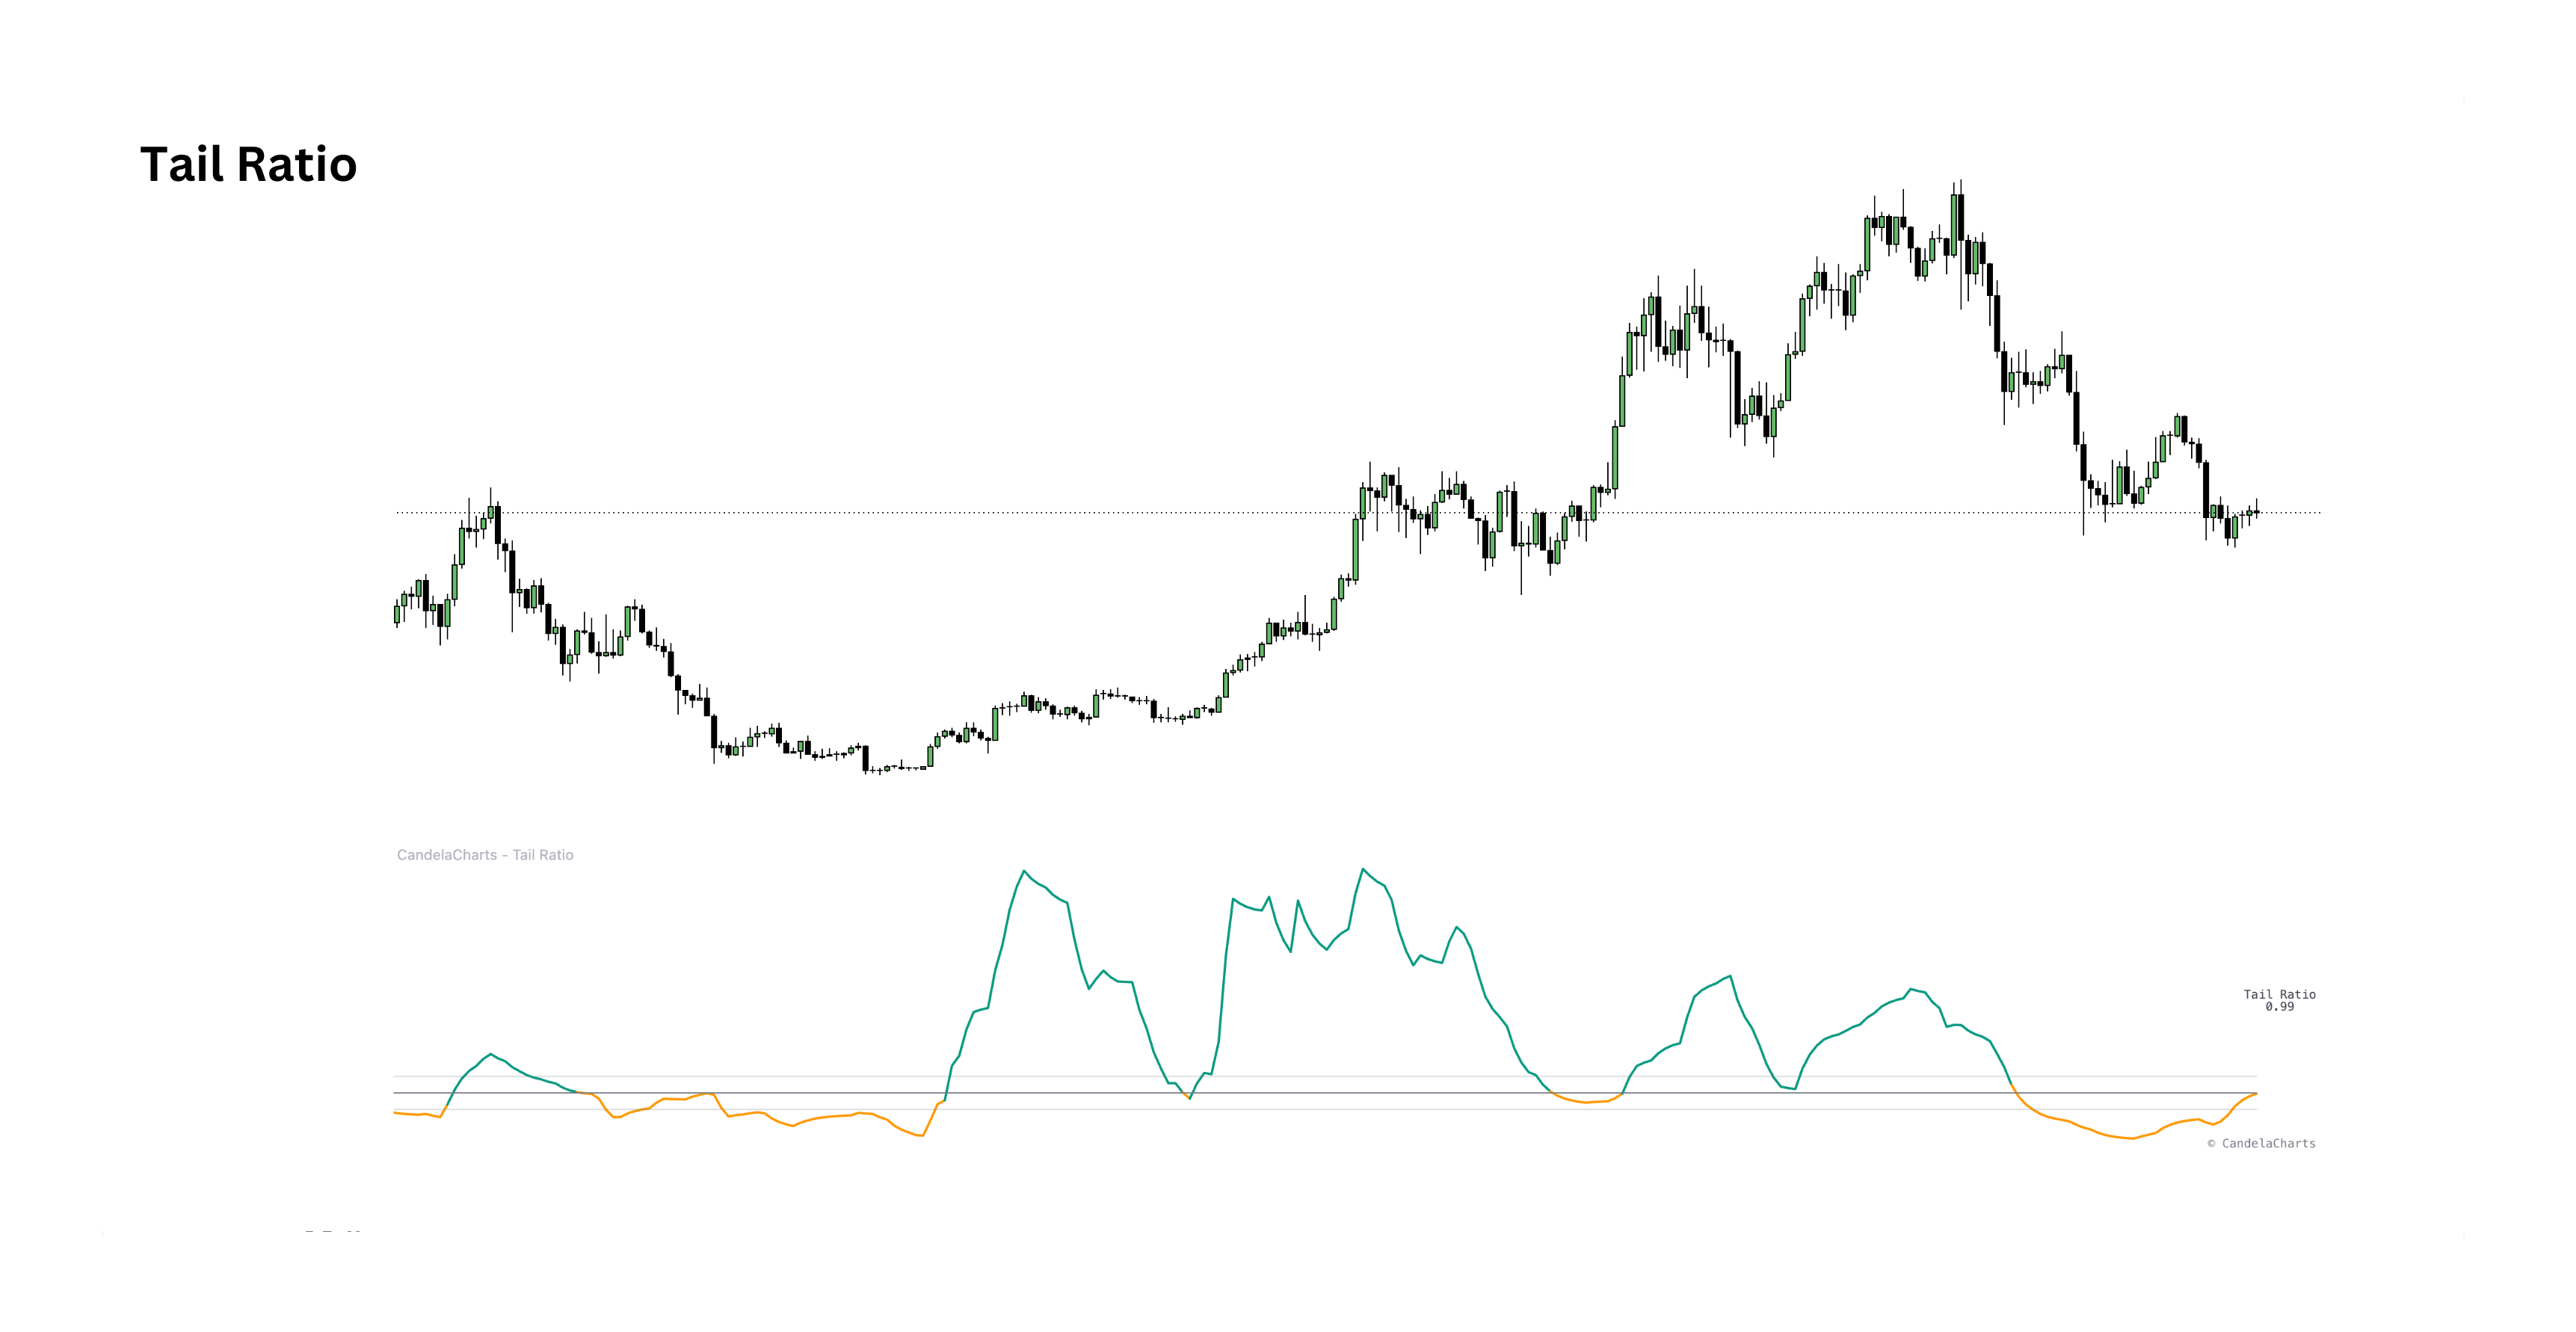
Tail Ratio preview

Tail Ratio

AsymmetryView indicator
Measures the symmetry of an asset's return distribution by comparing extreme positive returns to extreme negative ones — revealing hidden tail risk that volatility-based indicators often miss.
Percentile ComparisonRatio of the upper (95th) to lower (5th) return percentile.
Distribution StatusReadout of left-tailed, symmetric or right-tailed regimes.
Color-Coded SignalTeal above 1.0, orange below — with EMA smoothing.
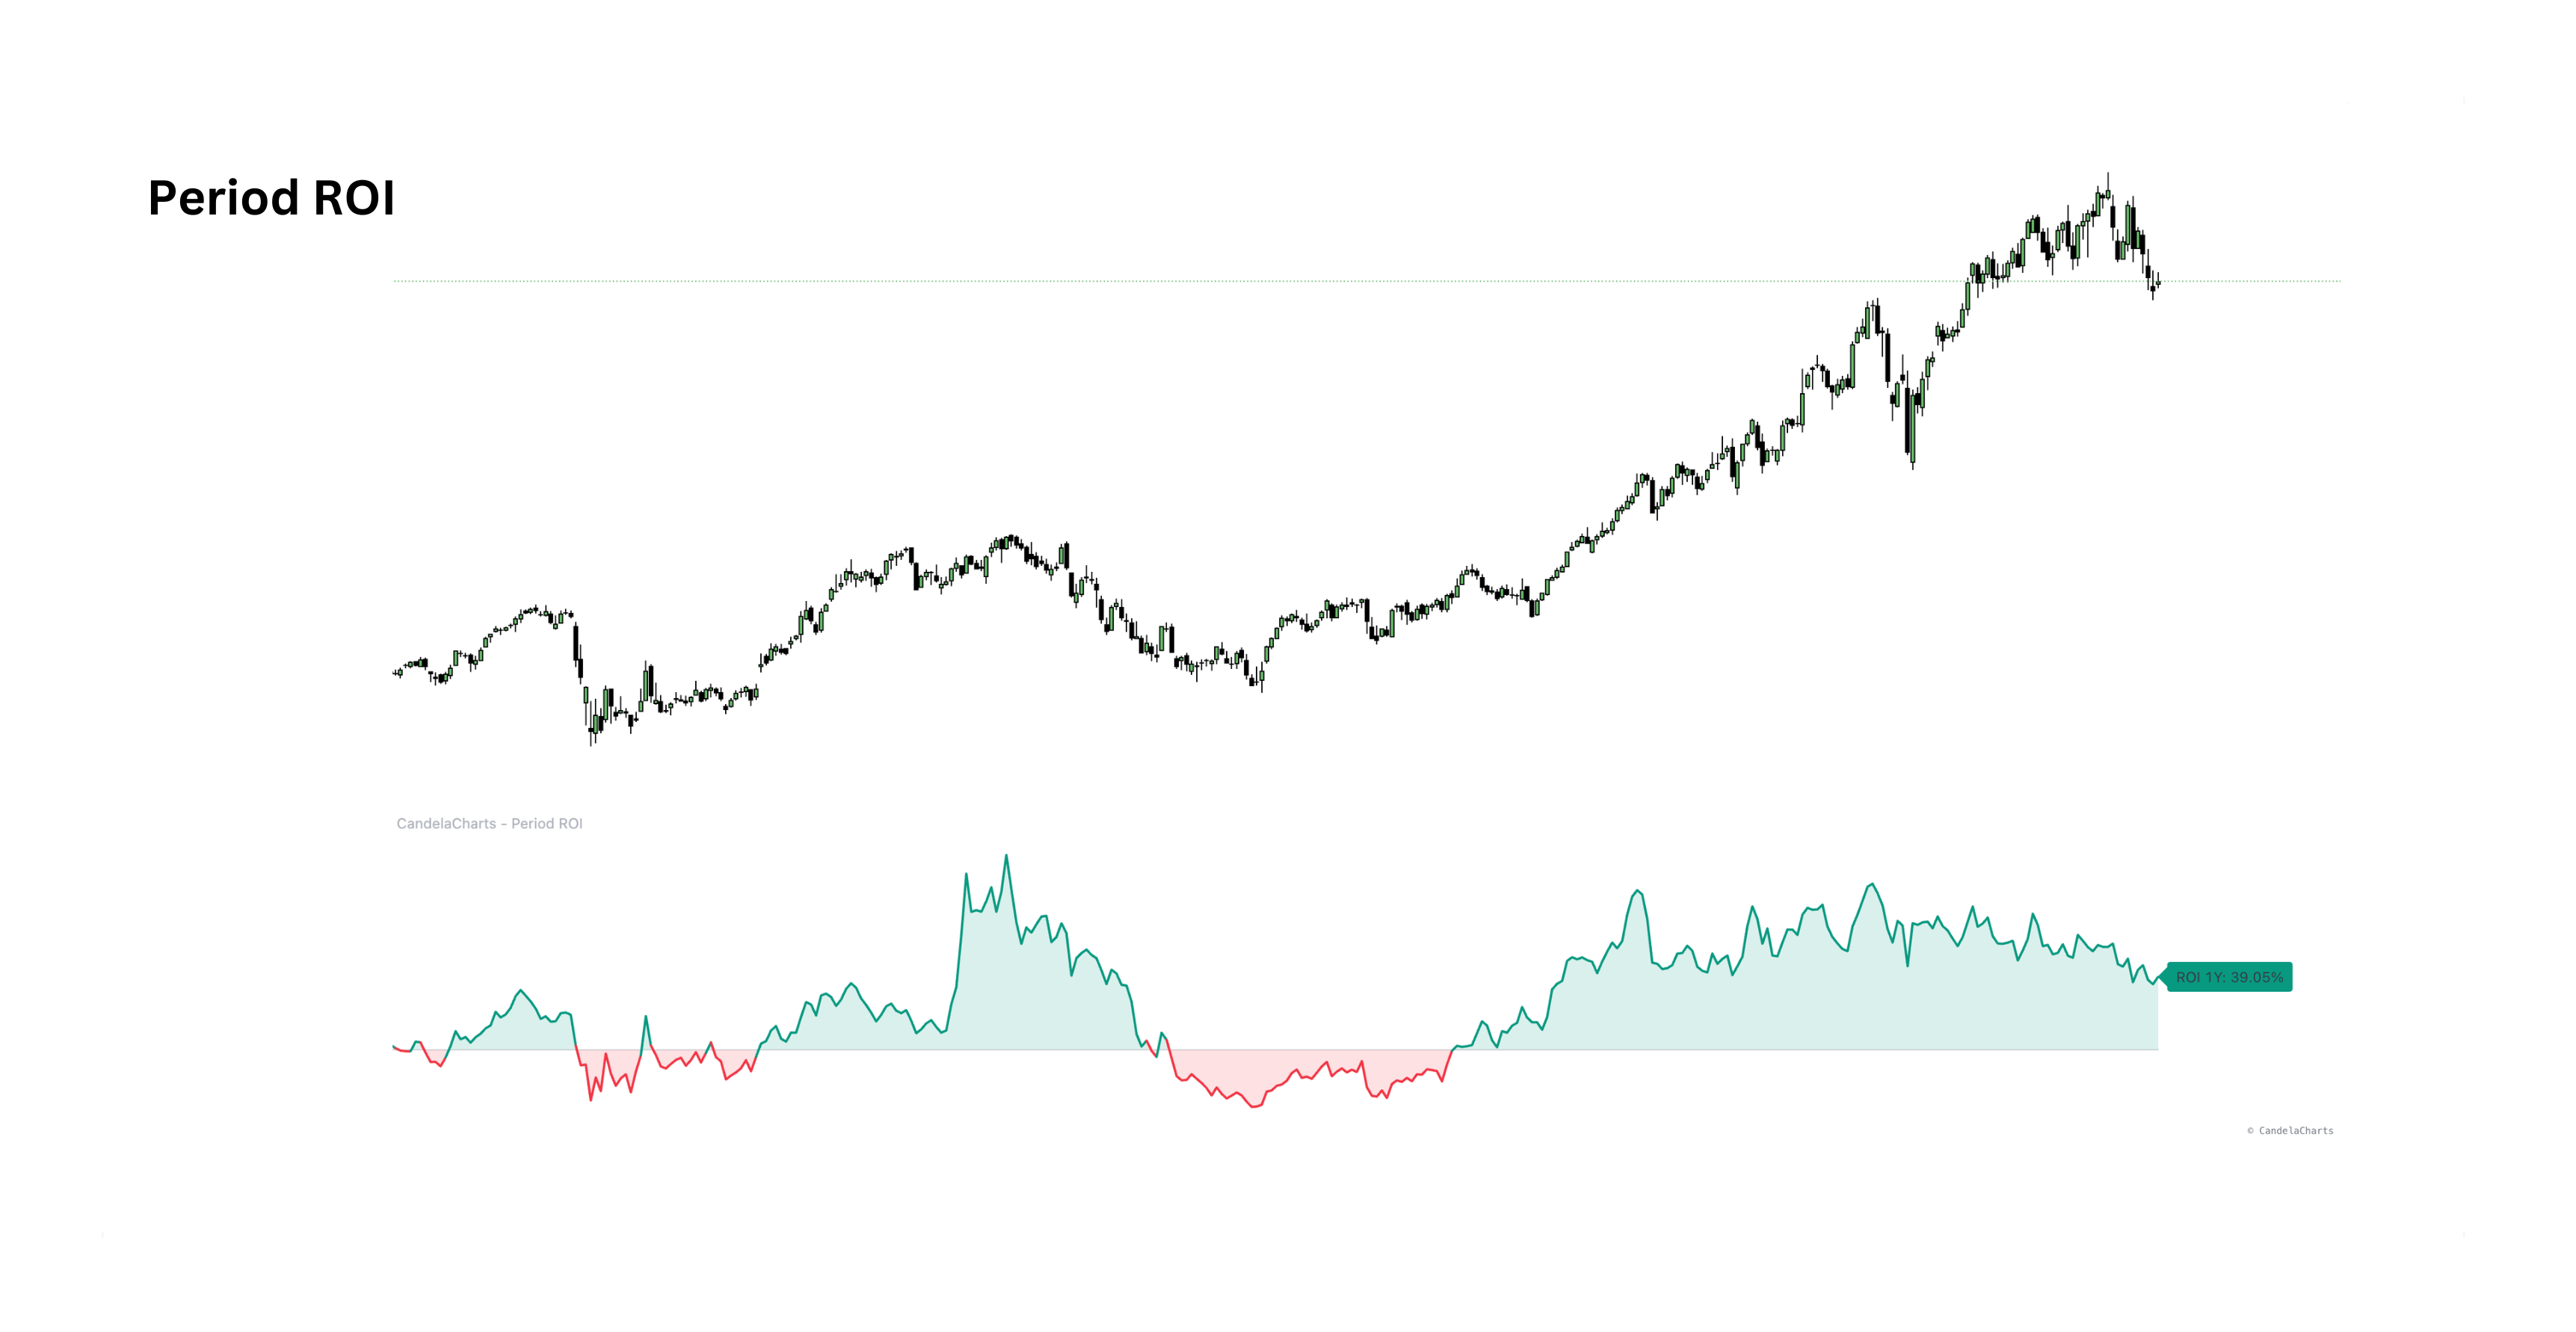
Period ROI preview

Period ROI

Return contextView indicator
Plots return on investment over a fixed window — 1M, 3M, 6M, 1Y or custom days — calculated from daily closes, so trend strength and market rotation can be judged at a glance.
Preset Periods1M, 3M, 6M, 1Y or custom day windows.
Zero-Line RegimeA clear baseline separating positive and negative return regimes.
Last-Value LabelRight-edge label with the latest ROI value for quick comparisons.

Your Edge in the Markets

Access professional-grade trading models, indicators, and tools designed to enhance your trading strategy and improve market performance.
Company
About
Contact
Culture
Newsletter
Legals
FAQ
Calculators
Connect
Status
Product
Pricing
Features
Indicators
Courses
Research
Docs
Markets
Trading Styles
Tradingview
Community
Changelog
Legal
Privacy
Terms
Refund
Disclaimer
Cookies
Copyright
Social
X
Instagram
Tiktok
Youtube
Pinterest
Tradingview
Discord
Threads
Logo
© CandelaCharts 2026
We provide trading indicators and technical analysis tools exclusively for TradingView. Our indicators are designed to assist with market analysis but are not intended as financial advice, investment recommendations, or trading signals. Trading involves significant risk, and many participants may incur losses. All trading decisions are made at your own risk and discretion.
We do not guarantee the accuracy, reliability, or profitability of any indicators provided. Technical indicators are tools that may assist in decision-making but do not guarantee profits or prevent losses. Past performance of indicators or trading strategies is not indicative of future results. Market conditions can change rapidly, and indicators may produce false signals.
Decisions to buy, sell, hold, or trade securities, commodities, cryptocurrencies, or other financial instruments carry inherent risks and are best made with guidance from qualified financial professionals. You should carefully consider your investment objectives, level of experience, and risk appetite before making any trading decisions. Never trade with money you cannot afford to lose, as market volatility can result in substantial losses.
Indicators are based on historical price data and mathematical calculations. They may not account for all market factors, including fundamental analysis, news events, or sudden market changes. No single indicator or combination of indicators can guarantee successful trading outcomes. Users are responsible for understanding how indicators work and making their own trading decisions.
This is a summary and does not constitute our full disclaimer. Please review our complete disclaimer and terms of service for comprehensive information regarding the use of our indicators and associated risks.