SPYVIXMacro
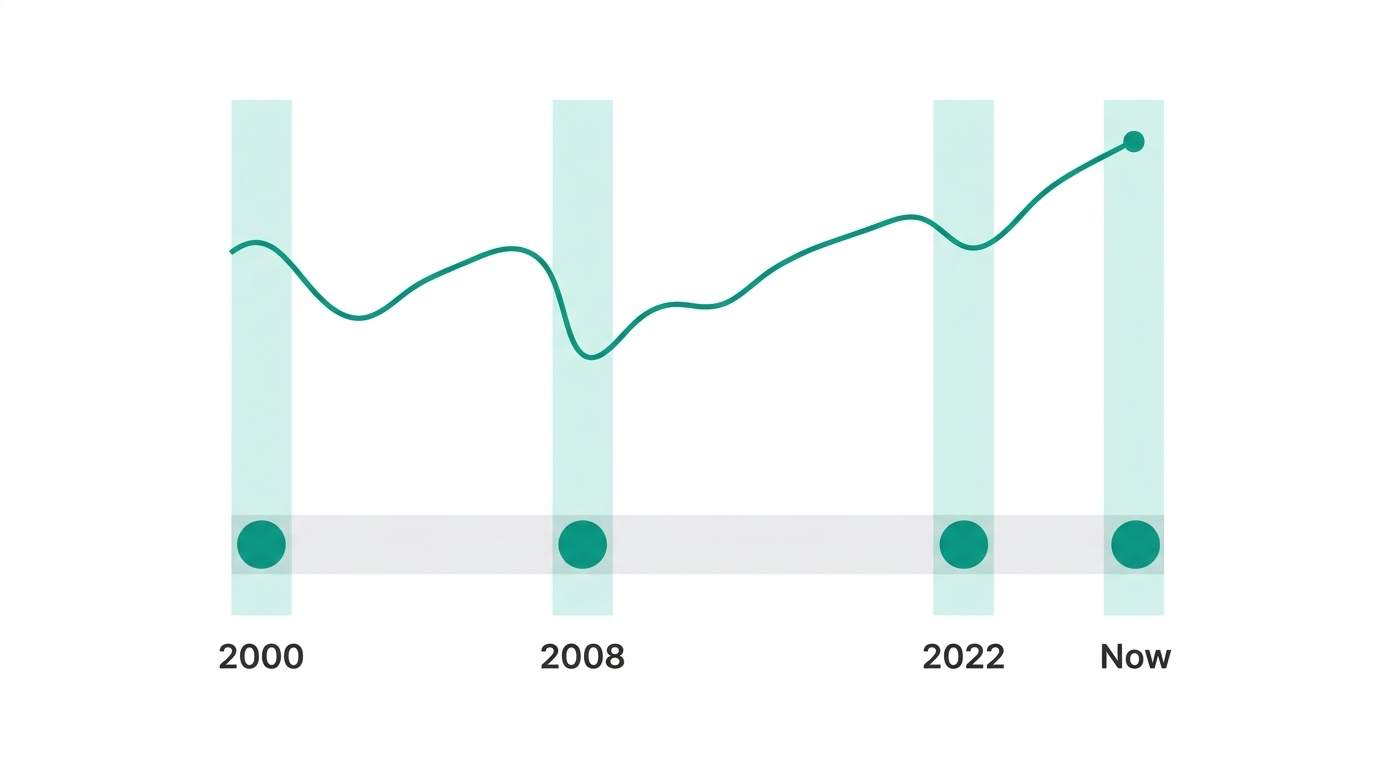
2000, 2008, 2022, and Now: The Opportunity Hiding in Fear
2026-11-18
by CandelaCharts
Four macro and market warning signs are flashing together for only the fourth time since 2000. Here is what 25 years of SPY and VIX data tell us about timing, fear, and managing risk.
Every number below comes from my own daily test of SPY (the S&P 500 fund) and the VIX (the market's fear gauge), going back to 2000.
A rare moment
Four warning signs from the economy and financial markets are flashing at the same time right now. That doesn't happen often. Since 2000, it has happened in only three other periods: the dot-com crash, the 2008 financial crisis, and the 2022 rate shock.
Your first instinct might be to run for cover. Others will say a nervous market is a buying opportunity. The truth sits somewhere in between, and it's more useful than either extreme. Let's walk through it step by step.
STEP 1: The four warning signs, in plain English
You don't need a finance background. Each sign is a different way of asking, "Is money getting nervous?"
1. Safe-haven stocks are beating the market
Some companies sell things people buy in any economy: food, soap, toothpaste. These are called consumer staples, and a fund with the ticker XLP tracks them. The broader US stock market is tracked by SPY. When investors get scared, they sell exciting, risky stocks and move into these dependable ones.
The warning: XLP beats SPY by 6 percentage points or more over three months.
2. The US dollar is unusually strong
The US Dollar Index (DXY) measures the dollar against other major currencies. A very strong dollar sounds good, but it squeezes the rest of the world. Anyone who borrowed in dollars owes more in their own currency, and American companies earn less when they convert foreign sales back into dollars.
The warning: the dollar is within 2% of its highest level of the past year.
3. Long-term interest rates are jumping
The 10-year Treasury yield is the interest rate the US government pays to borrow for ten years. It influences mortgage rates, business loans, and how much investors will pay for stocks. When it rises fast, borrowing gets more expensive and stock prices often feel the pressure.
The warning: the 10-year yield has risen 0.40 percentage points or more over six months.
4. The market expects more rate hikes
The Fed Funds rate is the short-term rate set by the US central bank (the Federal Reserve). The 2-year Treasury yield shows where investors think rates are headed. If it sits well above today's Fed rate, investors are betting on more hikes, which tend to slow down the economy.
The warning: the 2-year yield is 0.50 percentage points or more above the Fed Funds rate.
STEP 2: How many lights are on at once
One warning on its own is common — markets always have something to worry about. What matters is how many of the four are flashing at the same time:
- 0 to 2 warnings: Everyday market noise. One or two pressures may be present, but they aren't reinforcing each other.
- 3 warnings: Elevated stress. Multiple parts of the market are tightening in the same direction.
- 4 warnings: Full alignment. All four corners — defensive stocks, the dollar, long-term rates, and Fed expectations — are flashing together.
Single warnings come and go for ordinary reasons. All four together is rare, and that's what the rest of this note looks at.
STEP 3: What happened each time all four lined up
I checked every day since 2000 to see when the score hit 4. It happened in three separate periods before today. The figures show SPY's price return, measured from the first days the score hit 4.
The dot-com bust (May 10 to 15, 2000)
- One year later: SPY was down 9% to 13%
- Worst drop within that year: 20% to 24%
The financial crisis (Oct 20 to 21 and Nov 3 to 4, 2008)
- One year later: SPY was up 4% to 13%
- Worst drop within that year: 29% to 32%
The rate-hike shock (Jan 19, 2022)
- One year later: SPY was down 12%
- Worst drop within that year: 21%
Nobody would have called the bottom. In all three episodes, the market kept falling after the alignment, by 20% to 32% at the worst point. In two of the three, SPY was still lower a year later.
The bottoms did come, and they came after. In each case the market's lowest point arrived later: late 2002 (about two and a half years after the 2000 alignment), March 2009 (about four months after 2008), and October 2022 (about nine months after January 2022). Anyone who held on through those lows saw the market recover afterward.
It's a question of timing. All four warnings tend to line up during the middle and later stretch of a rough market, not at the very start and not at the very end. That's why it's early to buy and too late to feel comfortable selling.
STEP 4: A second clue, the fear gauge
If the four warnings tell us the stage is set, what tells us how much fear is actually in the market? One of the most-watched measures is the VIX, often called the fear gauge.
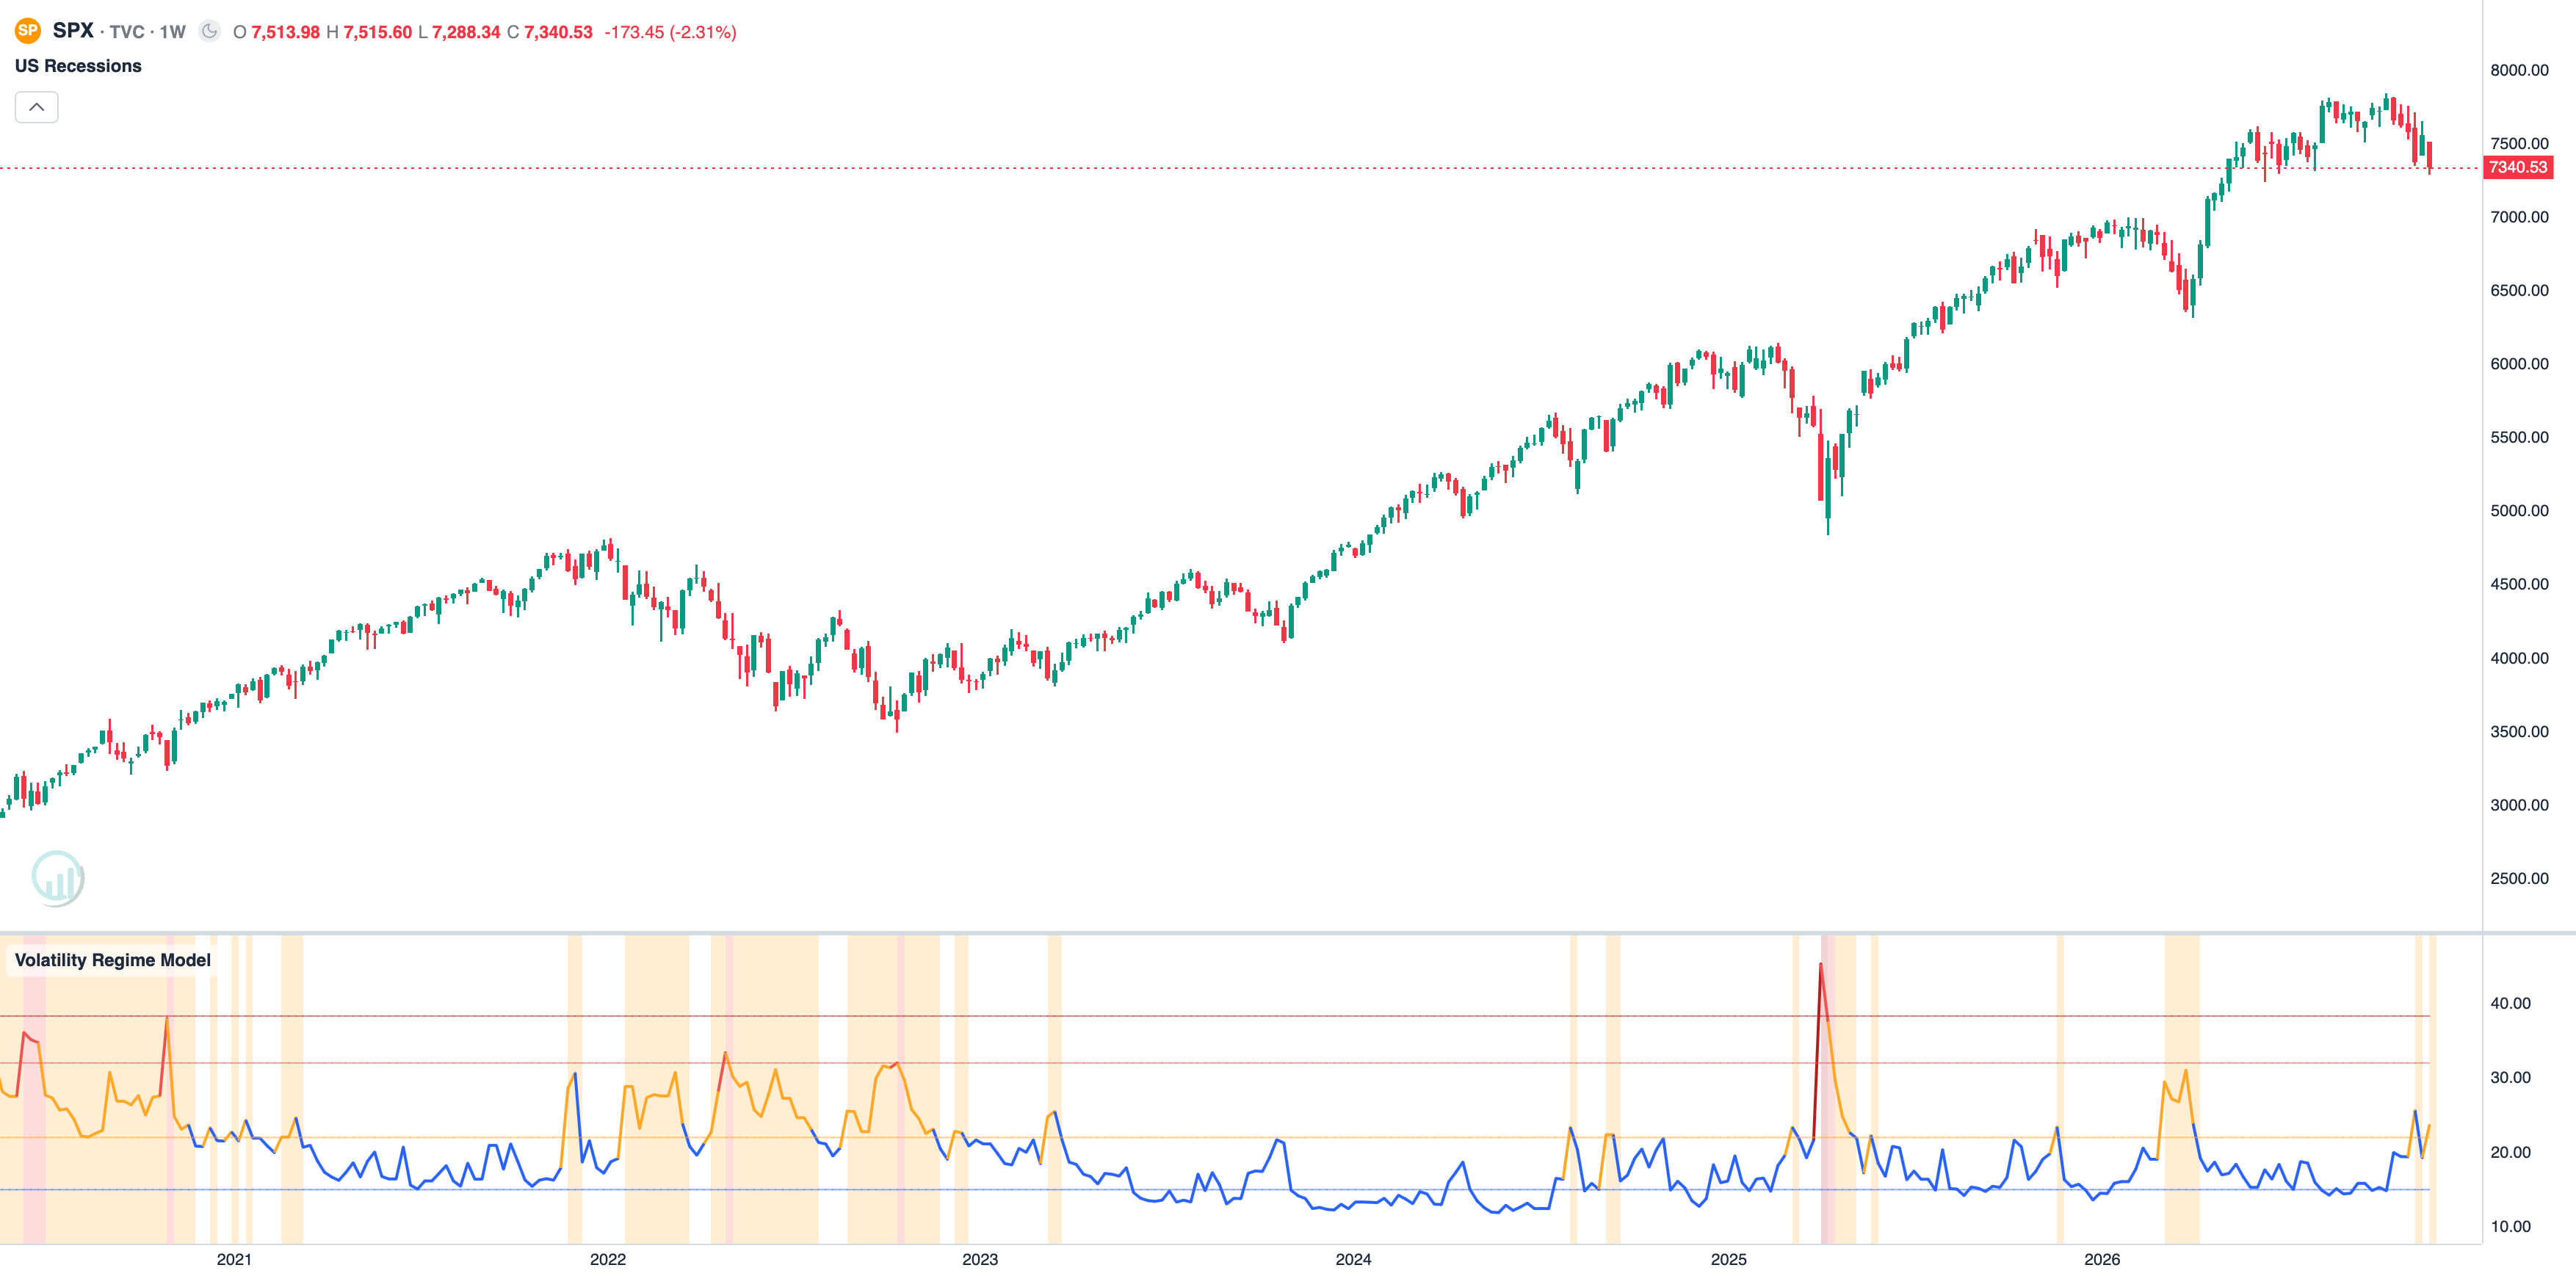
SPY and the VIX fear gauge across prior four-warning alignments
It tracks how much investors expect stocks to swing. Roughly speaking:
- Around 15 to 20: calm
- Low 20s: nervous
- Above 30: real stress
- Above 40: panic
I checked what happened when the four warnings were active and the VIX also jumped to 30 or higher. That gave five distinct moments: October 20, 2008, January 16, 2009, January 26, 2022, March 8, 2022, and April 27, 2022.
What I found is mixed.
- Only two of the five were higher a year later, and both came in 2008 and 2009 (about +10% and +35%).
- The three 2022 moments were flat to about 6% lower a year later.
- In every case the market still fell 14% to 31% at some point within the next year.
Why the difference? In 2008, fear went all the way to panic. The market capitulated, meaning sellers gave up in a rush, and what followed was a strong recovery. In 2022, fear never got that extreme. The market ground lower in a slow, grinding way without a clear washout. In 2000, the VIX was below 30 on the days the warnings lined up.
The lesson isn't that a fear spike is a buy signal. It's that the size of the fear matters. A true panic has historically been a better sign that selling is exhausted than a mild spike.
STEP 5: What this does and doesn't tell us
What it does tell us
- This combination is rare, and it has shown up in every major bear market of the last 25 years.
- When it appears, real stress is already in the system.
- Markets have eventually recovered from each of these episodes.
- Extreme fear has been a better sign of exhaustion than ordinary nervousness.
What it doesn't tell us
- That the bottom is in. It wasn't, three times out of three.
- How long the pain will last. The waits ranged from a few months to a couple of years.
- That the future will repeat the past. Three episodes is a small sample, and each had different causes.
A word of caution on the numbers
I tested SPY and the VIX only, with fixed thresholds, and measured price returns without dividends. The fear-gauge test rests on just five moments, which is far too few to call a rule. Treat all of this as a useful pattern to be aware of, not a promise.
STEP 6: A careful way to think about it
If you want to act on a moment like this, the history suggests planning to be early, not perfect.
- See it as a "pay attention" signal. It's time to review your risk, not to rush into buying.
- Assume you could be early. The market fell a further 20% to 32% in all three episodes. Only invest what you could watch drop that far without being forced to sell.
- Check the fear gauge. Ordinary nervousness isn't the same as capitulation. A VIX in the 20s means worry, not a washout.
- Buy in pieces, if at all. Spread purchases over many weeks or months instead of going in all at once.
- Decide your exit before you enter. Know what would prove you wrong before you put money in.
- Watch for the pressure to ease. When two or three of the warnings fade, conditions are improving. That may tell you more than the day they first lined up.
STEP 7: Where we are right now
The four warnings first lined up on November 2, 2026, and they have stayed on for 12 trading days so far. That puts us in the same small group as 2000, 2008, and 2022.
Current four-warning alignment starting November 2, 2026 alongside the VIX
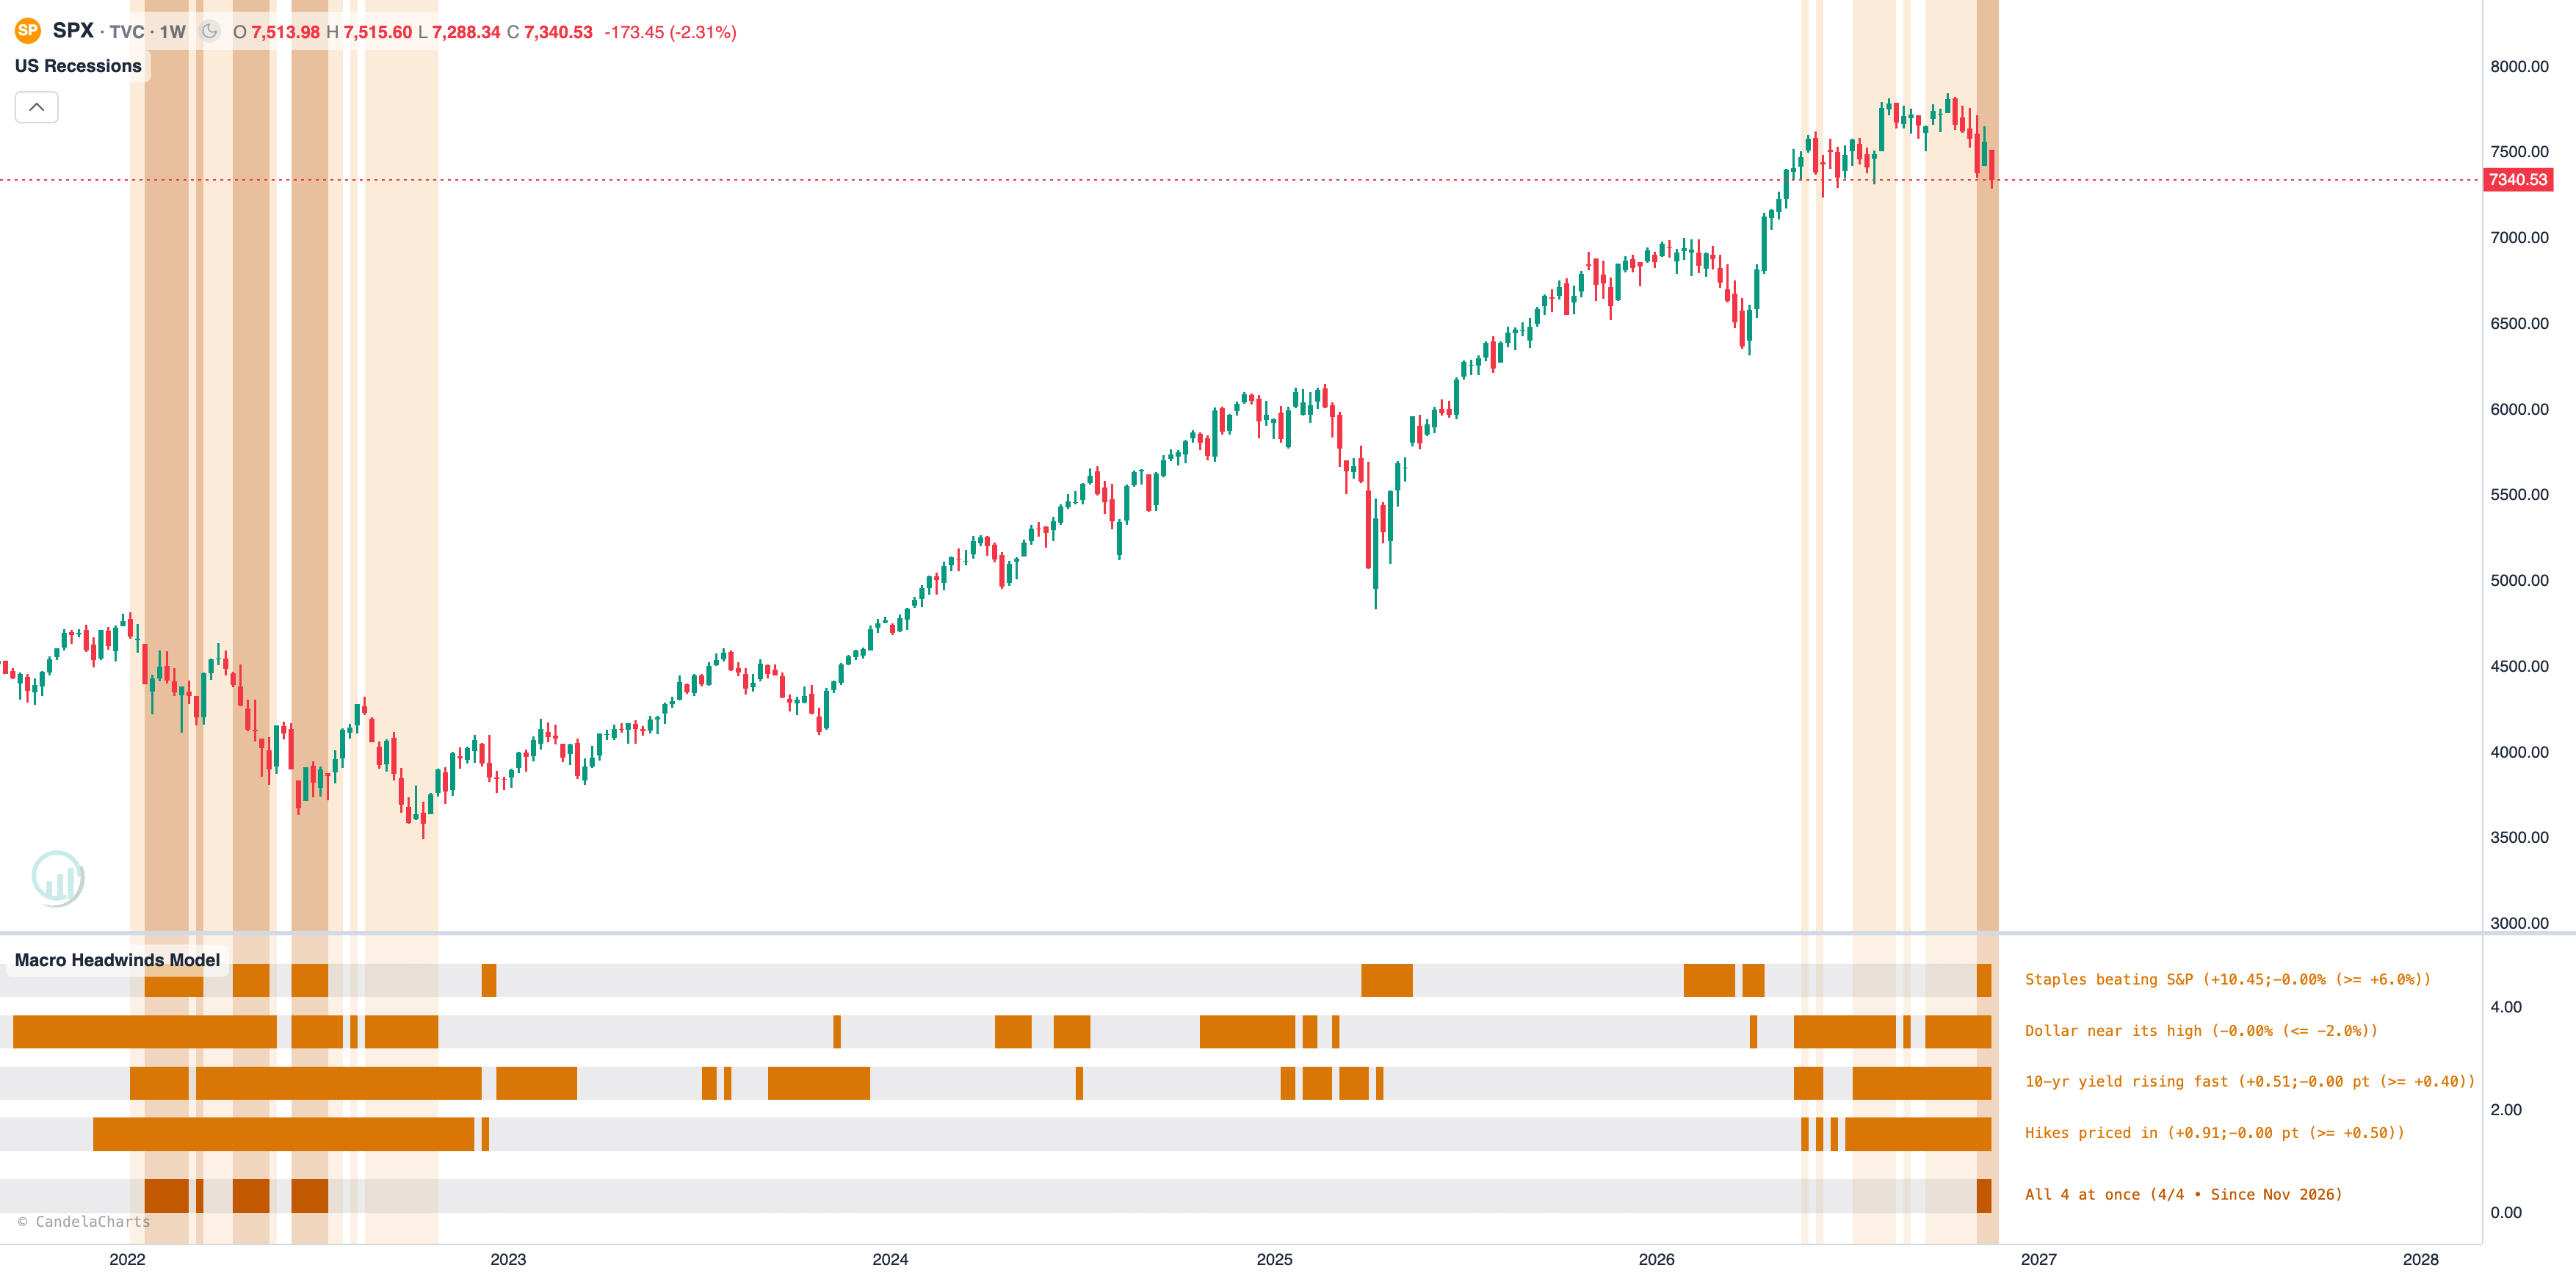
The fear gauge tells a quieter story. The VIX has spiked into the high 20s recently, but it is around 23 now. That's nervous, not panicked. Stocks have pulled back from their October highs, but there has been no washout like the ones that came with the big recoveries in the past.
History doesn't tell us what happens next. It does tell us this is a moment to be thoughtful: size positions carefully, stay patient, and avoid trying to guess the exact low.
The takeaway
When four separate warning lights come on at once, it's a sign of real stress, and the market has usually kept falling for a while afterward. The same pattern also showed up near the end of the last three big bear markets, which is why it's worth watching rather than fearing. The goal isn't to catch the exact bottom. It's to understand where you are in the cycle, pay attention to how much fear is really in the market, size your risk sensibly, and keep your plan simple.
Educational content, not financial advice. Past performance does not guarantee future results. Never invest more than you can afford to lose.
Share this post
If you found this article helpful, share it with others.Your Edge in the Markets
Access professional-grade trading models, indicators, and tools designed to enhance your trading strategy and improve market performance.