
Market PsychologyMarket Cycles
2000 vs. 2007: Different Technology, Same Psychology
2026-11-08
by CandelaCharts
Markets can rally hard while the underlying problems remain. In 2000 and again in 2007, the final leg higher came after the fear had passed, not before it. Here is how that sequence unfolded at the 2007 top, and why the pattern keeps repeating.
Markets can rally hard while the underlying problems remain. In 2000 and again in 2007, the final leg higher came after the fear had passed, not before it.
The usual assumption is that stock prices rise when conditions improve and fall when they deteriorate. In practice, markets often move on something different: how investors feel about conditions. That gap between sentiment and reality is where the largest reversals begin. The 2007 market top is a clear case study, and it unfolds in two phases.
Phase 1: Fear gives way to relief
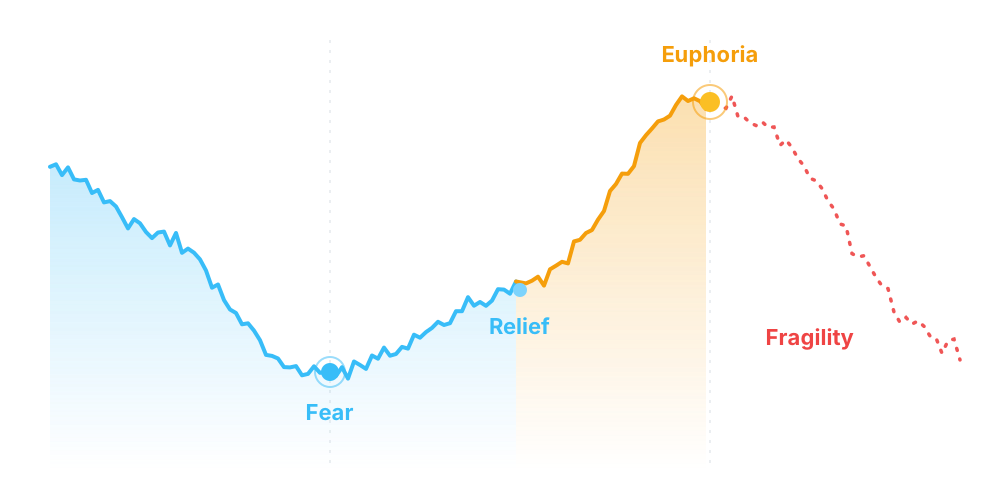
In August 2007, losses tied to risky mortgage lending were spreading through the banking system. Headlines warned that shares could fall further and that banks might fail. The S&P 500, the index that tracks 500 of the largest US companies and is the common benchmark for "the market," reached its low that month.
Then the selling exhausted itself. Prices stabilized, and investors began to see opportunity at lower levels. The index rose roughly 11% in about 7.5 weeks, a sharp recovery in a short time.
What had not changed was the underlying problem. The banks were still exposed to the same loans. The rally reflected fading fear, not resolved risk, and the two are easy to confuse.
Phase 2: Optimism turns into euphoria
As prices kept climbing, investors who had stayed on the sidelines felt pressure to rejoin. This is often called FOMO, the fear of missing out. Individual investors returned in numbers, and buying became driven more by momentum than by analysis.
On October 9, 2007, the S&P 500 closed at a new all-time high. A leading financial newspaper ran the headline that stocks had reached new highs as credit worries faded, with investors saying the worst was over. Two months earlier, the dominant story had been possible bank failures. The narrative had reversed completely, while the risks had barely moved.
This is the fragile stage. When nearly everyone is confident and fully invested, few buyers remain to absorb bad news. The market looks strong but has little room for disappointment. The S&P 500 went on to lose more than half its value by early 2009.
A rally is not an all-clear
The August low, the 11% recovery and the October record all happened while the mortgage losses that caused them were still on the banks' books. Price recovered first; the problem was resolved much later, and in 2008 it was resolved by force.
The psychological sequence
The same six stages appear in both episodes:
- Fear: a sell-off, with headlines focused on the problems.
- Relief: the market stabilizes and investors see opportunity.
- Renewed optimism: the narrative shifts and the future looks bright again.
- FOMO: individual investors return, unwilling to miss the next leg up.
- Euphoria: stocks make new highs and confidence builds.
- Fragility: the risks are still there, but the market looks past them.
The technology differs from cycle to cycle. In 2000 the enthusiasm centered on internet companies; in 2007 it centered on housing and credit. The behavior underneath stays the same, which is why the pattern keeps repeating.
What this means for investors
- Treat headlines as sentiment, not safety. A reassuring headline describes the mood of the moment. It says little about whether the underlying risks have been resolved.
- Be wary of reacting to fear. In August 2007, those who sold in panic missed a sharp recovery. Decisions made at emotional extremes tend to be poorly timed.
- Decide your approach in advance. Set your risk tolerance and time horizon while markets are calm. A plan made calmly is far easier to follow than one improvised during a panic or a frenzy.
- Stay humble about timing. Tops and bottoms are clear only in hindsight, even to professionals. This is why many long-term investors favor steady, diversified investing over prediction.
A note on limits
History rhymes but never repeats exactly. Not every rally ends like 2007, and no one can say in advance when a market has peaked. The value of this framework is not forecasting. It is recognizing the emotions that drive markets so that you are less likely to be driven by them.
Naming the stage is not timing the top
Euphoria can last far longer than it looks sustainable, and prices can keep climbing while it does. Leaving early carries its own cost — missed gains, and the temptation to buy back in higher. Use this framework to keep your own reasoning honest, never as a signal to buy or sell.
Different technology. The same psychology.
For educational purposes only. This is not financial advice.
Share this post
If you found this article helpful, share it with others.Your Edge in the Markets
Access professional-grade trading models, indicators, and tools designed to enhance your trading strategy and improve market performance.