AISubprime
2007 vs 2026: Subprime Then, AI Debt Now
2026-10-26
by CandelaCharts
In 2007, the stock market got scared, dropped, bounced back to a new record, and then crashed harder in 2008. Some traders think 2026 looks similar with AI-driven debt. Here is a plain-English guide to why, and what to watch.
The short version
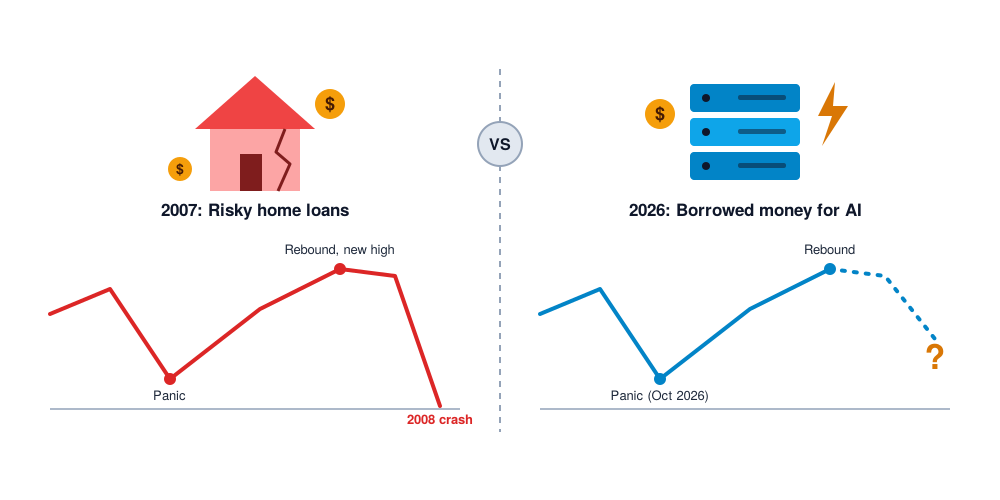
In 2007, the stock market got scared, dropped, bounced back to a new record, and then crashed much harder in 2008. Some traders think 2026 looks similar. This time the worry is not housing loans but the huge amount of borrowed money being poured into artificial intelligence.
This is a comparison, not a prediction. History rhymes sometimes, but it never repeats exactly.
What happened in 2007
Imagine a bank lends money to people who probably can't pay it back. That is what "subprime" loans were: home loans given to risky borrowers. When those borrowers started missing payments, banks began losing money, and investors panicked.
In August 2007, headlines were full of the words "credit crunch," which means banks become afraid to lend to anyone. Many people sold their stocks, fearing a recession.
Then something surprising happened. Within about two months, the S&P 500 (an index tracking 500 of America's biggest companies) climbed back and hit a new all-time high in October 2007.
That record turned out to be the last peak before the real crash. People who thought "the danger is over" lost a lot of money in 2008.
The lesson: a market bouncing back after a scare doesn't mean the danger has passed.
The 2007 timeline recap
In August 2007, the Federal Reserve cut the discount rate by 50 basis points to calm nervous money markets. That emergency liquidity helped the S&P 500 rally nearly 10% to its final peak in October 2007, even as underlying mortgage default rates were quietly accelerating beneath the surface.
Why some people see 2026 as similar
Today's pressure point is the AI boom. Building AI requires enormous spending on data centers (giant buildings full of computers), electricity to power them, and the chips inside. Much of that spending is paid for with borrowed money.
The author lists the types of debt involved:
- Corporate debt: regular loans and bonds taken by companies
- Private credit: loans from investment funds instead of banks
- Leveraged loans: loans to companies that are already heavily indebted
- AI spending: the data centers, power and equipment themselves
In mid-October 2026, the Nasdaq (a tech-heavy index) fell about 4.5% in one week, and the S&P 500 fell about 1.9%. Those were their worst weeks since June. The fear was that AI companies carrying lots of debt might not earn enough profit before their interest payments become too heavy.
One warning sign was the bonds of CoreWeave, an AI infrastructure company. Its bonds were paying investors yields above 15%. That is like a lender saying, "I'll only lend you money if you pay me a very high price, because I think you're risky."
The common pattern: when prices rise, stock investors tend to ignore debt. The lenders, who get paid back first, usually notice trouble earlier.
Why credit markets react before equities
Stock investors focus on upside potential and future revenue multiples. Creditors and bondholders, however, only receive their fixed interest and principal repayment — they have capped upside with 100% downside. That asymmetry is why credit markets routinely signal distress weeks or months before stock indexes take notice.
Two numbers that matter: interest rates and the dollar
The author says a bounce depends on two things falling: bond yields and the US dollar.
- Bond yield (the "10Y yield") is the interest the US government pays when it borrows money for ten years. When it rises, borrowing gets more expensive for everyone, and stocks, especially fast-growing tech companies, tend to be worth less. This yield recently hit about 5.3%, the highest since 2002.
- The dollar index (DXY) measures the dollar against other major currencies. A very strong dollar makes money tighter around the world. It recently reached about 102.5.
In mid-October, both started to fall. The same thing happened in late 2007, when the Federal Reserve (America's central bank) began cutting interest rates. Falling yields and a weaker dollar usually make it easier for stocks to recover.
How these cycles often play out
The author describes four stages:
- Fear peaks. People panic and sell. This is often when prices are lowest.
- Relief. Prices recover and everyone starts saying "the worst is over."
- Excitement. New record highs attract latecomers, and it feels safe.
- Quiet selling. Big professional investors sell to those latecomers near the top.
If 2026 follows 2007's script, the current dip could be followed by a rebound, but the later part of that rebound is where the real danger builds.
Spotting the distribution phase
In technical analysis, Stage 4 is often called the distribution phase. During this phase, headline indexes often make new nominal highs driven by a shrinking handful of mega-cap leaders, while market breadth, volume, and credit spreads quietly deteriorate.
What could prove this comparison wrong
The author is careful not to oversell the idea. Things that could break the comparison:
- The Federal Reserve: if it signals higher rates than expected, yields and the dollar could jump again.
- Oil prices: if oil stays above $100 a barrel, inflation stays high and rates stay high.
- Debt trouble spreading: if problems with AI-related loans reach banks, as subprime problems did in 2007, a "dip" could become something much worse.
- A narrow market: much of this year's gain came from a handful of AI companies. If they stumble, the rest of the market may not be strong enough to hold the index up.
What the author is watching
- Whether the 10-year yield stays low or climbs back up
- Whether the dollar keeps weakening
- Whether tech stocks lead the recovery, or safer sectors take over
- Whether the bonds of heavily indebted AI companies get riskier, since bond markets often warn before stocks do
Takeaway for beginners
- A rebound is not an all-clear. In 2007 it was a pause before the bigger drop.
- Debt is the thing to watch. Booms funded by borrowed money are more fragile.
- Lenders often see trouble first. When bonds start paying unusually high rates, that is worth noticing.
- Analogies are tools, not crystal balls. The author says it's better to prepare for both outcomes than to bet everything on one story.
This article is for education only and is not financial advice. Never invest money you can't afford to lose.
Share this post
If you found this article helpful, share it with others.Your Edge in the Markets
Access professional-grade trading models, indicators, and tools designed to enhance your trading strategy and improve market performance.