Private CreditAI
The Debt Nobody Can See: AI, Private Credit
2026-11-06
by Clain Tudor
A lot of the borrowing behind the AI boom sits in private credit, where funds mark their own loans and no one holds the full map. With the Nasdaq 100 already 13-15% off its high, here is what our models read and where the cracks would show first.
The short version
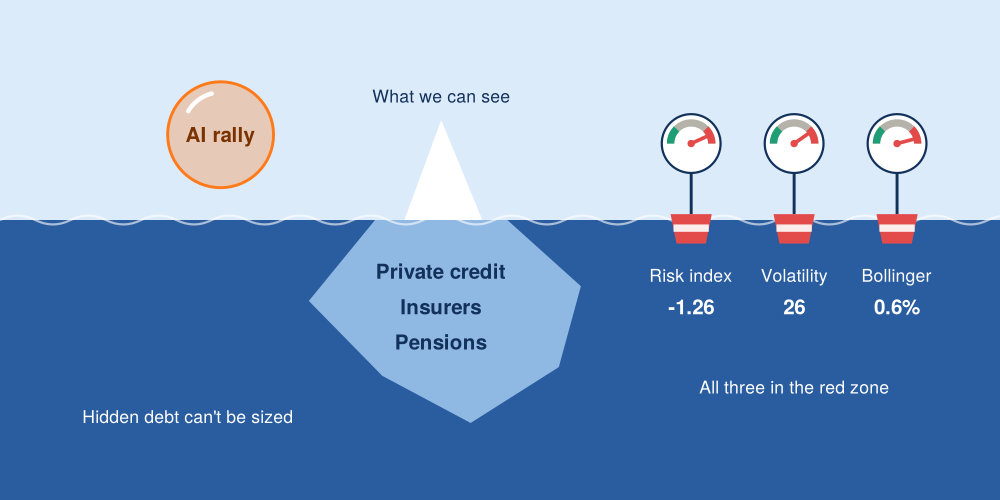
The next financial crisis could be harder to contain than 2008, and the reason is simple: we
can't see where the risk is hiding.
In 2008, the bad loans sat in products everyone could point to, mostly inside a handful of big
banks. When things broke, regulators knew where to look and who to rescue. Today, a lot of the
borrowing behind the AI boom is happening in private credit: loans made by funds instead of
banks. By one estimate, this market is about 8X bigger than it was in 2008. It grew in part by
sidestepping the rules that banks have to follow, and it's tangled up with insurers and pension
funds along the way.
Why that matters
Three things make this hard to size up:
- The funds grade their own homework. They set the value of their own loans, so a struggling borrower may not show up as a loss for a long time.
- Nobody has the full map. The funds, insurers and pensions hold pieces of each other's debt, and almost no one knows how the pieces connect.
- Losses won't stay in one place. If values catch up all at once, the pain spreads across many small funds and reaches banks, insurers and pensions, with no single balance sheet to fix.
The whole argument in one line
When you can't measure a problem, you can't price it, and you can't easily rescue it.
What the market is showing
Stock prices can't prove anything about private loans. But markets are priced every second, so
they're often the first place stress shows up. Here is what our indicators say about the Nasdaq 100
futures (NQ) today.
NQ is around 27,137, roughly 13-15% below its recent high, and three of our CandelaCharts
models are pointing the same way.
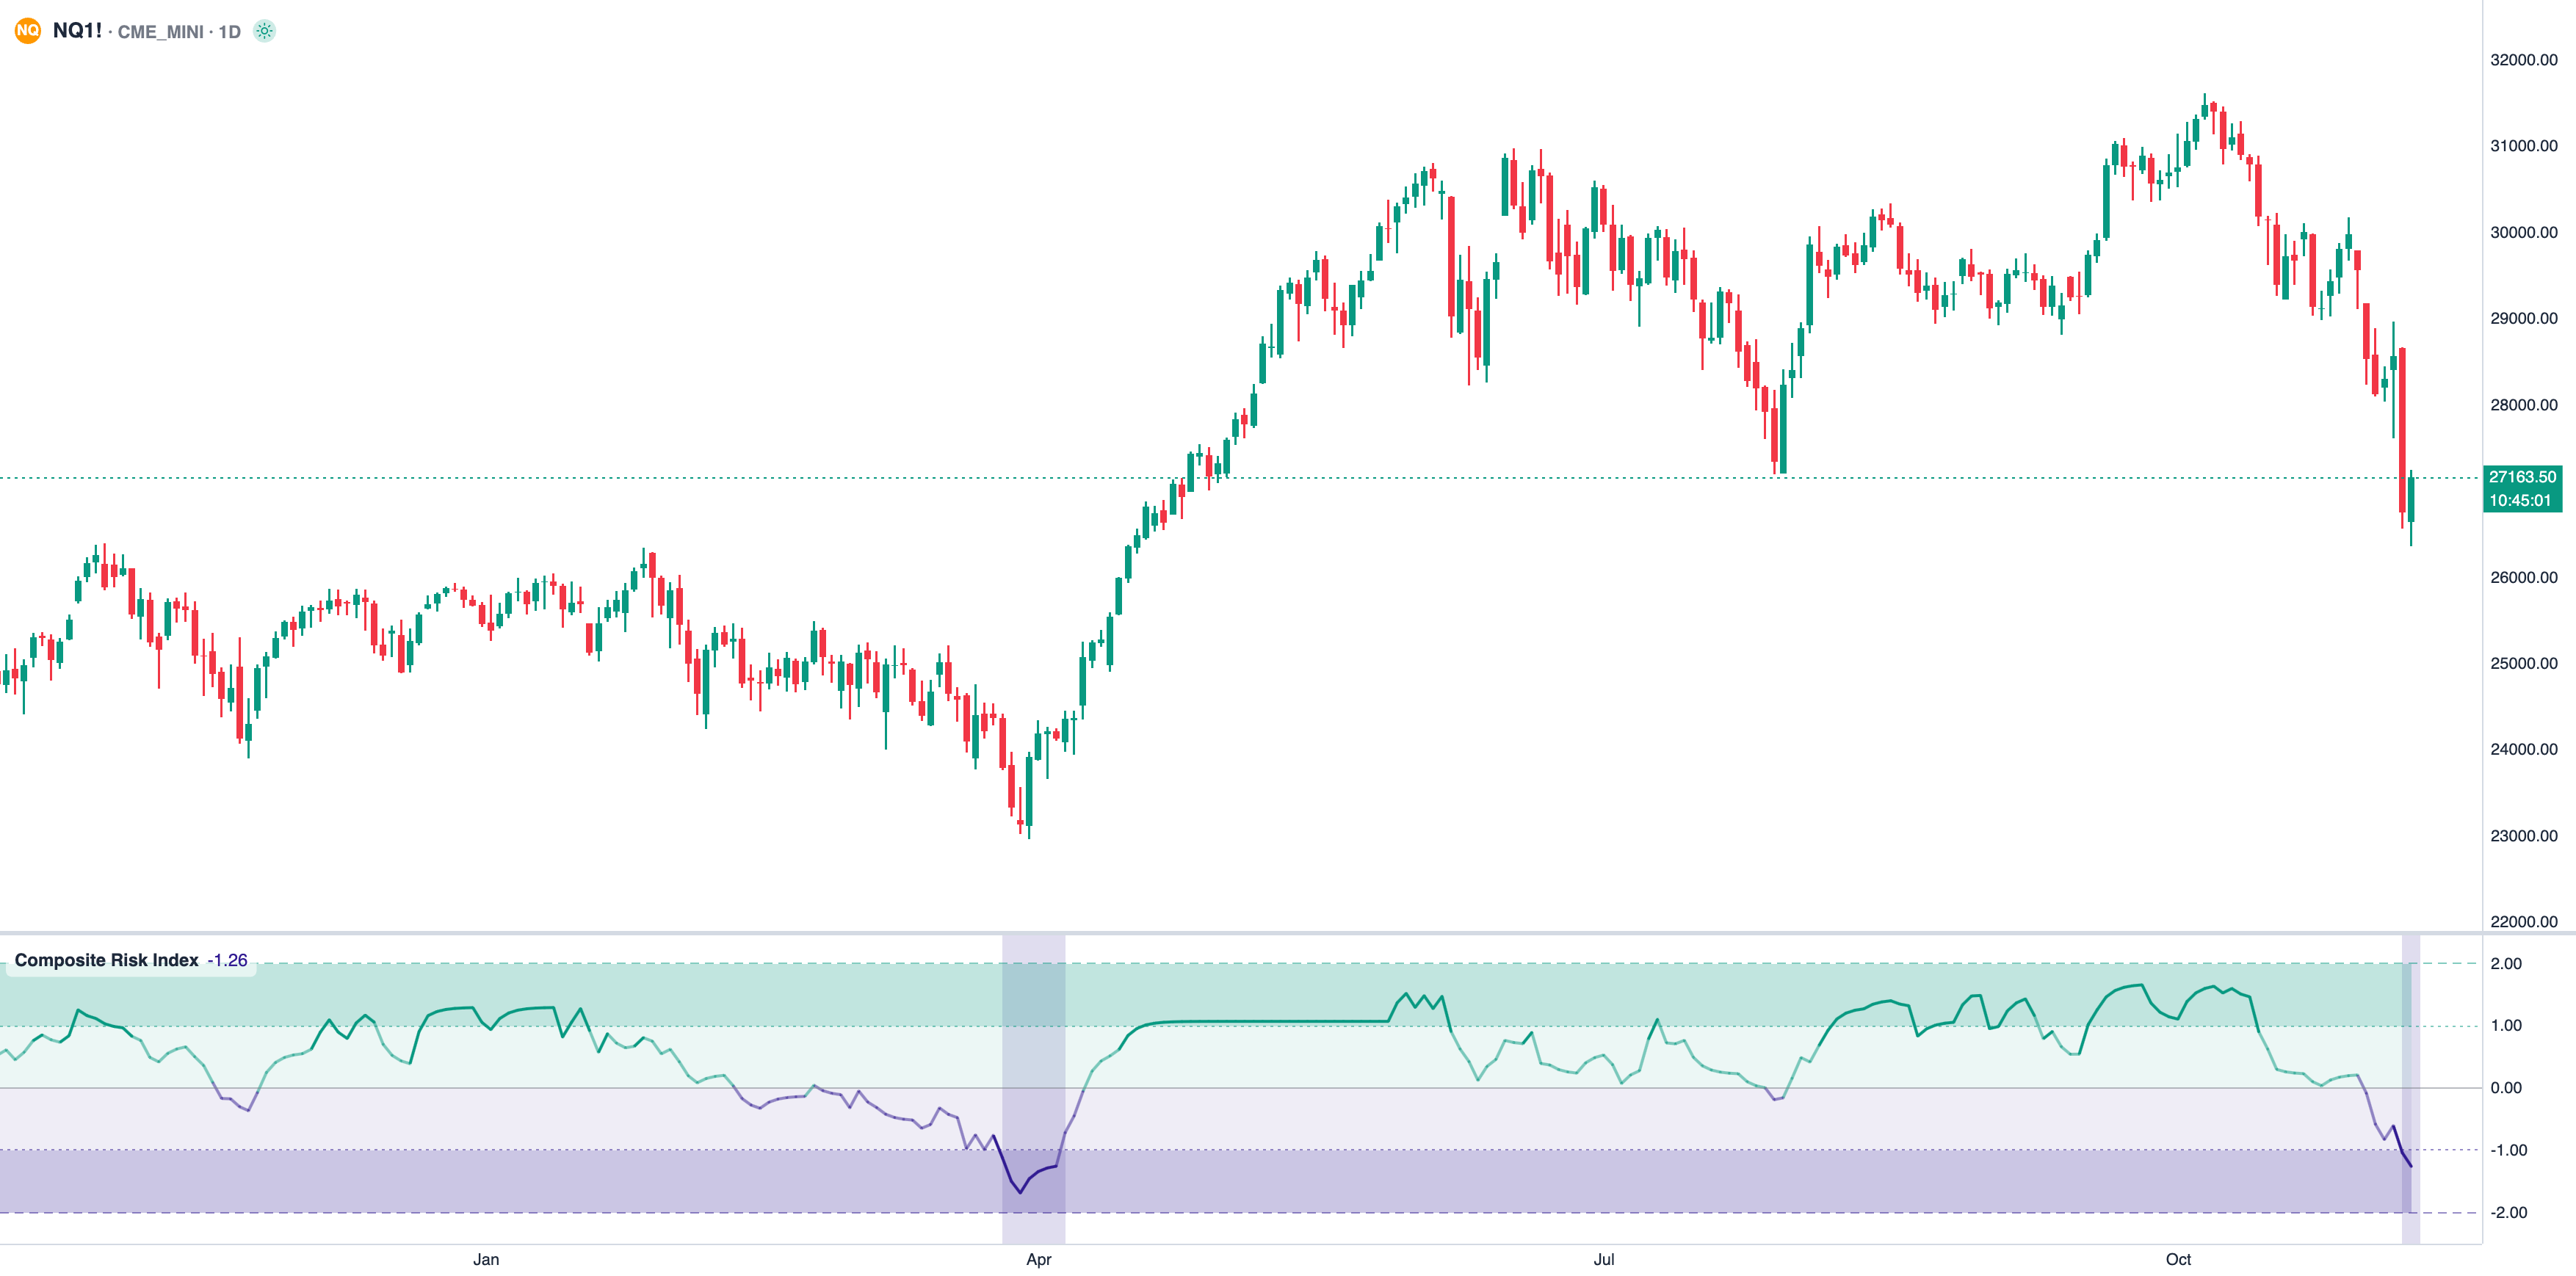
1. Composite Risk Index
The index is at -1.26 and heading toward its extreme low, after sitting at strongly positive
levels this summer. In plain terms, risk appetite flipped fast.
NQ daily — the Composite Risk Index at -1.26, down from strongly positive levels this summer
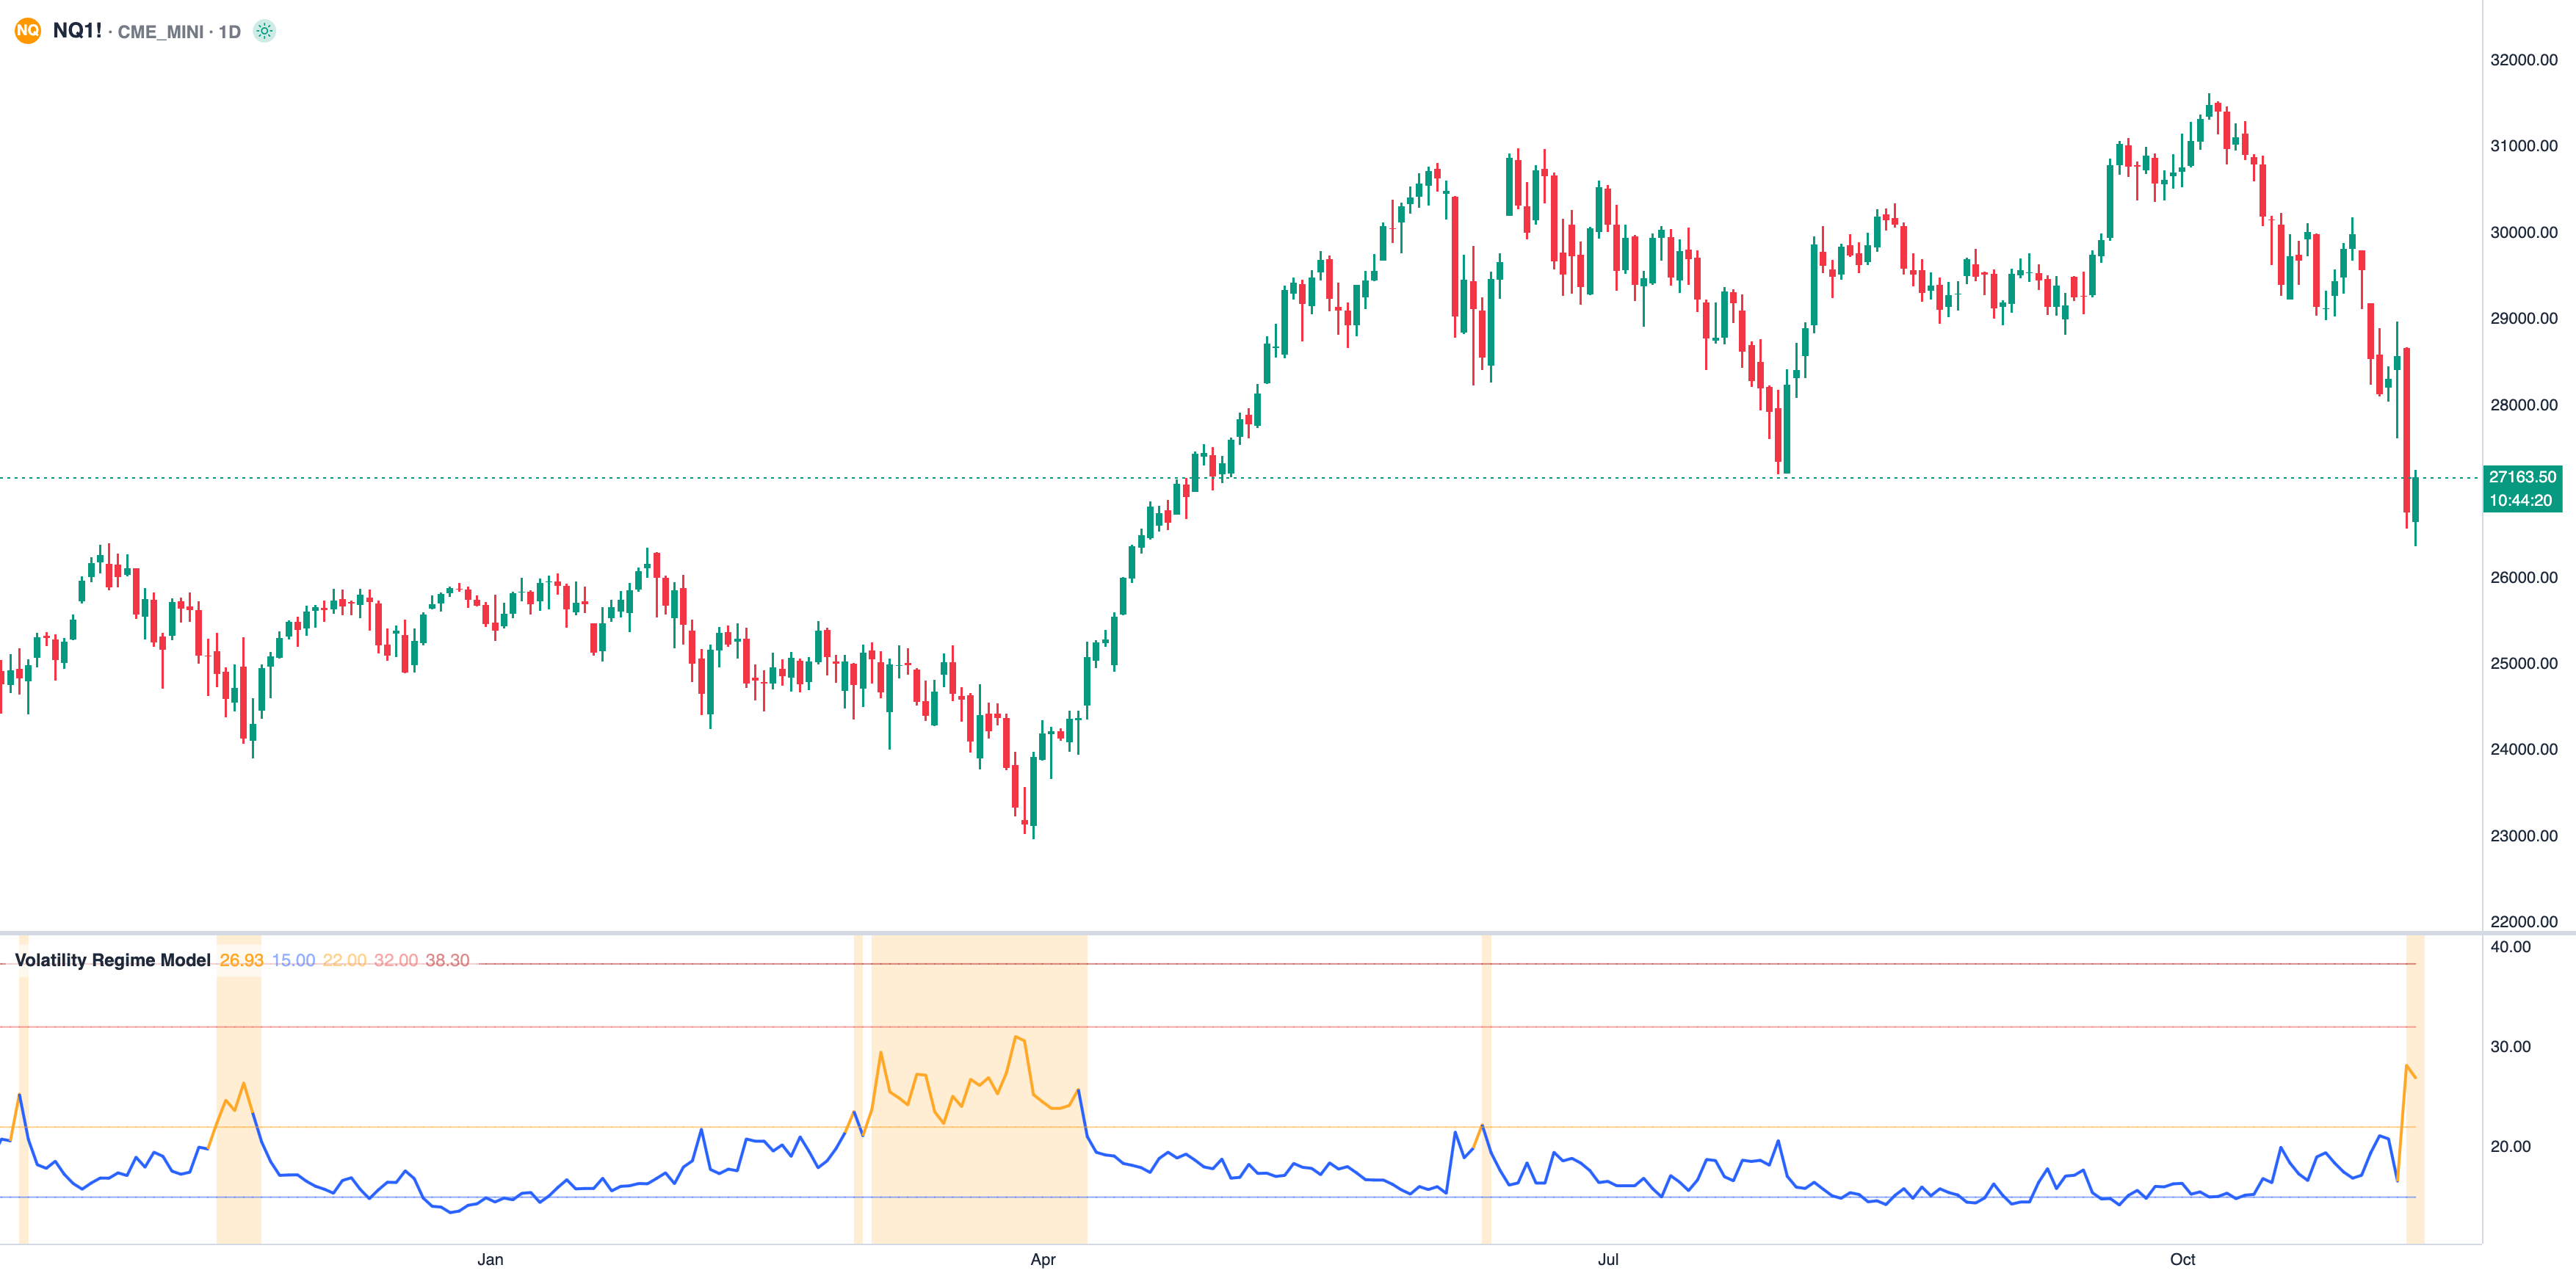
2. Volatility Regime Model
Our fear gauge reads 26, up from the mid-teens. In the spring it stayed high for weeks. This
time it has only just started, so it's early.
The Volatility Regime Model reading 26, up from the mid-teens
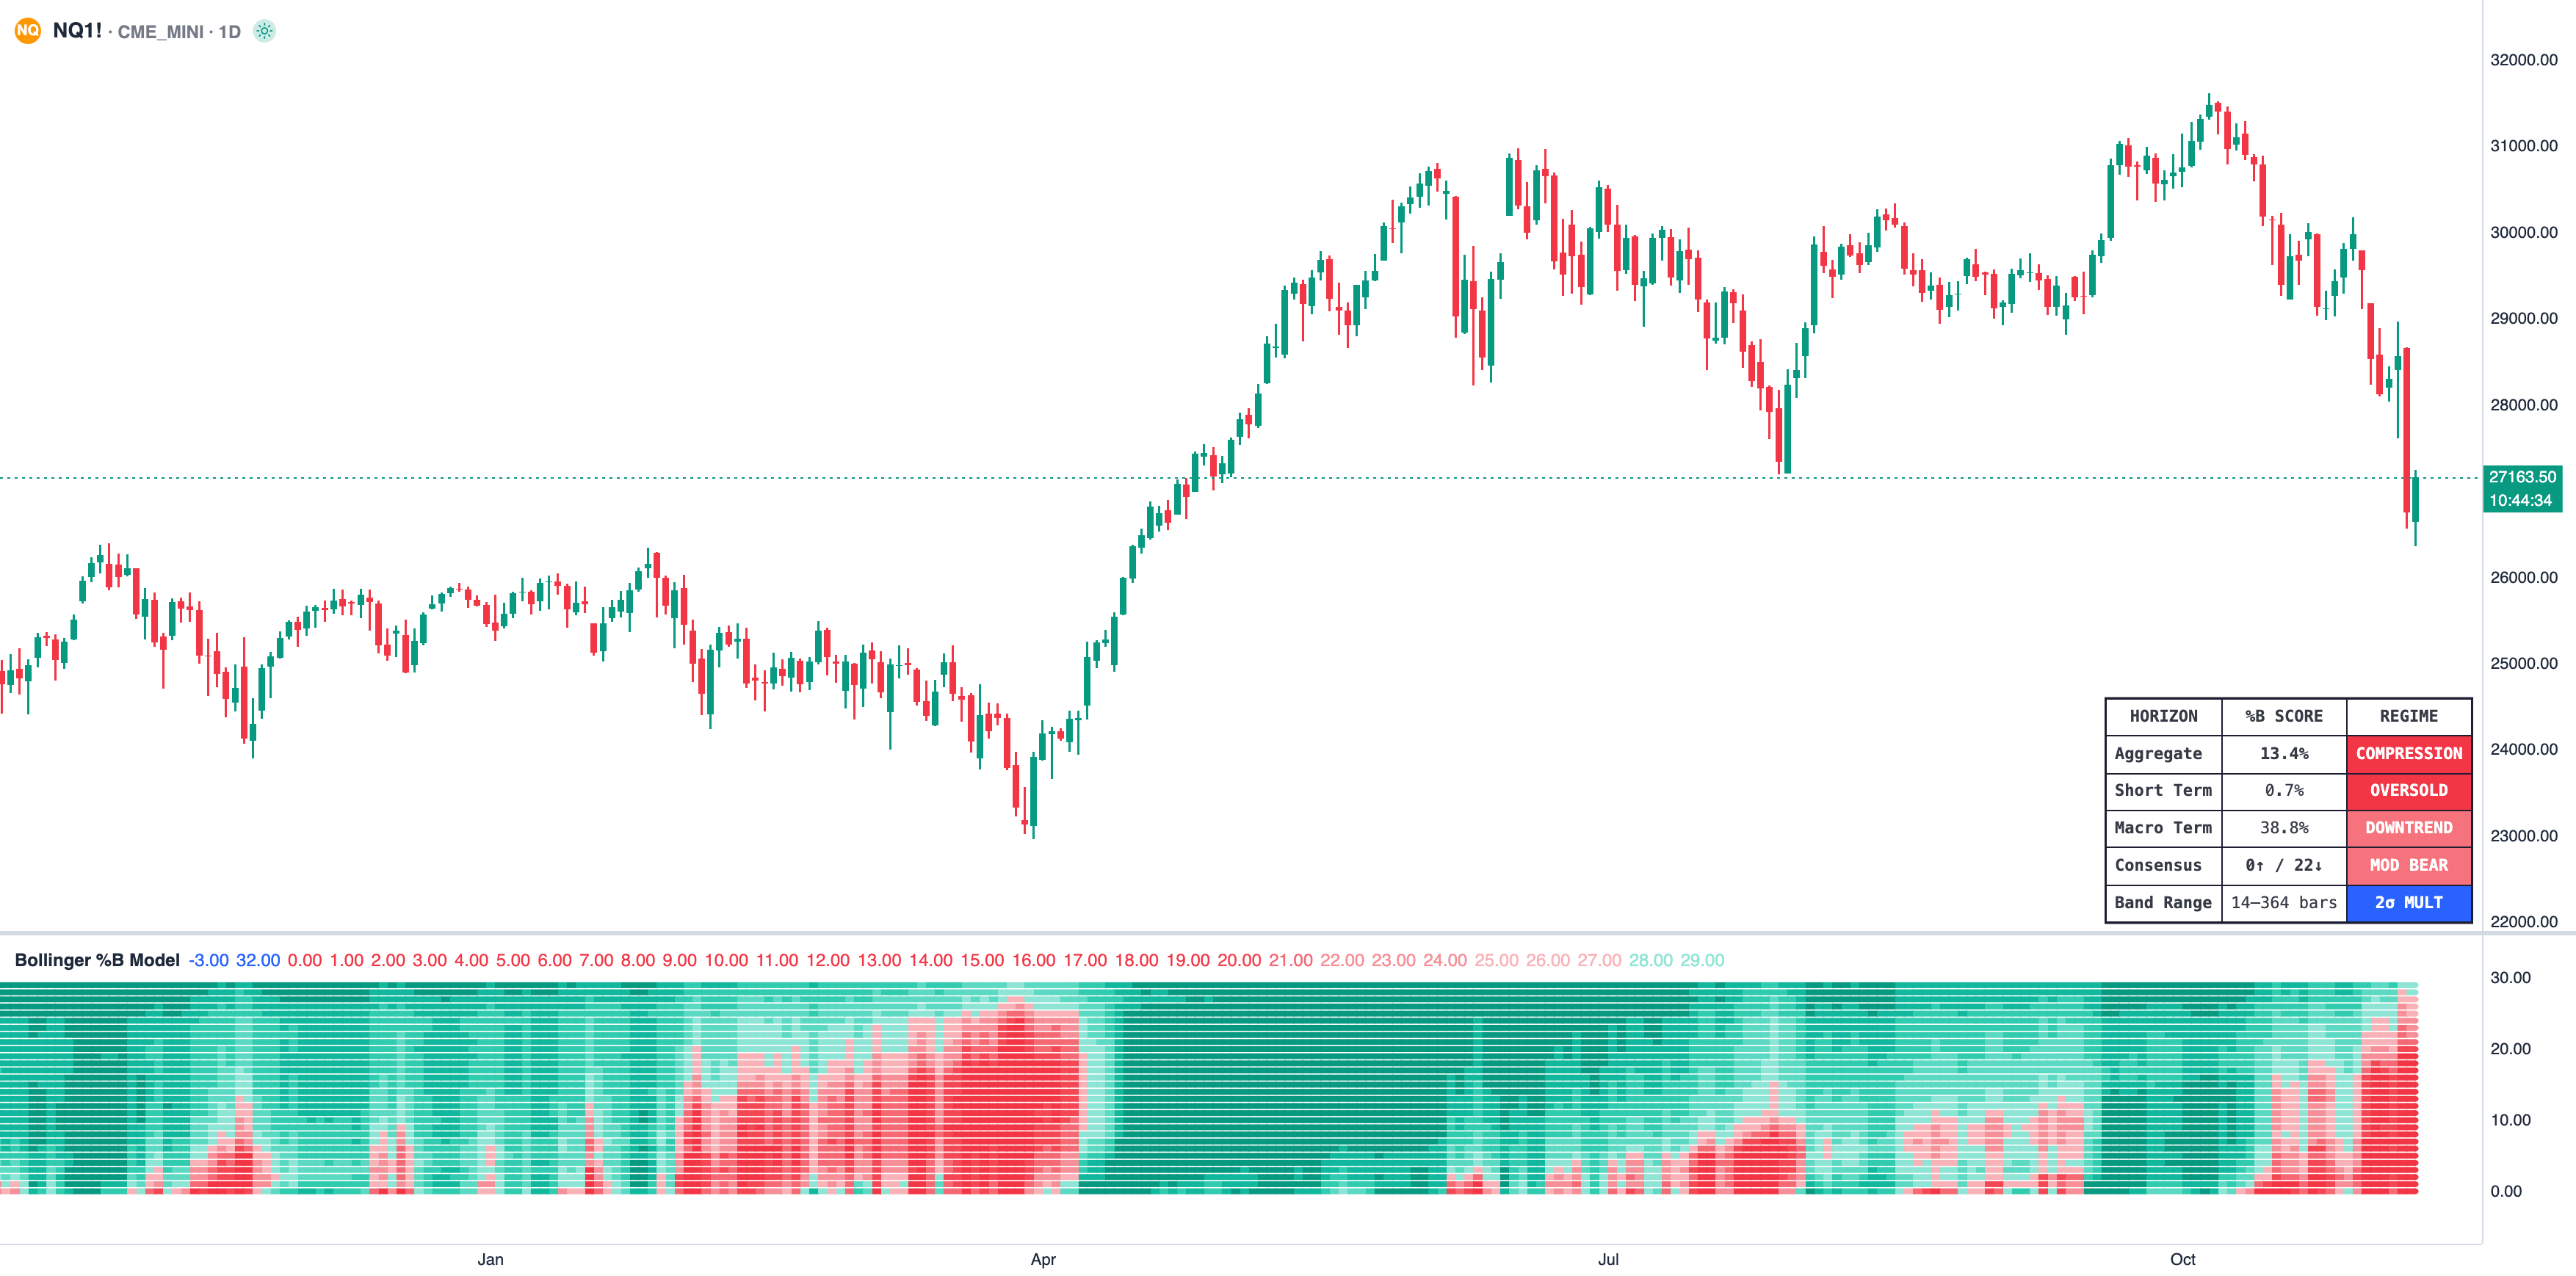
3. Bollinger %B Model
None of our 22 trend bands are pointing up. Short term, price is stretched near the bottom of its
range, so a bounce is likely and wouldn't change the bigger picture. Long term, the trend is weaker
but not broken.
The Bollinger %B Model — none of our 22 trend bands pointing up
The twist: the bubble may not burst yet
Here is a view worth knowing about: this is the largest bubble ever, and it will burst, just not
right now.
The idea is that we're in the phase where everyone gets set up sentiment-wise, so that a rally into
the real top can begin. In other words, a dip like this one could be the shakeout that gets people
positioned, before one more major rally carries markets into a final peak. Only after that does the
break come.
Our models don't rule this out. A stretched, oversold short-term reading is the kind of condition
that often comes before a sharp bounce, so a dip and a bigger rally can both be true. What matters
is how far a rally runs, and whether the warning signs below start showing up near the top.
That's one view, not a certainty. Think of it as a scenario to watch, not a forecast to bet on.
The other side of the argument
It's worth being fair here. Private credit funds often lock investors in, which makes panics less
likely than at a bank. Not marking losses also means fewer forced fire sales. Size estimates depend
on how you count. And governments have a record of stepping in when things get serious. Even a
correct warning can take years to play out.
What to watch next
If this is more than a stock market pullback, the cracks should appear where private credit meets
public markets:
- Listed lending funds trading well below the value they report
- Funds limiting or delaying investor withdrawals
- Corporate borrowing costs rising sharply
- Insurers and pensions disclosing problems with these loans
- Our volatility reading staying above 22, and the risk index failing to climb back above zero
Bottom line
The real risk isn't a prediction, it's a blind spot: if there are losses in this hidden corner of
finance, nobody can say how big they are. Our charts say the market is nervous and the short-term
trend has turned bearish, but the bigger picture hasn't broken yet. Watch the edges, not the
headlines.
For education only, not financial advice. Futures trading carries a high risk of loss.
Share this post
If you found this article helpful, share it with others.Your Edge in the Markets
Access professional-grade trading models, indicators, and tools designed to enhance your trading strategy and improve market performance.